By Ed Caryl
The sun supplies about 1360 watts per square meter to the Earth as seen by satellites at the top of the atmosphere. This power varies by about 1.3 watts over the 11-year solar cycle. Energy is reflected back to space by clouds and the earth’s surface. Some energy is radiated to space as infrared. Energy is radiated from the atmosphere to the surface, the so-called greenhouse effect. There is variation in all the factors that make up the radiation balance. None of the factors are fixed. CO2 may be increasing, but other factors are also changing. The albedo of the Earth varies with the amount of cloud cover, seasonal vegetation, ice, and snow. Of course the heat seen by any part of the Earth depends on the sun angle; the maximum is when the sun is directly overhead, almost none when the sun is on the horizon, none at all when the sun is below the horizon. The Earth loses heat to space by radiation, but this also varies with time of day, cloud cover, temperature, and humidity.
Water vapor accounts for 60 to 95% of the greenhouse effect. The remainder is due to CO2 and other trace gases. According to the IPCC the theoretical extra absorption by CO2 in the atmosphere if it doubled from the current amount is 4 watts per square meter. This extra absorption will be modified by clouds, cloud height, humidity, and other factors. According to the same source, the extra absorption at current levels of CO2 above the historical level is about 1 Watt. This additional energy is offset and balanced by the other outgoing factors. For an excellent explanation of the greenhouse effect see: http://www.ucar.edu/learn/1_3_1.htm.
Figure 1 shows how solar energy input is balanced by the radiated and reflected output. The 342W per square meter solar input figure is an average over the Earth’s surface that supposedly takes into account sun angle and the night and day cycle. This graphic is from Wikipedia and is seen in many publications in two versions with slightly different numbers. It originates with Kevin Trenberth et al.
One of the criticisms of this graphic is that the 342 W/m2 Back Radiation is assumed to be completely absorbed by the surface with no reflection. This would require that the surface be a perfect black-body at all wavelengths. This is obviously not the case. Another criticism is that it inadequately describes the difference in radiation conditions between night and day, and the variable influence of clouds.
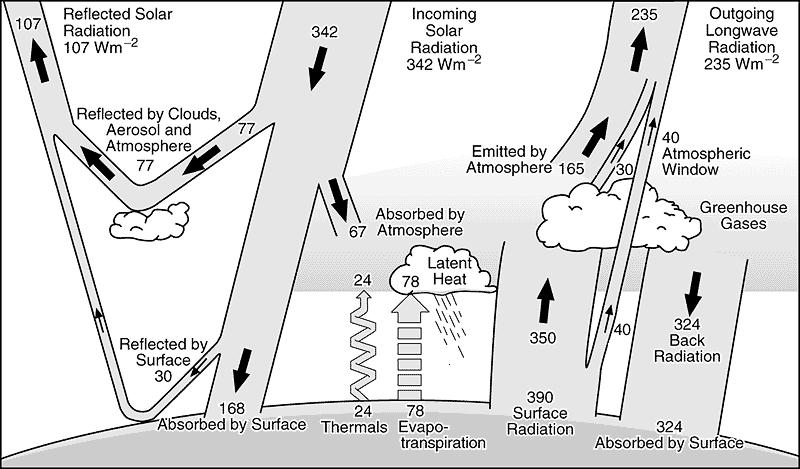
Figure 1: Earth’s radiation balance according to Kevin Trenberth et al.
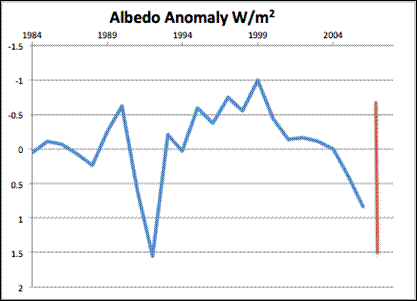
A third criticism is that it does not take into account the Earth’s albedo changes over time. Albedo is the percent of solar radiation that is reflected back to space by the Earth’s surface and clouds. The Earth’s albedo is measured by satellite or by looking at earthshine on the moon, the light from Earth reflected back from the lunar dark side. Here are Earth’s albedo changes from 1984 to 2004.
Figure 2, Earth’s albedo: The red vertical bar represents the total forcing of all the greenhouse gases added to the atmosphere in the last 100 years. Using the IPCC figures, they add up to about 2.8 W/m2, about the same as the albedo variation. Clearly the albedo variability is the same as the greenhouse gas forcing, especially over any short term. The albedo change is primarily due to cloud and ice changes. Data source: Pallè et al here.
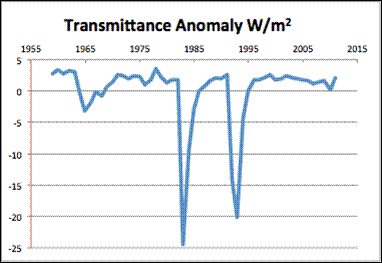
Albedo isn’t the only variable in the radiation balance graphic. The opposite of albedo (reflectance) is transmittance, the percentage of solar radiation that reaches the surface. This is also a variable, changing with the amount and kind of aerosols in the atmosphere. Since 1958 this has been measured at Mauna Loa Observatory in Hawaii, the same place that CO2 is measured. Their data is stated in percentage and is taken under the following conditions.
The ‘apparent’ transmission, or transmission ratio (Ellis & Pueschel, Science, 1971), is derived from broadband (0.3 to 2.8um) direct solar irradiance observations at the Mauna Loa Observatory (19.533 ° N, 155.578 ° W, elev. 3.4 km) in Hawaii. Data are for clear-sky mornings between solar elevations of 11.3 and 30 degrees.”
In the chart below the data has been converted to energy anomaly, based on the solar irradiance at the top of the atmosphere, 342 W/m2, in Figure 1 above.
Figure 3: Atmospheric transmission anomaly in terms of energy in Watts/m2.
You can see that the transmittance anomaly is quite large, even disregarding very large perturbations such as the Agung, El Chichón, and Pinatubo volcanoes. Pinatubo is also visible in the albedo data. All traces are annual averages.
Figure 4: Annual albedo and transmittance in W/m2, and global annual satellite temperature anomaly plotted together.
Because transmittance and albedo are inversely related, in the chart above, albedo (the red trace) has been inverted so that transmittance, albedo, and temperature can be related. The temperature anomaly is scaled on the right axis. The two volcanic eruptions and the last two El Niño’s can be clearly seen in the temperature. The dip in transmittance in 1963 is the Agung volcano. All three volcanic eruptions were sulfur-rich and pushed gasses and dust into the stratosphere.
What about greenhouse gases?
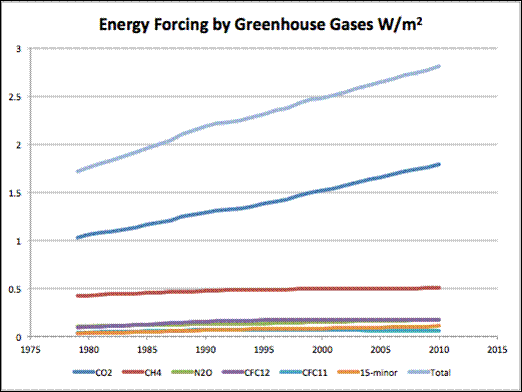
Figure 5: Greenhouse gas forcing since 1978.The scale is also in W/m2. Source.
Figure 5 uses the IPCC figures for greenhouse gas forcing, 4°C for CO2 doubling, which may overstate the numbers. CO2 and methane (CH4) dominate the total. But let us plot the total greenhouse gas forcing (the top trace in Figure 5) on the Figure 4 graph.
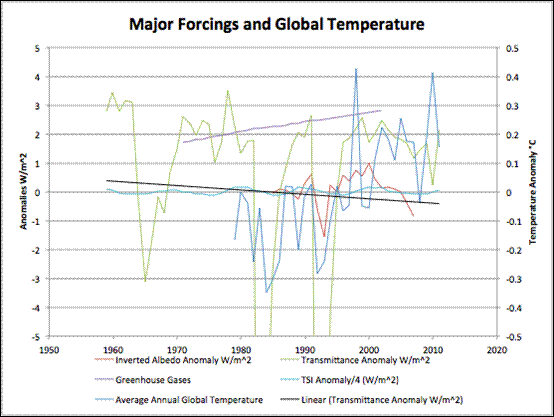
Figure 6: Albedo, greenhouse gases, transmittance, and TSI anomalies plotted together with the Global Satellite Temperature anomaly. The transmittance linear trend line is also included. The vertical scale has been changed, truncating the large negative transmittance spikes, so that the smaller forcings can be seen.
The TSI anomaly has been added to Figure 6 along with the greenhouse gas trace. Note that the transmittance trend is in the opposite direction of the greenhouse gases, and is of similar magnitude.
It is clear that aerosols, albedo, and ocean cycles are very largely what drive global temperature in the short term. Carbon dioxide is a minor player. TSI (total solar irradiance) plays very little direct role on this time scale. If the sun has an effect it must be via some other mechanisms.
Because we know so little with certainty about water vapor, it has been left out of this analysis. Water vapor is a very important greenhouse gas, by some accounts resulting in 60 to 95% of the greenhouse effect. The problem is that because water exists in all three phases in the atmosphere, and convection, evaporation, condensation, and precipitation produces wildly variable amounts at different altitudes, times, and locations, calculating the resulting forcing is very problematic. In general, water vapor tracks temperature. In the lower troposphere, this has meant that water vapor is increasing along with temperature. Some have stated that this results in positive feedback further increasing temperature. But in the stratosphere, the temperature has been decreasing, and so has the water vapor content. (See discussions here and here.) This allows increased radiation to space. As a result, others have argued that this results in negative feedback. It may well be that the two variabilities cancel.
Among the variables that control climate change, atmospheric transmission is by far the largest factor. Even in the absence of volcanic activity, upper atmosphere aerosols vary on a scale that dwarfs the other factors. Ocean cycles are next in importance. Third in importance is albedo. The reflection of clouds, ice, smoke, land and sea surfaces are continuously changing. Fourth on the list are the greenhouse gases excluding water vapor. The big unknown variable is water vapor. We know it is varying. To some extent we even know how much. What we don’t know is what forcing water vapor provides. We don’t even know where water vapor ranks on this list.



That was a great build-up, Ed. Thanks. Someone should turn it into a video.
Long term NOAA measurements of water vapor content – with growing CO2 content, the water vapor content falls, as predicted by Miskolczi, keeping the overall greenhouse effect constant.
http://c3headlines.typepad.com/.a/6a010536b58035970c0147e2fc6895970b-pi
I wonder – if the EU accuses a nation of emitting too much CO2, could they use this as defense? “Your honour, we have taken precautions against an increased greenhouse effect by removing a matching amount of water vapor from the air.”
Taking a clue from another zealous belief system that wears green as its primary color: shouldn’t we call it “climate jihadism”?
“Ed Caryl: Water vapor accounts for 60 to 95% of the greenhouse effect. The remainder is due to CO2 and other trace gases. “
Does this notion tell us a lot about how our climate works? Generally speaking, CO2 is in place on the earth and the moon. Humidity AND the oceans ensure an quite stable mean temperature at a level of about plus 14°C on the earth , on the moon the temperature averages is 107° C during daytime , although it rises as high as 123 C. The night cools the surface to an average of -153° C. The overall mean temperature on the moon is substantially below zero (about -20°). The humidity sustains the earthly average temperature only a few hours after sun set, before the sea ensures the enormous difference to the moon. Just observe the phenomenon of sea- and land wind (changes between day and night time in coastal areas), and at the ocean regions at higher latitude during the winter season. The oceans and seas have a much higher influence, on any time scale (from seconds to years) , as the paper suggests, IMO! Very much more attention should be given to the oceans!
“Energy is reflected back to space by clouds and the earth’s surface. Some energy is radiated to space as infrared.”
OK. I get that.
“Energy is radiated from the atmosphere to the surface, the so-called greenhouse effect.”
Now I’m confused: just as water flows downhill, doesn’t energy flow from hot to colder? Not from cold to hot: something about the Second Law of Thermodynamics.
How does this happen?
Have you noticed that if a night is cloudy, it stays warmer at the surface than if a night is clear? Both the clouds and space are colder than the surface, yet the clouds will impede the loss of heat from the ground because they are warmer than space. Further, if there were no atmosphere at all at night, the ground would then look like the surface of the moon, and would lose heat much faster. Only heat flows. Cold is just the absence of heat. In the above examples heat is flowing in both directions. The balance, the difference, is what determines how fast the surface cools. The greenhouse gases change that balance. All the argument is over how much.
since when is the solar “constant” about 1650 W/m² ? So far it had been 1360 W/m², with changes throughout the year (due to varying distance of the earth to sun) in the single digit % range.
Thanks – fixed.
Typo – thank you PG.
Is this figure of 1650 W/m2 the maximum? is it 1650 W/m2, per second or daily average?
If the 1650 W/m2 is the maximum energy reaching the earth then how can the average value of the TSI of 1,368 W/m2 that varies on a daily basis equate to 1.5 w/m2 over an eleven year solar cycle?
For example during a strong cycle and if 1650 W/m2 was the recorded max then the TSI of -1.5 W/m2 per day would have to be deducted from the overall energy budget of the 11 year cycle during minim, and [X] amount deducted from the TSI W/m2 per day during the decline from maximum, that’s enormous amount of energy loss.
If 1650 W/m2 is an estimate of the daily average and 1.5 W/m2 is what the TSI varies over one entire cycle then the math does not add up IMO, and if the math doesn’t add up at this stage then the rest of work based on this assumption is just a messy piece of guess work.
Even with the typo the main point of Ed’s article is clear – the difference in magnitude of the various factors, and how small CO2’s influence is in relation.
You’re right to point out the wrong number but your verdict “messy piece of guess work” is just a slimy insult.
DirkH
25. April 2012 at 18:38
I knew it was a typo (because TSI is a variable I used this typo anyway) this wasn’t my point, I wasn’t referring to the typo or what P Gosselin had to say in his post, I agree with it. Apologies if I came across that way.
I’ve have a mathematical issue with how TSI is converted to an energy anomaly and calculated into earths energy budget.
It doesn’t add up! maximum TSI over a period of time adds to the earths energy budget, but daily minimum TSI is incorrectly correctly calculated where the sum of energy loss is not deducted from the estimated total energy anomaly, so based on this I was inferring that Trenberth et al’s assumption based on this is just a messy piece of guess work.
Sorry again, sometimes I don’t make much sense when I’m rushed of my feet some days.
🙂
Okay, it wasn’t clear from your writing.
Sorry!! 🙂
Oh, I agree. I use Trenberth’s numbers because they are about all we have, they are probably not too far off, (+/- 20%) and they are so widely quoted. My point (worth repeating) is that all those numbers are variables, some wildly variable compared to CO2. Even TSI varies by 3 to 5 W/m^2 on a daily basis.
Thanks Ed, I’m glad we’re all back on the same page again!
🙂
Dear Ed, I would suggest you publish your calculations and thoughts for review as an overview article in an open review journal like for instance Atmospheric Chemistry and Physics Discussions…
The journal is open for everybody with an academic degree.
http://www.atmospheric-chemistry-and-physics.net/review/review_process_and_interactive_public_discussion.html
Ed, are you aware of this new piece of information concerning the fluctuation of the OLR according to the temperature:
http://theinconvenientskeptic.com/2012/06/olr-data-is-once-again-available/
which makes the IPCC theory of a “CO2-trap” look rather questionable:
http://hockeyschtick.blogspot.fi/2012/06/graph-that-disproves-agw.html