 Is CO2 the main driver behind climate?
Warmist scientists would have us believe it is. One recent European study claims that CO2 and temperature rose simultaneously at the end of the last ice age, implying CO2 is a real driver. However, one prominent German meteorologist dismissed it and bluntly called the Laboratoire de Glaciologie et Géophysique de l’Environnement study by Parrenin et al “the latest gag“.
Now yet another new study published at Quaternary Science Reviews shows in no uncertain terms that the sun, the source of almost all of the Earth’s thermal energy, drives the climate and that the climate naturally swings in cycles.
The paper looks at the relationship between climatic variations, vegetation dynamics and early human activity between c. 4150–2860 BC reconstructed from a high-resolution pollen and geochemical record obtained from a small lake located in County Sligo, Ireland.
The study shows that human activity responded to changing climate conditions over the period. No surprise there. For example the abstract writes: “A nearly century-long climatic amelioration between c. 3460–3370 BC facilitated a revival of human activity on a small scale around the lake. Abandonment of the area and full woodland recovery occurred after a period of particularly wet and cool conditions ranging from c. 3360–3290 BC.”
Over the period that was studied, the climate in the region fluctuated between cool/wet periods and warmer/drier periods, each having an impact on human activity. Scientists found greater activity during warm periods.
3990 BC episode of increased rainfall
3970 – 3820 BC: period of warming and drying.
3830 – 3800 BC: episode of high precipitation
3740 – 3630 BC: dry, Templevanny Lough lowest level during Neolithic.
3670 – 3460 BC: wetter, cooler conditions, substantial rainfall
3460 – 3370 BC: warmer, drier
3360 – 3290 BC: particularly wet and cool
3110 – 3050 BC: warmer, drier
3060 – 3030 BC: high rainfall
2940 – 2900 BC: high rainfall
The study reveals that the periods of climatic fluctuation were not isolated to just Ireland, but indeed are “in agreement with those of moisture/precipitation and temperature reconstructions from northern and western Europe and the Alps, suggesting that the studied period was characterised by a high-frequency climate variability“.
More importantly, what exactly was behind these climatic fluctuations? Human activity? Not at all. The scientists write:
These climatic shifts correspond to variations in solar activity, suggesting a solar forcing on climate.
Oh my, who would have ever thought it? After all, there are only hundreds of other similar studies from all over the world showing precisely the same thing.
CO2 is driving nothing
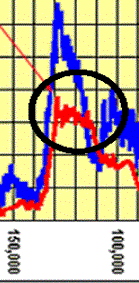
CO2 is hardly more a thermostat for global temperature than a thermometer is in your home. The following graphic is snipped from Petit et al 1999 here and shows the real (im)potency of CO2 in driving global temperature.
The blue curve above is the mean temperature and the red curve is CO2 concentration. From 130,000 to about 112,000 years CO2 was more or less steady at about 260 ppm. But look what happens to the temperature during this time. It dropped 9°C! You mean mighty “heat-trapping” Co2 wasn’t able to keep the planet warm?
Also note the lag. The same is clear for the other interglacials. Clearly the scientists of the Parrenin et al Paper made some gross scientific errors, or the study is just a sham.
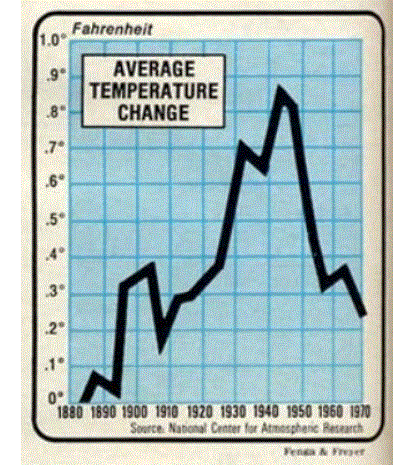
Let’s take a look at temperature vs CO2 from 1943 to 1970. During this time we know that atmospheric CO2 was rising. Yet look at what happened to temperature during that period:
Before-tampering temperature data. Source: National Center For Atmospheric Research, published in 1975 in Newsweek.
The temperature dropped more than 0.6°F. The same is happening today: even though atmospheric CO2 concentration is on the rise, temperatures globally haven’t risen in 15 years.
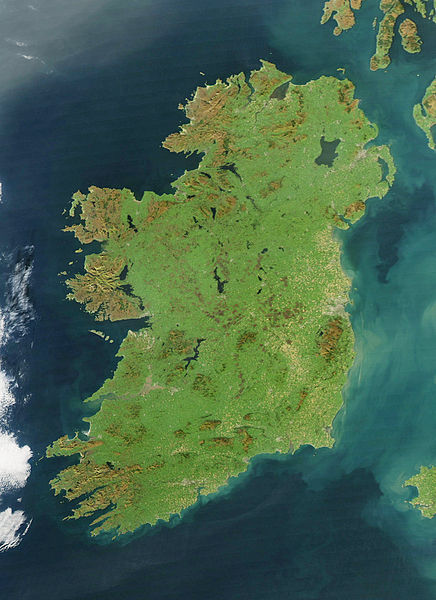
Ireland graphic credit: NASA (public domain).


Keep it up Pierre, we are getting the message over.
Thanks…and congrats on being a finalist in the best science blog awards!
Thanks for the post Pierre. Your ongoing efforts have made a huge impact. And likewise, yours too Roger. Thanks.
Henry’s Law, nothing more…
http://en.wikipedia.org/wiki/Henry%27s_law
RE_“Is CO2 the main driver behind climate?”
How could CO2 be a culprit in the early 1940s, and how could it generate extreme winters in Northern Europe? See NASA temp-map 1/Q, 1940/1941/1942: http://www.seaclimate.com/a/a3/mid/big/A3b-3_TM2.png
Even James Hansen does not blame CO2, but his fellow admire at NASA, David Herring says*) this:
____ Of greater concern to Hansen than global warming sceptics is the problem of global warming itself. If greenhouse gases are to blame then why did Earth’s average temperature cool from 1940-1970? And why has the rate of global warming accelerated since 1978? Hansen’s answers to these questions brought him full circle to where he began his investigation more than 40 years ago. “I think the cooling that Earth experienced through the middle of the twentieth century was due in part to natural variability,” he said. “But there’s another factor made by humans which probably contributed, and could even be the dominant cause: aerosols.”
*) http://earthobservatory.nasa.gov/Features/GISSTemperature/giss_temperature4.php
Winter 1940 is an important date in climatic research. What initiated the three decade cooling from 1940 to the 1970? The ToC to a book about the question is HERE: http://www.seaclimate.com/_ToC/_ToC.html
“But there’s another factor made by humans which probably contributed, and could even be the dominant cause: aerosols.”
They’ve been trotting out Aerosols forever to fudge their hindcasting. No GCM can hindcast without the right history of aerosol forcing (Which they invent as needed).
Reality – Model = Historic Aerosol Forcing
Hi Pierre, I plotted the Sunspot data from the Greenwich Observatory against minimum temperatures for Armagh, Stornoway airport and Oxford minimum temperatures from the Met office historical record. Solar activity does appear to precede the rise and fall of minimum temperatures.
The charts can be viewed here!
Solar activity (blue) preceding minimum temperature in degree C (green).
http://thetempestspark.files.wordpress.com/2013/02/nov-ssn-v-feb-tmin-1875-20121.gif
http://thetempestspark.files.wordpress.com/2013/03/stornoway-nov-ssn-v-mar-tmin-1875-2012.gif
http://thetempestspark.files.wordpress.com/2013/03/oxford-average-november-sunspot-number-and-march-minimum-temperature-1865-2012.gif
How do you think were CO2 and temperatures plotted in this graph? Both are on an absolut time scale. So how was the dating done for each of them?
The temperature and CO2 data both come from the same ice core data, so the dating is synchronous. There is possible offset error on the vertical scale. Temperature and CO2 were probably moving together until biosphere changes with warming halted the increase in CO2. In the modern era, we have destroyed grasslands and rainforests and impaired the “lungs of the earth..”
@Ed
Thanks for your answer and sorry: My question was meant a bit rhetorical. You were absolutely right BOTH are dated on the age of the ice. Whereas temperature IS really the ice (since the proxy is the isotopic composition of the ice) the gas age is computed by a firn model and other informations relativ to the age of the ice.
So if you make a zoom on a figure in a publication like here you should realize that CO2 is put on the time scale by a computation/model. If you use this to say: Look there is a delay between temperature and CO2 you actually say: I like the model/computation of the old paper better than the one of the new paper.
The results of the new paper use more additional data (nitrogen isotopes, methane fix points, multiple ice cores etc etc) and corrected the old computation. But for some reason someone here likes the old computation better than the old computation. In any case the computation was done by nearly the same people from the same laboratory.