At the SciLogs website, Stefan Rahmstorf of the über-alarmist Potsdam Institute for Climate Impact Research presents Part III of his Mann-hockey-stick-resurrection series.
Here he explains to his German readers how the temperature really developed over the Holocene and why the 20th century is “unique”.
To do this, Rahmstorf uses the findings of the already refuted Shaun Marcott et al paper, reminding us that Marcott et al “tried out 20 different averaging methods and carried out 1000 Monte Carlo-simulations ” in order “to confirm the robustness of their results“. Rahmstorf writes:
To put the main results in a nutshell, it appears as follows:
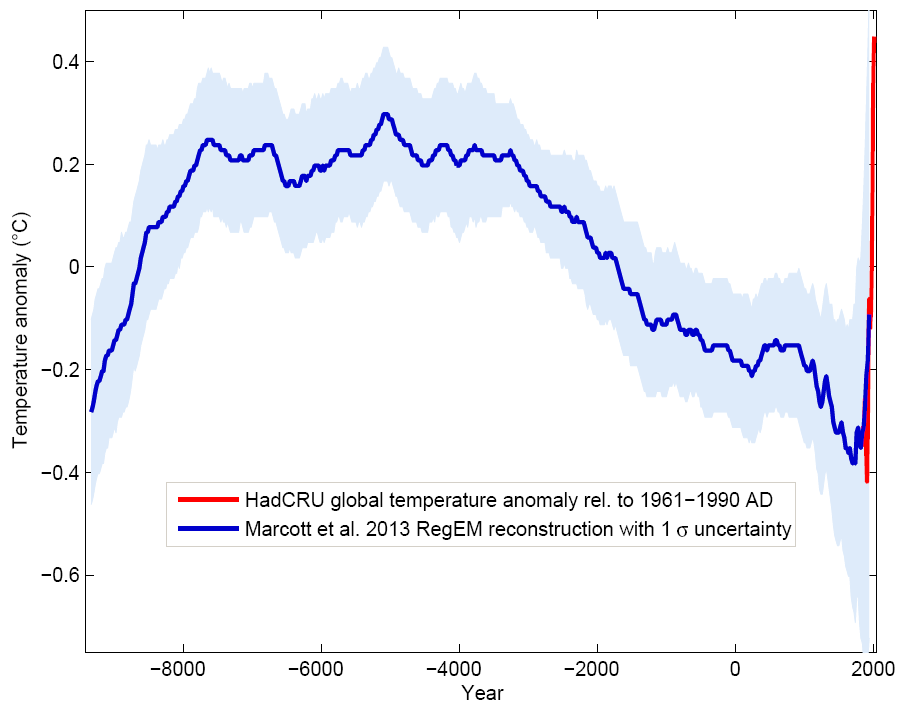
Fig. 1. Blue curve: global temperature reconstruction from proxy data from Marcott et al., Science 2013. Shown is the RegEM version – noteworthy differences between the variants with different averaging methods appear only at the end, where the number of proxy series decreases, but where the temperature course is well-known from the instrumental measurements. Red curve: global temperature for (HadCRU). Graphic: Klaus Bittermann.”
Next Rahmstorf explains how there had been a long term general cooling over 5000 years, and that that this was interrupted suddenly by a skyrocketing warming over the last 100 years, a warming that completely cancelled all the cooling that had taken 5000 years to accomplish.
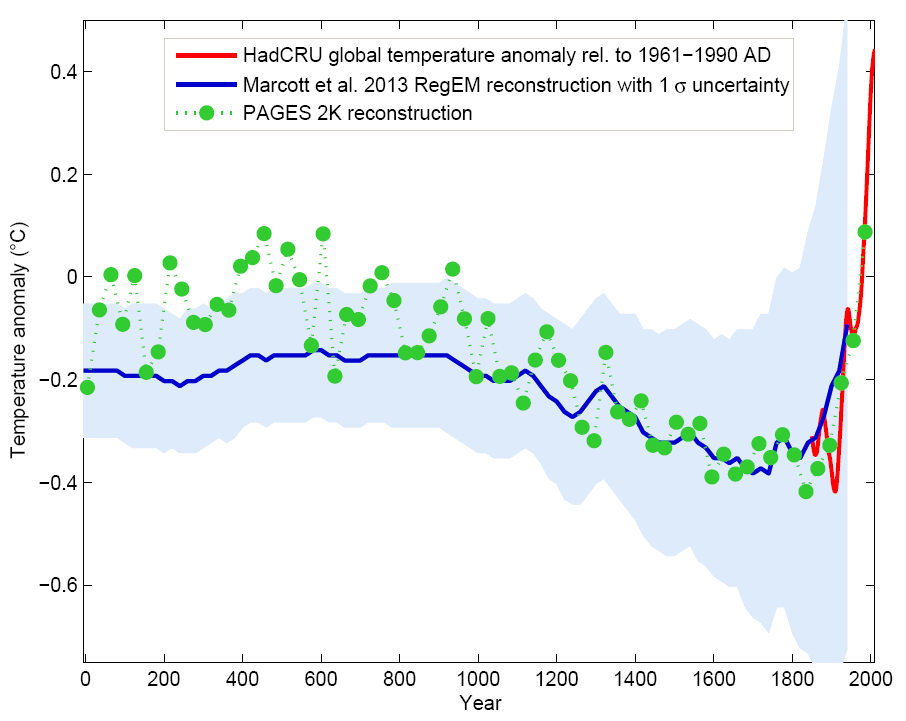
Rahmstorf then compares the Marcott reconstruction to the PAGES 2k reconstruction, as shown in his Fig. 3:
Fig. 3. The last two thousand years taken from Fig. 1 compared to the PAGES reconstruction (green), which is explained in Part 1. Graphic: Klaus Bittermann.”
On Fig. 3 Rahmstorf comments:
What we see is that both reconstructions produce consistent results. The course of the last 1000 years is practically identical and is, by the way, one more confirmation of the ‘hockey stick’ from Mann et al. 1999 – see part 2 of this series, The hockey stick debate.”
So now in Rahmstorf’s mind, the hockey stick is back to life (again).
Next Rahmstorf asks if the modern warming is unique, and explains the methodology used for the 20th century temperature reconstruction:
Because of the mentioned limitations of sediment cores, the new temperature reconstruction does not extend to the present, rather only until 1940, and the number of data curves used decreases significantly before that. (Therefore the shown range of uncertainty becomes increasingly wider near the end and reconstructions with various averaging methods diverge here – here we show the RegEM method because it works the best with the decreasing data coverage – see the blog from Grant Foster for more details, who is a professional statistician). The warming of the 20th century is therefore only captured to some extent, which is not a big problem because the warming is optimally documented by weather stations. There’s no doubt about the climate development of the 20th century.”
True there is no doubt about the 20th century. All the doubt surrounds the reconstructions over the course of the Holocene, and there’s very much in dispute. Moreover, splicing datasets coming from totally different measurement methods is dubious in the least, and is thus nothing less than creative curve designing. On the splicing, Rahmstorf comments.
There is a certain amount of room for play on how one splices the proxy data (blue) to the thermometer data (red) – Here I made it so that the mean value of the Marcott curve is the same as the mean value of the PAGES 2k reconstruction for the time period of 1000 to 1940 AD.”
Rahmstorf does admit that there are problems with the Marcott paper, yet feels that in principle it is correct and that the 20th century warming is unique, citing three reasons: 1) other proxies have never shown a warming like that seen in the 20th century during the entire Holocene, 2) statistics expert Grant Foster says so, and 3) such a rash warming must have physical reasons, and thus would have to disappear just as quickly.
Rahmstorf summarizes by saying that although the Marcott curve can be improved on, he believes that the course of the curve is “for the most part correct” and claims that a gradual cooling over the last several thousand years was abruptly interrupted in the 20th century.
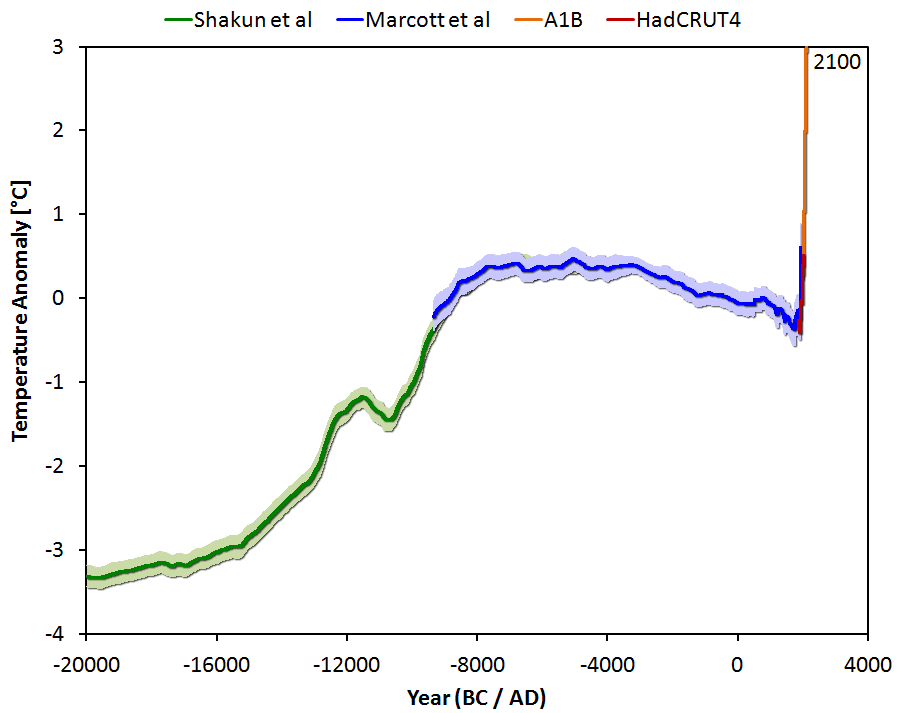
To drive the point across to his readers, Rahmstorf then reaches ever deeper into his creative curve-designing toolbox and next splices on a scenario produced by model projections that use the worst-case climate-sensitivities (which have been shown to have been completely exaggerated) to the already dubiously diced and spliced proxy/instrumental reconstruction. By now the curve looks worse than Evel Knievel did after his worst motorcycle crash:
Fig. 4. Global temperature since the last ice age 20,000 years ago and extended until the year 2100 for a intermediate emissions scenario with about 3°C of warming. Graphic: Jos Hagelaars.”
This is not above finger-painting of curves in climate-kindergarten.
Rahmstorf’s Fig. 4 tells us what will happen if we “do not rashly reduce our emissions of greenhouse gases”. He writes that “we are in the process of catapulting ourselves out of the Holocene.” and that if we continue on, “we will know longer recognize our Earth by the end of the century.”


So he calls a 1 C increase over 130 years as catapulting increase in temperature.
Ha ha ha……
I thought that the Marcott uptick was caused by one single outlier pushed forward in the required direction by redating the proxy, as admitted by Marcott. Check Steve McIntyre whether this is correct. No doubt about the twentieth century? I consider the surface record since 1970 totally corrupt (as I commented recently to Monckton at WUWT). While writing his junk science manual, Rahmstorf may devote some attention to Mann’s divergence problem and its logical solution.
Yes, one is tempted to laugh. But these people are so earnest in their belief system I’m tempted more to pity, except when I think of their effect on the world economy, then I get angry.
Looks like Stefan is taking comments for now. If someone were to simply point out that Marcott et al. 2013 hyperstick was removed from the UKMO website for “unfit for use”, I wonder if Stefan would explode…
Here is the link showing the Met Office removal of statement based on Marcott’s fairy tale.
We previously posted an article entitled “New analysis suggests the Earth is warming at a rate unprecedented for 11,300 years” covering the paper by Marcott et al in Nature. The title of our article drew on the original press release for the paper. However, we note that authors of the paper have since issued an extensive response to media coverage …………..
In the light of this statement from the authors, we no longer consider our headline to be appropriate.
http://www.myclimateandme.com/2013/03/12/new-analysis-suggests-the-earth-is-warming-at-a-rate-unprecedented-for-11300-years/
What I don’t get is Fig. 1. The Marcott (blue) line is basically in the center of the light blue area. However, at the end (year 2000) the light blue area goes from about -0.8 to about +0.5 Degree Celsius. The end point of the blue line is at about -0.05 Degree Celsius. The center should be more like -0.2 Degree Celsius. Why showing the bandwidth when the point Is ending somewhere else anyway. It’s like with Al Gore’s zig-zag CO2 curve. When faking graphics then PLEASE remove anything that shows us that you faked it. Marcott & Rahmstorf etc. are dumber than dumb.
Why is the temperature anomaly band getting wider when we have direct measurements? Temperature A (highest) and temperature B (lowest) is so far apart and all other once spread randomly within. This means that you have to select the measurement points very carefully or you get a positive or negative bias. It’s like with a lake where you can hide the Titanic but the average is only 10cm. If I use proxy data from one point or a collection of points, why do I have to compare this with some other point or other collection of points? You have to calibrate and the only way to calibrate is to use a reference you know everything about. This means that the measurement of the proxy and instrument should be at the same place.
Wow! He crossed over into pseudoscience. – does not justify Marcott and Shakun’s redating (and lies by omission by not telling his readers that they redated ). Does justify and actually performs a splicing of Marcott and Shakun to instrumental record. This is amazing. Here we have an IPCC “scientist” who claims that splicing together two signals with so vastly different resolution has scientific meaning. Rahmstorf is now officially the German Joe Romm – with the same scientific skill.
Isn’t such an equalization a debasement of Joe Romm ?
He deserves what he is going to get, ridicule from all those scientists that accepted the debunking of the Marcott paper.
Intersting is that Rahmstorf’s Fig. No. 4 shows only about a 4°C difference between today’s “hothouse” and the extreme ice age cold of 20,000 years ago. Most literature show about a 10°C difference.
“we will know longer recognize our Earth by the end of the century.”
Now THAT is a prescient prophecy! There will be a lot of snow and ice around. People are dying in Bolivia of snow and ice. Back in 2009 they were complaining about receding glaciers leaving them without water. Even South Africa is getting exceptional cold weather this winter.
As it did a few years ago; when the penguins froze.
To catapult ourselves out of the Holocene would be back to glaciation. Or does he mean we will further entrench ourselves in the Holocene?
Here is what Marcott has said in reply to a question on RealClimate.
“We are catapulting ourselves out of the future”. Wouldn’t that make a great sci-fi story?
What The Science Says: A drop of volcanic activity in the early 20th century may have had a warming effect. However, volcanoes have had very little impact on the last 40 years of global warming.
What do you mean with “What The Science Says:”; you could just as well have said “Proven Irrefutable Fact:” or “Holy Man Proclaims:”.
Last time The Science spake to me it said Trust no unsourced statements.
Precisely! Science is not authority.
He’s either an Al Gore or an SkS threadbomber. I saw that phrase on one of those sites. It’s really pityful that they can’t even write their own sentences. It’s one of those copy&paste snippets. And even worse, the snippet doesn’t even contain meaningful arguments.
Public Relation Men, what have you become?
BTW what hath The Science given as a reason that volcanoes stopped having an influence on the climate when they had that influence before. Sounds a bit like pulled out of your lower hind regions. Notice it is not The Science that resides there.