Can We Expect Extreme Weather – Continued
By Ed Caryl
In my last article on this subject, Can We Expect Extreme Weather, we examined the tropics, the mid-latitudes including the Arctic. At the time I had not found a plot of the mid-latitudes in isolation. Thanks to a comment by Alex, the search was resumed. Once one knows that data exists, it becomes easier to actually find it.
In this article we will examine the mid-latitudes alone, the latitudes between 25° north and 60° north, where most people live, and where most of the earth’s land mass exists. Again, we are using Remote Sensing Systems satellite data.
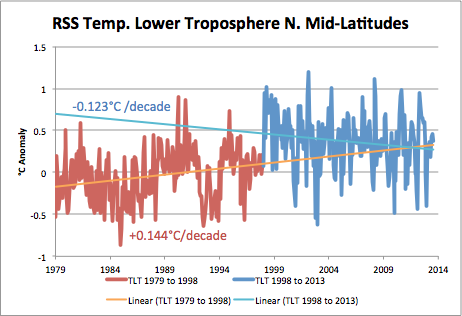
Figure 1: RSS lower troposphere temperature, (TLT) for the northern mid-latitudes between 25° north and 60° north, show cooling. The plot has been split between pre-1998 and post-1998.
1998 was the year of a very strong El Niño. In that year northern hemisphere temperatures took a step increase of about 0.4°C. Before that time, temperatures in the mid-latitudes were increasing from the 1970’s cooling at about 0.144°C per decade, despite the temporary cooling due to Mt. Pinatubo in 1992 and 93. After the 1998 El Niño step, the mid-latitudes began cooling again at about 0.123°C per decade. This natural recovery continues.
What are the extremes doing?
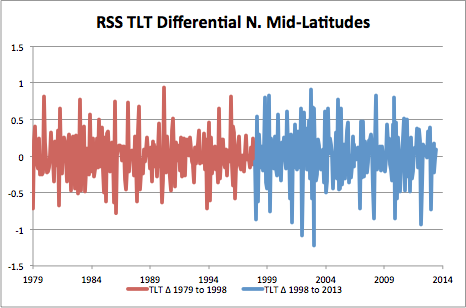
Figure 2 is a plot of the differential, point to point, of the temperature anomalies in Figure 1. These are the monthly extremes with the long term trend removed.
Note in Figure 2 that the northern mid-latitudes responded to the El Niño temperature step with several cold snaps (below zero) that continue to this day; monthly extremes that exceed the cold snaps of the 1980’s and 90’s. In contrast, the warm periods (above zero) are about the same in frequency and amplitude.
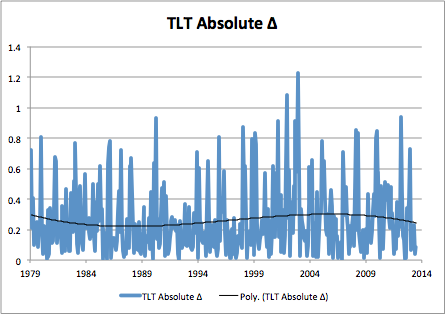
Figure 3 is a plot of the absolute value of the temperature extremes in Figure 2 with a 3rd order polynomial trend line applied.
If we look at the trend of all the extremes in the satellite era, we see a reduced trend in the 1980’s, an increase after the 1998 El Niño, particularly due to cold extremes, then a reduction in extremes in the last ten years.
Regarding the climate that most of us experience, in the northern mid-latitudes, we have cooling, a recent overall reduction in extreme weather, and no indication these conditions are radically changing.
It would be helpful if the Catastrophic Climate Clique would actually look at some data once in a while instead of hiding it and crying wolf. (How about a cartoon, Josh.)


Typo in first sentence…. Arctic and Arctic…
Good article… thanks for your great work
I should have said, “and the Arctic alone”.