Holocene Sea Levels
By Ed Caryl
There are many indications that sea level was much higher immediately after the last ice sheets melted 7000 years ago. There were other high-stands in the intervening years. Two sources are presented here that attempt to measure past sea levels.
Most Holocene sea level studies depend on geological and archeological evidence and a good deal of speculation. Two studies were found that have substantial evidence, presented in detail.
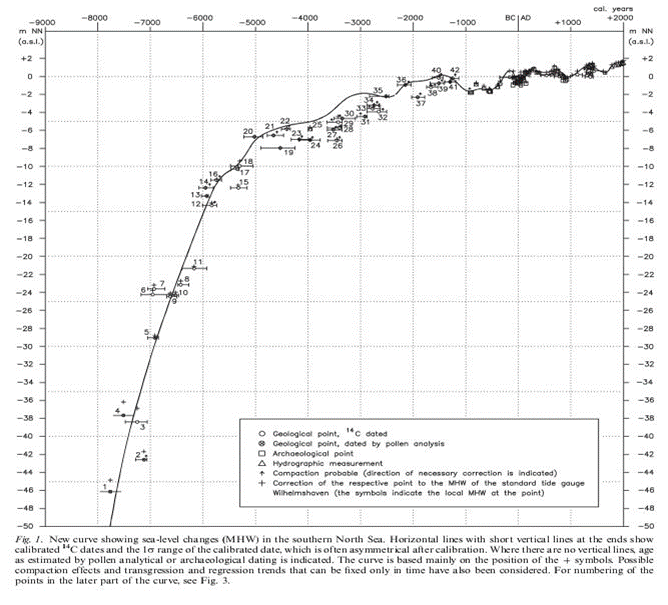
The first (Aus K.-E. BEHRE, Probleme der Küstenforschung, Bd.28, Isensee-Verlag, Oldenburg, 2003) was found as second and third hand charts in Frans J.P.M. Kwaad’s paper here, in Dutch, translated with Google Translate. The original Behre papers are behind a paywall, here. Other sources cite Behre, but some cast doubt on his work without offering alternatives.
From the charts, new curves were constructed in Excel so that Post Glacial Rebound (PGR) corrections could be made, and curves compared. Behre never took PGR into account in his work. He was also charting the high water marks, not MSL, so his charts set the present sea level to 1.75 meters. To correct for this, 1.75 meters were subtracted from his data. The data were collected in the stretch of seacoast called the German Bight, the area from Dutch Friesland to Danish Friesland, the south coast of the North Sea, centered on Wilhelmshaven.
I took the Wilhelmshaven PGR uplift figure as the starting point for the correction. PGR changes over time, doubling in about every 2000 years as one goes back to the end of the glacial retreat 7000 years ago. 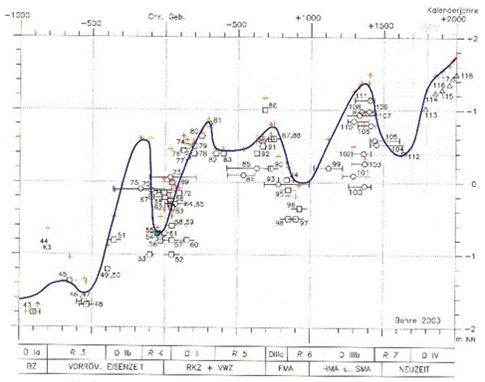
Figure 1a above
Figure 1b. Both Figures 1a and 1b are from F. J. P. M. Kwaad here. Click for larger view.
The next data are from the Western Pacific, specifically the Yellow River Delta and the Sunda Strait, taken from J. P. Liu et al, 2004, Holocene Development of the Yellow River’s subaqueous delta, North Yellow Sea. Marine Geology, 209(1-4): page 60. This chart describes the sea level rise at the end of the last ice age. Don’t be confused by the reversal in the horizontal axis. In the literature, time can run left to right or right to left. The time scales can also have zero at the birth of Christ, or at the present day.
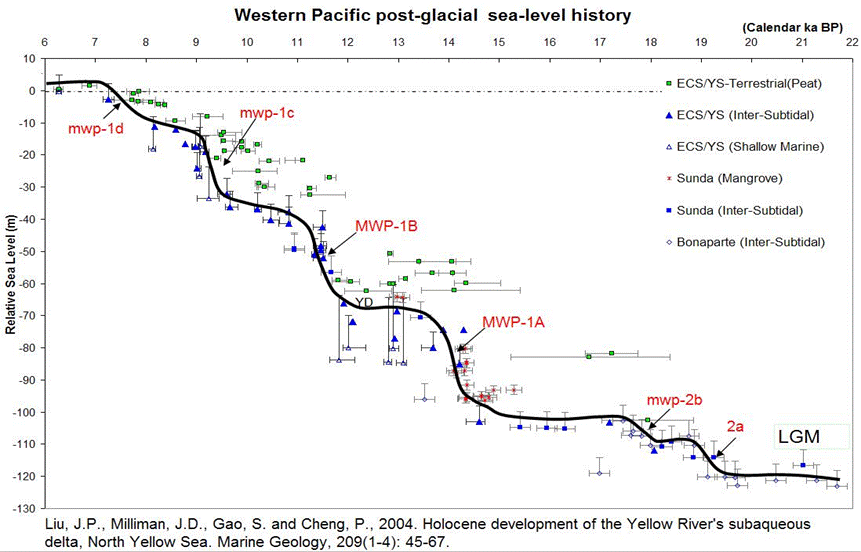 Figure 2 is the sea level rise from 22,000 to 6000 years ago.
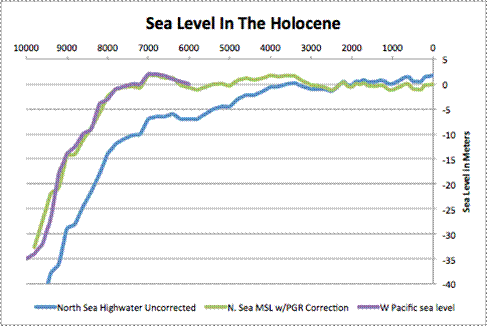
The data from these charts, with PGR and High Water correction, results are shown in Figure 3:
Figure 3 is a plot of the last 10,000 years of sea level, combining data from figures 1a, 1b, and 2.
In Figure 3, we can see the agreement between the two data sources for the period from 6000 years before present to 10,000 years before present, validating the procedure.
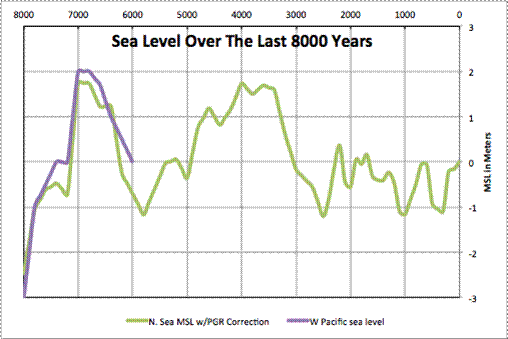
Figure 4 focuses on the last 8000 years.
By focusing on the last 8000 years, we can also see the sea level high stands at the Medieval Warm period, the Roman Warm Period, and the Egyptian/Minoan Warm Period as well as the Holocene Climate Optimum after all the great ice sheets melted. These latter two high stands are roughly two meters above the current sea level. The low stands are about one meter below current sea level.
When looking at these, keep in mind that there is a delay between temperature and sea level. That delay depends on the amount of temperature change and the level from which the temperature changed. In Figure 4, the delay seems to average at least 200 years.
In the last 8000 years, sea level has been substantially higher than at present, up to 2 meters or more higher in two periods four to seven thousand years ago. Sea level during the Holocene has been falling since that period.


After hearing some biologist piss and moan about how the current glacial retreat was exposing ancient forests that had been preserved all this time, it occurred to me that the 6000 year-old wood wasn’t as interesting as the fact that there were forests above the height that was now covered in ice.
So after seeing a couple articles talking about warm conditions then I wrote http://wermenh.com/climate/6000.html
That’s a great collection, Ric.
Ric Werme:
A great collection.
Is that Thomas F Stocker, co-author of the seventh paper listed, the same Thomas F Stocker who maintains for the IPCC that “The Science”** is settled?
** Including the claim that “it is warmer now that it has been for the last 10,000 years.
Graeme, it is the same. But his “out” is that it is only the summers that were warm. This effect is now decreasing as summer northern hemisphere insolation has now reached minimum. I don’t know how this squares with the Southern Hemisphere sea ice max converging with SH insolation reaching max. Other things are obviously at work.
Ed Caryl:
If you believe 3 impossible things before breakfast then you, too, can become a Lead Author for the IPCC. The whole “science” is riddled with contradictions.
By the way, didn’t Rhodes Fairbridge have a bit to say on your subject. Of course that was pre-PC’s so may be hard to find. That’s another thing with the “science” they never read up on the subject before weaving their fantasies.
Yes, he did. http://www.lavoisier.com.au/articles/greenhouse-science/solar-cycles/RichardMackeyForum2008.pdf
The curve above should be seen as a minimum.
Regarding post-glacial sea level rise:
“…Of course, the details are less certain than the overall trend, but there is considerable agreement that the most rapid phases were between about 8000 and 5000 BC, also that the rise of general water level was effectively over by about 2000 BC, when it may have stood a metre or two higher than today.”
‘Climate, History and the Modern World,’ second edition, H. H. Lamb, pages 115-116.
Ed, is “MSL” Mean Sea Level”?
Pardon my ignorance but I am not a Boffin…
Yes.
Once again by Mahatma Gandhi: “First they ignore you, then they laugh at you, then they fight you, then you win.”
I think we are on the third step, next we will win!
Ric Werme
There is a lot reports at the U of C Arctic Institute web site. You can search them though the ASTIS database link.
http://pubs.aina.ucalgary.ca/
Here is one on trees at 78 degrees N:
Petrified and mummified remains of fossil forests are preserved within Tertiary sediments in the Canadian High Arctic and represent some of the most northerly fossil rests ever recorded.
The remains of fossil trees present a paradoxical contrast to the treeless arctic landscape of today, where low temperatures prohibit the growth of anything but small bushes. The middle Eocene climate was obviously much warmer than today to allow such large trees to grow.
The well-defined and wide growth rings in the stumps indicate that the trees grew rapidly in a favorable forest environment and that the climate was markedly seasonal and warm, at least during the growing season, and the rainfall ample for fast growth.
http://pubs.aina.ucalgary.ca/arctic/arctic41-4-314.pdf
Hmmm…you might want to look at the citation you used arising from the link to Het Normaal Amsterdams Peil (NAP) – Achtergronden en geschiedenis. The author’s name is “Kwaad” (Frans J.P.M. Kwaad). Because you had Google translate turned on, it’s translated his name into English, which has an unfortunate effect, to say the least (maybe this is where Dr. Evil ended up when the Austin Powers movie series finished…)
Cheers.
Ooops – thanks. Fixed
My bad. I should have been suspicious.
The figure 1 caption also has the error, PG.