Some scientists devote their lives painstakingly assembling fragments of evidence to piece together a picture of the past. They deserve tremendous credit. Unfortunately today we appear to have inept or sleazy scientists who take collected data and destroy it – thus permanently blinding our view of the past. These people deserve to be loathed.
Ed Caryl presents an essay of such an example.
==============================
What Is The Temperature Trend At Barrow Alaska?
By Ed Caryl
If you ask this question of Wolfram-Alpha, the online Guru that Siri depends on for answers, you get this plot.
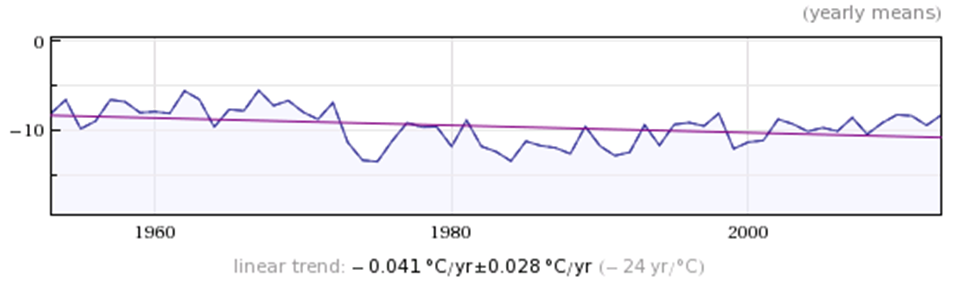
Figure 1 from Wolfram-Alpha.
If you look at all the available temperature data bases for Barrow, you get multiple answers, none that agree, and none agree with Wolfram-Alpha, or even come close.
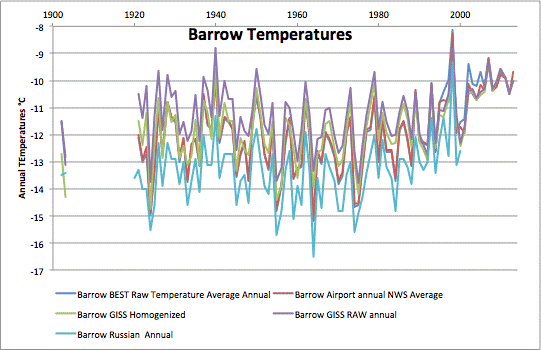
Figure 2 is a plot of Barrow temperatures from five different sources. The BEST data nearly coincides with the Barrow Airport NWS Average (the blue line us under the red line) until the last decade. The Russian data ends at 2000.
During the search for this data, I came to the conclusion that RAW data simply does not exist for any stations except for the filled-out sheets from COOP stations or the electronic reports from the automated stations. All the on-line data, whether from BEST, NOAA, USHCN, GHCN, GISS, or wherever, has been manipulated in some way. USHCN, NOAA and GHCN seem to be the prime manipulators, filling in missing records with estimates, inventing data for “zombie”stations that won’t die, and “homogenizing”data to supposedly correct for UHI. GISS then takes the GHCN data and adds their own special sauce where they think it is necessary.
Of the 19 stations examined in my previous article, only Barrow received the “special sauce”. For all the others GISS simply passed along the GHCN data with no changes. All the changes in the last three years and nine months in those GISS files were GHCN changes. But Barrow is special. Here is what GISS did to Barrow
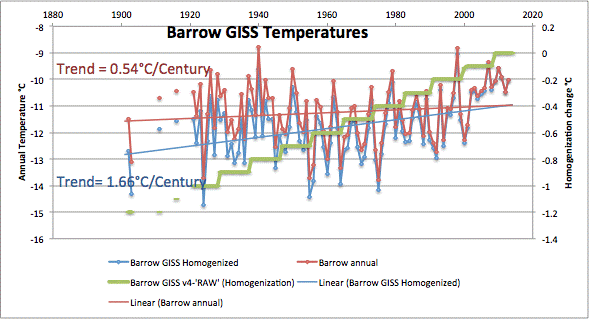
Figure 3 illustrates the GISS “homogenization” change to Barrow temperatures (the green stair-steps), adding more than one degree per century to the warming trend by cooling the past.
Without the change illustrated in figure 3, 1940 would be the warmest year by 0.04°C. This change obviously has nothing to do with Urban Heat Island, it is in the wrong direction. Changes like this give a whole new meaning to the term “hutzpah”.
So from where did Wolfram-Alpha get their data? I have no idea. The source they cite has no connection to climate. It’s appearance suggests it was made up from whole cloth.
So who do we trust with the temperature records? We certainly cannot trust GHCN and GISS, nor any of the other agencies because they get their data from GHCN. GISS simply further corrupts that data. They are also continuously changing the data on a monthly basis, not just the previous month, but months in the distant past. For an excellent review of the “dancing data” see this recent article, and the associated comments.
Who can we trust? No one.


My wife says that green stairway is to their next grant.
The raw data exists, but it is not raw data as we know it.
I have Wolfram Alpha also, and wonder where their source is. Perhaps you should simply ask.
“Of the 19 stations examined in my previous article, only Barrow received the “special sauce”.”
The farther up in the North, the more important it becomes for the warmists to fabricate a warming trend because their theory predicts arctic amplification.
Guess they’ve given up on Antarctica though.
I finally drilled deep enough into Wolfram-Alpha and found this page:
http://reference.wolfram.com/language/note/WeatherDataSourceInformation.html
It basically says they get the data from all the usual suspects, then apply their own “secret sauce”.
Wolfram is probably not interested in all that homogenization business. I assume their “human and algorithmic processing” addresses data consistency and plausibility checks.
Phil Jones lost all the raw temperature data in the world, so to speak, but kept the “value added” stuff. Lucky us.
A very British habit. Note how the Civil Service misplaced more than a hundred files to do with Westminster sex offences.
http://www.telegraph.co.uk/news/politics/10949117/Whitehall-child-sex-inquiry-the-114-files-lost.html
Monkey see monkey do…
Just lock up all of the BBC and it should get better.
Unbelievable, f…ing unbelievable. Conspiracy? Common goal?
Here’s an image I posted on travel forum with regards to global warming affecting spring skiing at Whistler.
http://i22.photobucket.com/albums/b331/kevster1346/wolframalpha-20120118164548020.jpg
Sources link includes link to request for details on sources.
http://www.wolframalpha.com/input/sources.jsp?sources=WeatherData&Source=WeatherForecastData
The above Whistler image is from Jan 2012.
[…] No Tricks Zone notes destruction of climate data […]
How about a statistical analysis of land surface temperatures where each site is treated as a distinct microclimate? I have always been uncomfortable with the adjusting, anomalizing and homogenizing of land surface temperature readings in order to get global mean temperatures and trends.
Years ago I came upon Richard Wakefield’s work on Canadian stations in which he analyzed the trend longitudinally in each station, and then compared the trends. This approach respects the reality of distinct microclimates and reveals any more global patterns based upon similarities in the individual trends. It is actually the differences between microclimates that inform, so IMO averaging and homogenizing is the wrong way to go.
In Richard’s study he found that in most locations over the last 100 years, extreme Tmaxs (>+30C) were less frequent and extreme Tmins <-20C) were less frequent. Monthly Tmax was in a mild lower trend, while Tmin was strongly trending higher , resulting in a warming monthly average in most locations. Also, Winters were milder, Springs earlier and Autumns later. His conclusion: What's not to like?
Now I have found that in July 2011, Lubos Motl did a similar analysis of HADCRUT3. He worked with the raw data from 5000+ stations with an average history of 77 years. He calculated for each station the trend for each month of the year over the station lifetime. The results are revealing. The average station had a warming trend of +0.75C/century +/- 2.35C/century. That value is similar to other GMT calculations, but the variability shows how much homogenization there has been. In fact 30% of the 5000+ locations experienced cooling trends.
Conclusions:
"If the rate of the warming in the coming 77 years or so were analogous to the previous 77 years, a given place XY would still have a 30% probability that it will cool down – judging by the linear regression – in those future 77 years! However, it's also conceivable that the noise is so substantial and the sensitivity is so low that once the weather stations add 100 years to their record, 70% of them will actually show a cooling trend.
Isn't it remarkable? There is nothing "global" about the warming we have seen in the recent century or so.The warming vs cooling depends on the place (as well as the month, as I mentioned) and the warming places only have a 2-to-1 majority while the cooling places are a sizable minority.
Of course, if you calculate the change of the global mean temperature, you get a positive sign – you had to get one of the signs because the exact zero result is infinitely unlikely. But the actual change of the global mean temperature in the last 77 years (in average) is so tiny that the place-dependent noise still safely beats the "global warming trend", yielding an ambiguous sign of the temperature trend that depends on the place."
http://motls.blogspot.ca/2011/07/hadcrut3-30-of-stations-recorded.html
Usable temperature records start in 1978. Before that they are lost in the mists of time, obscured, unsuited for any purpose. Let’s hope the USCRN network doesn’t suffer the same horrible fate.