+++++
Polar Islands Of Heat
By Ed Caryl
I would like to thank “John”, a commenter on my article on why the Antarctic sea ice is expanding, for inspiring this article. Other writers and researchers have noticed that temperature measurements in the polar regions are influenced by nearby heat sources, even the body heat of the person doing the measurement.
In 1907, William John Gordon wrote Round About The North Pole, describing the various expeditions that had taken place up until that time. One expedition described was that of Umberto Cagni’s expedition in 1900. (H/t Bill Strouss in a comment on WUWT here.)
Here is an excerpt from that book, the bottom of page 77 and the top of page 78.
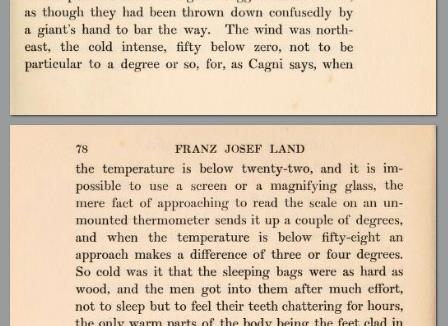
Figure 1 is an excerpt from William John Gordon’s Round About The North Pole, written in 1907. Note the increasing impact on temperature measurements with the approach of the human body with decreasing temperature.
Every object that is warmer than the surroundings emits infrared that heats cooler objects in the vicinity. The more objects there are that are warm, and the closer they are, the greater the heating. This applies also to thermometers. Are weather stations in the polar regions subject to temperature errors due to nearby heated structures? This notion has been studied for only a few locations. The village of Barrow on the Arctic Ocean coast in Alaska has been studied. The heat island there can reach as much as five or six degrees C in winter when the temperature is between -30°C and -40°C and the wind is calm.
Studies like this require the installation of recording thermometers inside the study area and outside in nearby rural areas. Long-term studies are done using existing weather stations that are close by. One long term study was done using the records from Fairbanks, Alaska, and nearby Eielson Air Force Base. This study found a heat island exceeding 1°C in winter.
Comparison of 2 adjacent Antarctic weather stations
In the polar regions there are few weather station pairs suitable for heat island studies. In Antarctica, there is only one pair that can be used, Scott Base and McMurdo Station on Ross Island in the Ross Sea. These two stations are particularly useful, as they are very close together, less than 1.5 miles (2.3 kilometers) apart as the Skua flies (no crows in Antarctica), at the same altitude and latitude, separated by only a low ridge.
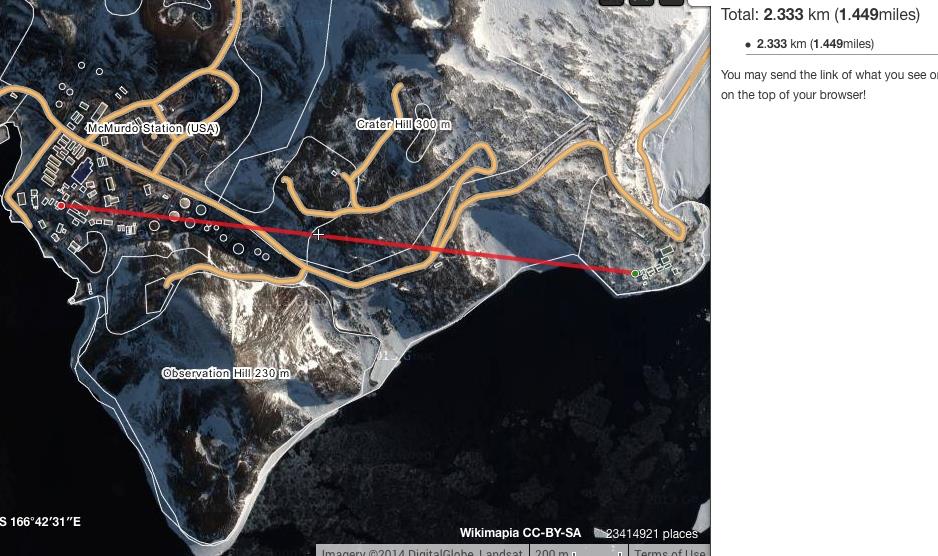
Figure 2 is from Wikimapia. McMurdo (left) and Scott Base (right) are at the southern tip of Ross Island. The red line is the distance between the temperature measuring instruments at the two bases.
If there is a heat island influence on temperature at McMurdo, there will be the following indicators:
- McMurdo will be warmer than Scott Base in all seasons.
- The annual temperature trend will be greater for McMurdo than for Scott Base.
Winter temperature differences will be greater than summer differences.
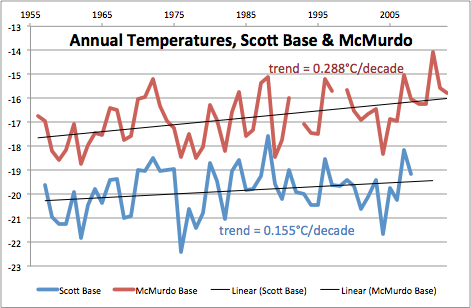
Figure 3 is a plot of the annual temperatures and trends for McMurdo and Scott Base.
At the beginning, after Scott Base was built in 1957, the temperature difference was about 2.5°C, with McMurdo the warmer. The trend for McMurdo is nearly twice that of Scott Base. In 2009, the last year where we have data from both stations, the difference was more than 3°C.
Both bases were built to support research in the International Geophysical Year, June 1957 to December 1958. McMurdo was always the larger base, built first to support logistics for the other Antarctic research stations in the area, as well as support for the South Pole station, Amundsen-Scott Station. Scott Base was built by New Zealand in 1957.
McMurdo was sized to support over a thousand people in the Austral Summer season and 150 to 200 people in the winter. Scott Base was sized to support 70 to 80 people in the summer and 10 to 15 people in the winter, 10% of the size of McMurdo.
McMurdo handles the logistics, fuel, sea-borne and airborne freight, personnel transport, and most of the electrical power for the two stations, though Scott Base does have its own generators in case the common electrical grid is disrupted. There is also a three-turbine wind farm with nearly 1 Megawatt peak output.
90% of the fuel used at both bases is AN8 aviation kerosene jet/diesel fuel. Most of the turbojet and prop jet aircraft, and all the diesel engines use AN8, including the icebreakers and the diesel generators, at both bases and the South Pole. AN8 is a special Arctic formulation with antifreeze added to reduce the gel point to -70°F (-57°C).
These stations use a LOT of fuel for heating and electrical power. McMurdo uses 19,000 liters per average day, about 12% more in winter and 30% less in summer. Scott Base uses 1300 liters per day in winter and 900 liters/day in summer. The fuel energy content for AN8 is about 10,000 watt-hours/liter. For both stations, this works out to about 55 watt-hours/square meter in winter and 37 watt-hours/square meter in summer.
But the area of warmer McMurdo is about 400 by 400 meters, or 160,000 square meters, and Scott Base is much smaller at about 50 by 200 meters, or 10,000 square meters, though much more irregular. Here is what the bases look like in winter (now).
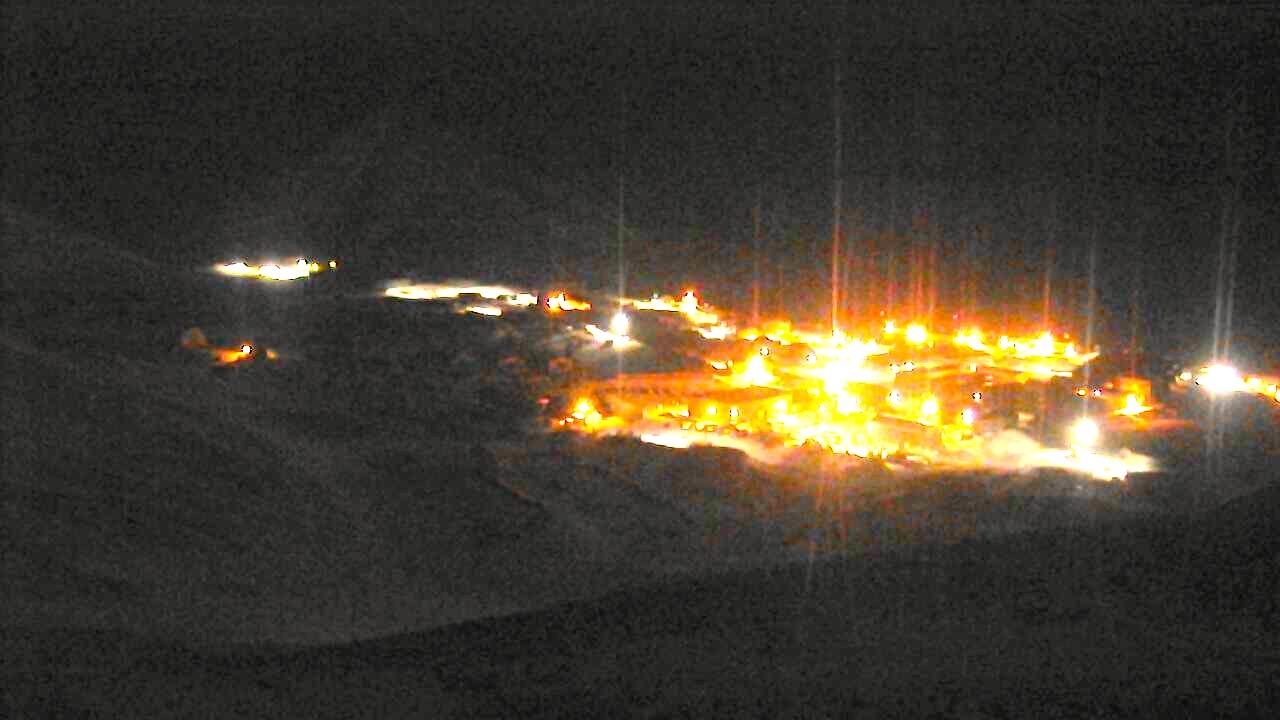
Figure 4 is the McMurdo webcam image from Arrival Heights about 2 AM local time on August 13, 2014. Moonlight is just making the unlighted terrain faintly visible. Observation Hill is left of center beyond the base.
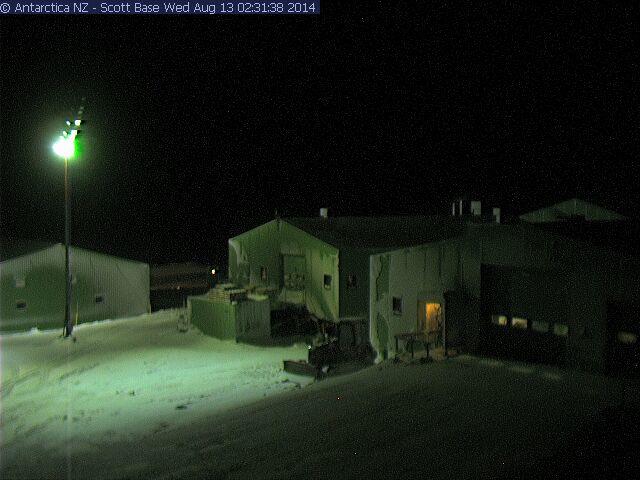
Figure 5 is of the “hitching rail” area (outlets for engine heaters) at the entrance of Scott Base, lighted by their one streetlight. This webcam view was taken at the same time as Figure 4.
Below in Figure 6 are the temperature differences between the warmer McMurdo and the cooler Scott Base by season. December through February is summer, March through May and June through August is winter, and September through November is “WinFly”. WinFly is also winter, as it stands for Winter Fly-in, the season when the early crews arrive to begin preparations for the summer work season.

Figure 6 is the temperature difference between McMurdo and Scott Base by quarters. McMurdo is the warmer by 3.5°C in June, July, and August, 3°C in the rest of winter, and around 2°C in summer.
For all seasons, the trend is warming. The WinFly season is warming the most.
McMurdo is warmer in winter by 3 to 3.5°C because of the high-energy use to heat and power the base, and because that heat is over a larger area than Scott Base by a factor of 16. There is also another reason: the siting of the measuring instruments. This is Building 165, the location of “MacWeather”, the weather monitoring and forecasting office, as well as the communications and operations center for the McMurdo base.
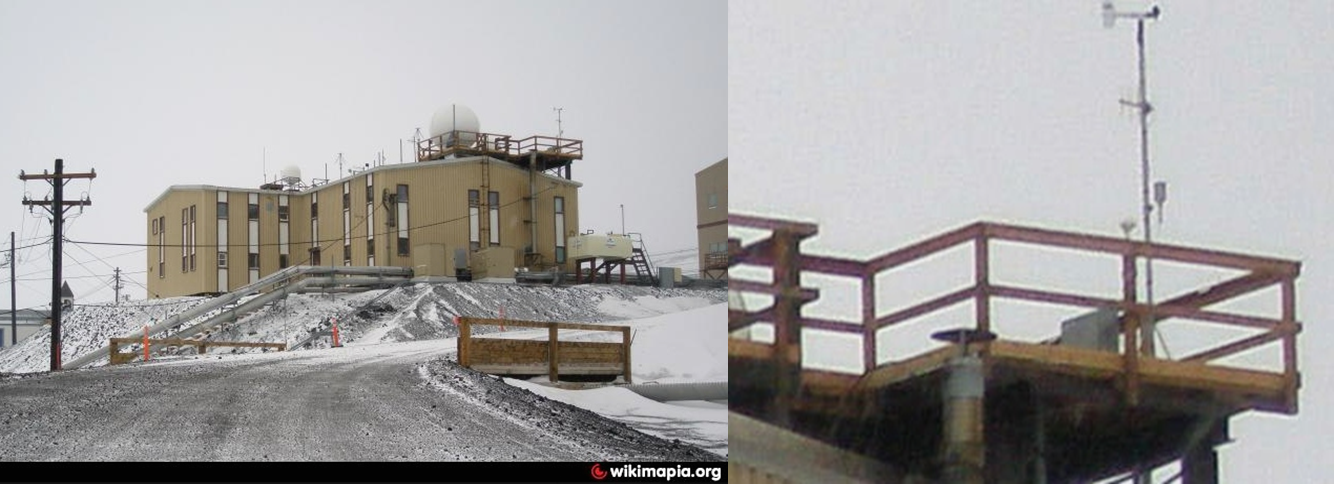
Figures 6a and 6b are Building 165 at McMurdo. Figure 6b is a close-up on the weather instruments. Note the stovepipe very close by.
Building 165 is near the center of the base, next door to the Crary Science Center.
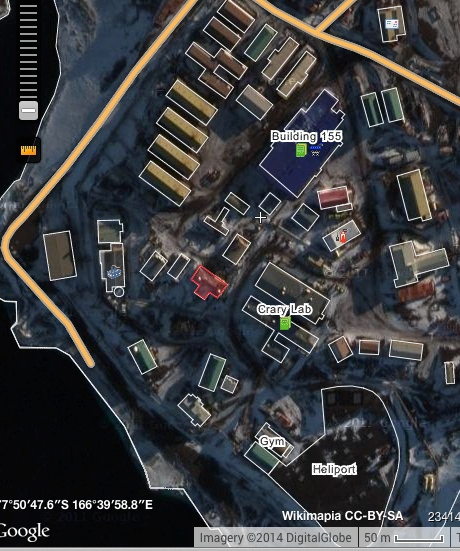
Figure 7 is a labeled satellite view from Wikimapia of the center of McMurdo Station. The building outlined in red is building 165, the location of MacWeather. The weather instruments are on the roof at the right-hand corner of the building, closest to Crary Lab. In Figure 6a, you can see the corner of the Phase 2 (middle) section of the lab building.
In contrast to this very “urban” setting, the weather station and the weather instruments at Scott Base are much better sited.
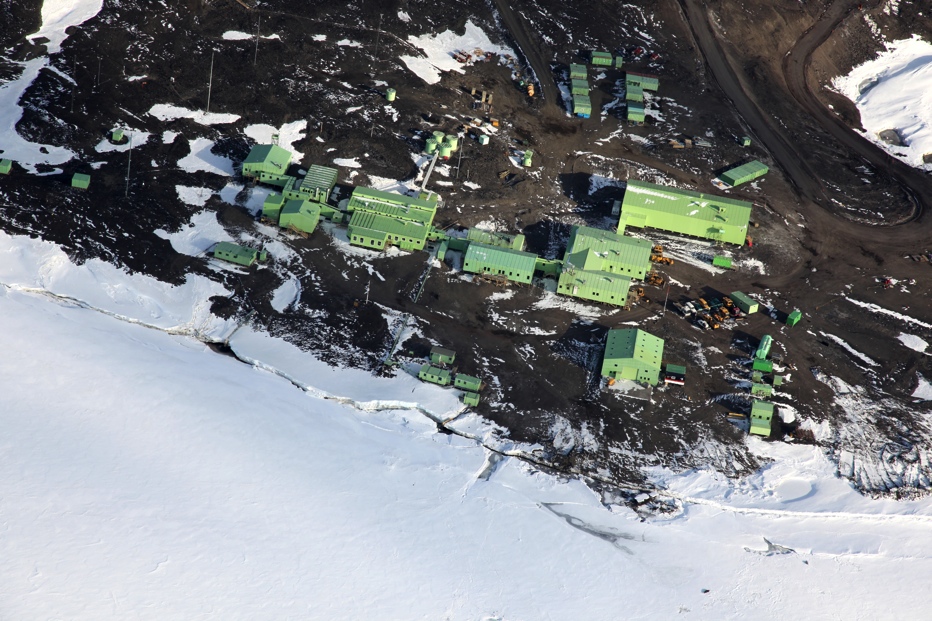
Figure 8: Scott Base from the air. Photo Credit: Joe Harrigan/Antarctic Photo Library.
Figure 8 above is an overview of Scott Base. Most of the heat sources, the powerhouse, garage, dormitories, mess building, and the “ablutions” building, are on the right. The building on the left end of the complex is Hatherton Lab. Outside of this building, slightly up-slope and almost 100 meters away, is a Stevenson Screen – see detail below.
Figures 9 and 10 document the position of the Stevenson Screen at Scott Base:
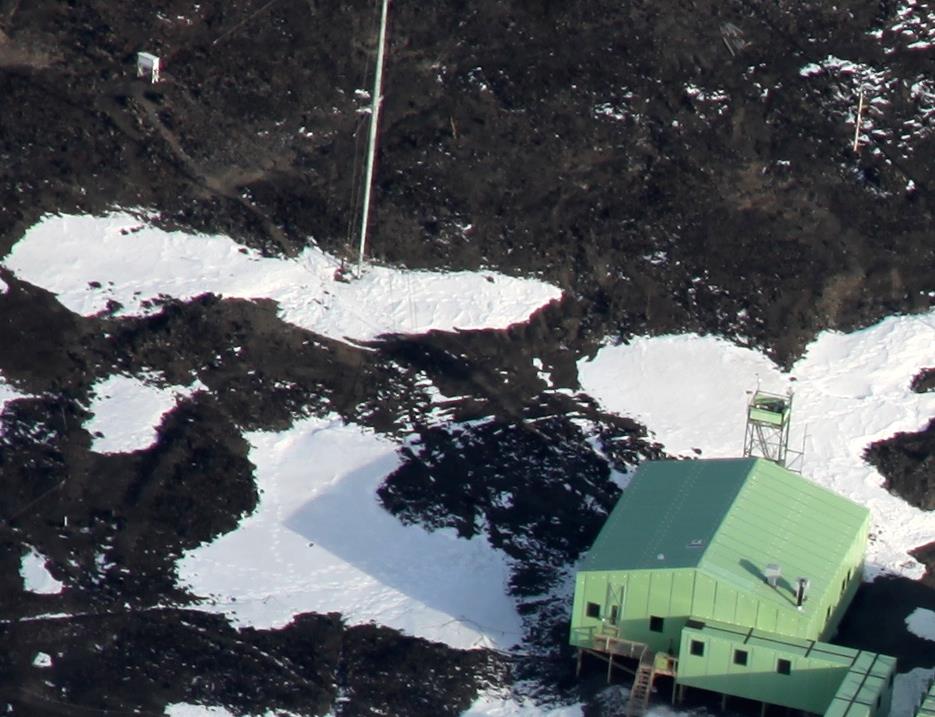
Figure 9: The path to the Stevenson Screen (upper left corner). In order to safely reach it, and return to Hatherton Lab in winter white-out conditions, there is a guide rope strung alongside the path. Photo Credit: Joe Harrigan/Antarctic Photo Library.
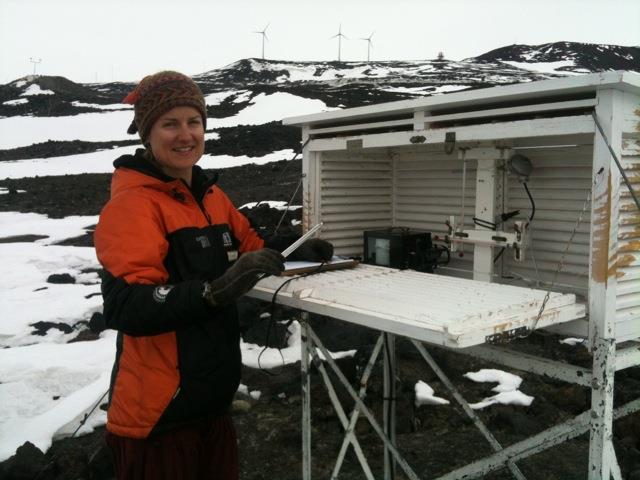
Figure 10: Nita Smith is the lady in the photo. Three wind turbines are visible in the background on the ridge above the base. The picture was taken in early December 2011. Photo credit: Rebecca Priestly here.
The last monthly record in the GISS station data is June 2009. Ms. Smith would be deeply disappointed that her efforts were in vain. GISS is taking only the McMurdo data now and ignoring Scott Base. Why are we not surprised?
There is definitely a heat island at McMurdo Station. As we discussed at the top of this article:
- McMurdo is warmer than Scott Base in all seasons by 2°C in summer to nearly 4°C in winter.
- The annual temperature trend is greater for McMurdo than for Scott Base by 86%.
- Winter temperature differences are greater than summer differences by 1 to 1.5°C.


Great one, Ed. Goes to show sound, accurate temperature readings are not something that just fall from the heavens.
a thermometer mesures its own temperature…the rest is assumptions.
You should check the difference in temperature at stations on Kind George Island. There are nearly a dozen countries that have research stations on it, most of them you can see the other station.
http://en.wikipedia.org/wiki/King_George_Island_(South_Shetland_Islands)
I compared Bellingshausen and Great Wall. They are within 5 km. Nothing very interesting in the comparison. The common records are only since 1985 and the differences are mostly less than 0.5°C until the last couple of years.
great piece of work . i am sure anthony watts would love this as a guest post.
Thanks Ed for this very interesting article, with your very clear explanation.
The weather station at McMurdo is a real eye opener, surely had they been trying they couldn’t have found a more compromised location? It’s one thing to seek convenience but this ridiculous.
As you mention, any wonder GISS would choose to take data from McMurdo rather than Scott, although no doubt they have some weasel rationalisation for that decision.
What matters is the TREND in temperatures over time (NOT the temperature itself).
They need to pick a technique (preferably one which influences the reading as little as possible) and stick with it — just like picking a site and sticking with it. If UHI effects become a matter of concern, move to an alternate site (only after obtaining parallel readings for a significant period of time).
Thank you for the post – emphasises the importance of Quality Control in assessing temperatures, particularly in extremely cold environments.
Quality control – another reason to focus on tropical & temperate zone averages when attempting to arrive at an accurate figure for “global mean atmospheric surface temperature.” It’s not like we weren’t aware of the volatility / noise issue.
Kurt in Switzerland
Kurt in Switzerland
15. August 2014 at 09:51 | Permalink | Reply
“What matters is the TREND in temperatures over time (NOT the temperature itself).”
I disagree. This argument has been used by the warmists to stay silent about the absolute temperature of the planet. Yet the absolute temperature is what would be catastrophic about catastrophic Global Warming. So let’s look for a moment at the instances where Global Warmists actually DID report the temperature of the planet.
NOV 2013, a fairly new data point:
http://www.ncdc.noaa.gov/sotc/global/2013/11/
“Global Highlights
The combined average temperature over global land and ocean surfaces for November 2013 was record highest for the 134-year period of record, at 0.78°C (1.40°F) above the 20th century average of 12.9°C (55.2°F).”
So we were at 12.9+0.78 = 13.68 deg C in NOV 2013.
13.68 deg C.
How does this contrast with older utterances from warmist luminaries?
1988: 15.4°C
Der Spiegel, based on data from NASA.
http://wissen.spiegel.de/wissen/image/show.html?did=13529172&aref=image036/2006/05/15/cq-sp198802801580159.pdf&thumb=false
1990: 15.5°C
James Hansen and 5 other leading scientists claimed the global mean surface temperature was 15.5°C. Also Prof. Christian Schönwiese claimed the same in his book “Klima im Wandel“, pages 73, 74 and 136. 15.5°C is also the figure given by a 1992 German government report, based on satellite data.
1999 14.6°C
Global and Hemispheric Temperature Anomalies – Land and Marine Instrumental Records Jones Parker Osborn and Briffa http://cdiac.ornl.gov/trends/temp/jonescru/jones.html
2004: 14.5°C
Professors Hans Schellnhuber and Stefan Rahmstorf in their book: “Der Klimawandel”, 1st edition, 2006, p 37, based on surface station data from the Hadley Center.
2007: 14.5°C
The IPCC WG1 AR4 (pg 6 of bmbf.de/pub/IPCC2007.pdf)
2010: 14.5°C
Professors Schellnhuber and Rahmstorf in their book: Der Klimawandel, 7th edition, 2012, pg 37 based on surface station data.
http://cdiac.ornl.gov/trends/temp/jonescru/jones.html
2012 14.0 °C
Press Release No. 943 World Meteorological Society Globally-averaged temperatures in 2011 were estimated to be 0.40° Centigrade above the 1961-1990 annual average of 14°C. http://www.wmo.int/pages/mediacentre/press_releases/pr_943_en.html
2013 Wikipedia: 14.0°C
Absolute temperatures for the Earth’s average surface temperature have been derived, with a best estimate of roughly 14 °C (57.2 °F).[11] However, the correct temperature could easily be anywhere between 13.3 and 14.4°C (56 and 58 °F) and uncertainty increases at smaller (non-global)
http://en.wikipedia.org/wiki/Instrumental_temperature_record
https://notrickszone.com/2013/04/21/coming-ice-age-according-to-leading-experts-global-mean-temperature-has-dropped-1c-since-1990/
We can conclude that throughout the history of Global Warming Alarmism, the Earth has consistently and progressively cooled.
This is paradoxical. Why have the “scientists” not noticed? I am sure some of them read NTZ and WUWT, where the bloggers, and I, have repeatedly shown these references. The warmist scientists must know this by now.
Maybe they are too busy with spending taxpayer money to care.
Well argued Ed. A clear case of man-made local warming.
We should remember that that are relatively few temperature stations in both Antarctica and the Arctic. So any bias in a station has a much greater impact than one in Western Europe.
Seems to be a bit of adjustment will help the cause as well.
This is McMurdo original (raw) temps from GISS (v1)
http://data.giss.nasa.gov/cgi-bin/gistemp/show_station.cgi?id=700896640008&dt=1&ds=1
Now here is the latest homogenised data (v4)
http://data.giss.nasa.gov/cgi-bin/gistemp/show_station.cgi?id=700896640008&dt=1&ds=14
Interestingly this version also appears on the latest v4 station list.
http://data.giss.nasa.gov/cgi-bin/gistemp/show_station.cgi?id=700896640000&dt=1&ds=14
The original McMurdo temps are similar to Scott base.
[…] “Urban Heat Island” Effect Appears To Be Far More Pronounced In Polar Regions Than You M… By P Gosselin on 14. August 2014 Just imagine where this would be spread if proving the UHI benefited the Warmist side of the debate.oving the UHI benefited the Warmist side of the debate. […]
Ed – “note the stovepipe”. What about the 2 site heating pipes at the base of the building. Convection up the building anyone?
The heated pipes, for heat, water, and waste, run all over the base. Also, there is a vehicle parking area directly beneath the weather mast on the far side of the building.