The North Pole region north of 80°N, monitored by the Danish Meteorological Institute (DMI) since 1958, has in 2014 seen yet another colder-than-normal summer, placing it in the Top 4 coldest since the DMI started monitoring in 1958. The chart below shows the four coldest summers: 2009, 2010, 2013 and 2014.
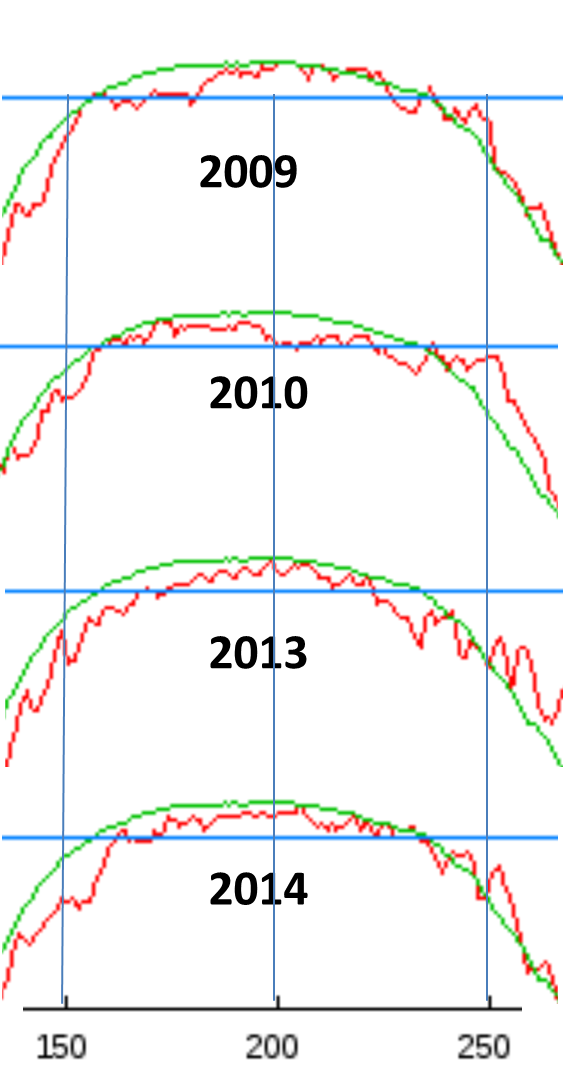
Temperature vs calendar day for the 4 coldest summers above 80°N latitude. Blue horizontal line is 0°C . Four of the last six Arctic summers have been the coldest on the DMI record. Graphics snipped from the dmi.dk.
Arctic summers can be examined going back to 1958 using data from the Danish Meteorological Institute here. The 4 coldest Arctic summers have all occurred in the last 6 years. Not even the summers of the 1960s were colder.
Ocean currents impact the Arctic
It’s obvious that ice melt involves a lot more than just surface atmospheric temperature, and claims it is due to greenhouse gases are misleading and naïve. Other major factors involved are ocean cycles and weather and wind conditions.
From 1980 to 2000, both the AMO and PDO saw warm phases, and so the Arctic ice melt of the late 2000s was likely a reaction to the warmth. The PDO has since flipped to its cooler phase and the AMO is starting its entry into its cool phase. Many experts are expecting an Arctic summertime sea ice recovery over the next 2 decades.
Even Arctic sea ice experts are now backing off their projections of continued sea ice decline over the next 20 years, see here.
Global sea ice normal 2 years
Not only the North Pole is cooling, but so is the South Pole, which has been smashing record highs for sea ice extent a second year in a row, see here. Global sea ice has been slightly above average for almost 2 years now, thus flying in the faces of alarmists who obstinately cling to the belief of a warming planet.
Hat-tip Nick Beal at Twitter.


Not had an Arctic death spirral story from the BBC this year. Over the past few years either Roger Harrabin or David Shukman have a story from there at this time of year.
http://www.independent.co.uk/environment/green-living/green-village-to-be-bulldozed-and-mined-for-lignite-in-germanys-quest-for-nonnuclear-fuel-9760091.html
lol
Seems that Tom Bawdon doesn’t agree with the data
http://www.independent.co.uk/environment/climate-change/uk-to-face-more-extreme-weather-as-climate-change-pushes-temperatures-up-in-the-arctic-9747504.html
“Ocean currents impact the Arctic” is a matter that could have been much better understood if the extraordinary winter temperature jump in the Arctic since winter 1918/19, which subsequently heated the Northern Hemisphere until winter 1939/40 had been explained since long. One reason could have been the extraordinary sea ice extend in the North Atlantic in summer 1917, the only case since 1900; more at: http://www.arctic-heats-up.com/
The Sunday Times has a scare story about arctic ice. They show a graphic of ice thickness in 1976 and claim the average thickness was 16.4 feet where now it is only 2.6 feet.
http://www.thesundaytimes.co.uk/sto/news/uk_news/article1461908.ece
From NSIDC’s own data, sea ice reaches thermodynamic equilibrium in the arctic at approximately 3 meters (9 feet).
“Remember that ice grows because of a transfer of heat from the relatively warm ocean to the cold air above. Also remember that ice insulates the ocean from the atmosphere and inhibits this heat transfer. The amount of insulation depends on the thickness of the ice; thicker ice allows less heat transfer. If the ice becomes thick enough that no heat from the ocean can be conducted through the ice, then ice stops growing. This is called the thermodynamic equilibrium thickness. It may take several years of growth and melt for ice to reach the equilibrium thickness. In the Arctic, the thermodynamic equilibrium thickness of sea ice is approximately 3 meters (9 feet). However, dynamics can yield sea ice thicknesses of 10 meters (30 feet) or more.”
http://nsidc.org/cryosphere/seaice/processes/growth_melt_cycle.html
Environmental brainwashing of Germans too successful for their own good.
http://online.wsj.com/articles/theres-too-much-water-in-germany-but-that-wont-stop-people-from-sharing-bath-water-1411957801?google_editors_picks=true
Have you seen this – criticism of Cook’s 97% in Spiegal
http://www.spiegel.de/wissenschaft/natur/klimawandel-97-prozent-konsens-bei-klimaforschern-in-der-kritik-a-992213.html
You’re late to the party. 😉
https://notrickszone.com/2014/09/23/spiegel-writes-cooks-97-consensus-claims-are-deceiving-the-public-a-failed-call-to-action/
oops – my excuse I was at Mann’s lecture that day
I’m not sure if that excuse s good enough Barry – Not sure at all.
If you wonder why Gosselin only cut out day 150-250 in the temperature graphs of 2009, 2010, 2013 and 2014, follow the link to the DMI and click on the corresponding years. Seeing the temperature graph for the complete years will reveal a somewhat different picture than “NoTricksZone”(what an ironic choice of words) wants you to see.
http://ocean.dmi.dk/arctic/meant80n.uk.php
The story is about Arctic summers and not years. In fact summer is 91 days long, and I see that my charts show a period that is actually longer.
Of course the story is only about summers, since winter temperatures show a reality that is not in line with the picture that NoTricksZone wants to present to the reader. Anyone taking a look at year round Arctic temperatures will notice that the last years show far above normal year averages, with extremely warm winters and just below average temperature summers. However you focus their attention entirely on that last bit, conveying the message that the north pole is cooler than normal, while in fact it is warmer than normal.
Ice doesn’t melt in winter.
1938- 2001 saw a 0.07 degrees per decade decline in temps in the Arctic.
http://earthobservatory.nasa.gov/Features/ArcticIce/arctic_ice3.php