It Is Even Worse Than I Thought!
By Ed Caryl
First, I must apologize for an error. In How Much Global Warming, I made an assumption about the old GISS file from 1999 that it was a global temperature file. I had missed the clear label on the file itself that it was surface stations only. As Bob Tisdale pointed out, I was comparing apples to oranges.
But when I found the correct land-only file to compare, I found the situation was even worse than I thought. Here is the correct comparison.
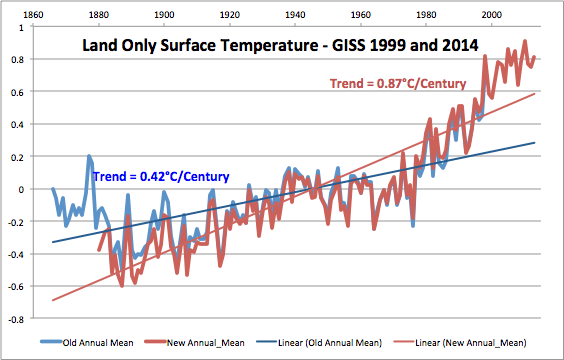
Figure 1 is the comparison of land-only (surface stations) data from 1999 and the current data.
GISS has more than doubled the warming trend in their published data in the last 15 years. This has been done by ignoring the years before 1880, cooling the readings before 1965, and warming the measurements after 1965. They basically shifted the measurement period 14 years to the right, doubling the warming trend. Here is the difference plot:
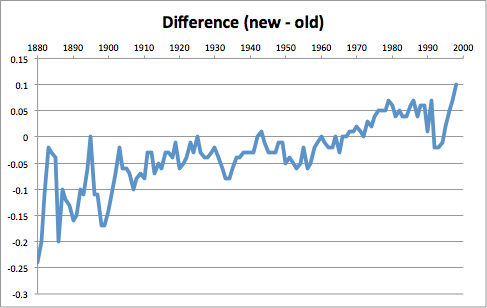
Figure 2 is a plot of the difference between the plotted data in Figure 1.
It doesn’t take much data manipulation to radically change the temperature trend. Truncating the early 14 years and adding the recent 14 years was half the change, and “adjusting” the station records slightly furnished the rest.
Surface station data is subject to many error sources. First, when thermometers are read by eye, the readings are in whole degrees, and a judgment is made on the spot on whether the reading is the lower or the higher number. The condition of the weather shelter and the thermometer is a factor. Then when the reading is recorded mistakes can be made.
More mistakes can be made when that recording is transcribed at the central office. Then higher authorities get involved with adjustments for missing records and UHI. For all these reasons, trends of less than one degree per century should be taken with a whole shovel-full of salt.
My thanks to Bob Tisdale. His expertise and experience in analyzing ocean temperatures and GISS records allowed him to instantly recognize the data I used. This is an example of open peer review in the climate blogosphere.


It looks like Gavin has some explaining to do over there at NASA. As this trick is being repeated over and over
Monthly, literally. Each month they recalculate all the “homogenization” and “correct” all the data. All the corrections for heat island? For half of them they cool the past. It’s a mess.
There won’t be any explanation, just plaintive cries. They’ve reached the point of self delusion.
“This has been done by ignoring the years before 1880”
Neat! A NASA institute that employs scientists with the sole task of finding the right mathematical tool to increase the trend! Payoff: 1.2 billion USD a year for NASA for “monitoring” the climate.
I wish I had a business scheme like that running.
Steve Goddard has lots of posts on exactly the same thing, plus some other interesting “tricks” that thye use.
[…] https://notrickszone.com/2014/10/15/giss-targeted-data-truncation-and-tricks-alone-produce-half-of-th… […]