The Younger Dryas – What Happened?
By Ed Caryl
This article looks at a paper by Steinthorsdottir et al.
Was there a time in the last few thousand years when CO2 was as high or higher than today? Yes, there was, at the end of the last ice age during the Younger Dryas (YD) cold period.
What was the temperature during that time? It was much colder than now, as much as 12°C in Greenland.
Did the temperature go up when the CO2 level went up? No, it went down.
About 13,000 years ago, at the end of the last ice age, after two thousand years of warming, melting ice, and rising sea levels, there was an abrupt reversal; a cold period that lasted over a thousand years. The Younger Dryas is named for an alpine flower, Dryas Octopetala, the pollen of which is found in northern tundra areas during this time.
It is thought that the Younger Dryas (YD) was caused by the collapse of the northern ice sheets, changing the North Atlantic Overturning Currents. One theory is that the ice sheet collapse was triggered by a comet or meteor strike. The evidence is a layer of nano-diamonds (ND) that are found in North America and Europe at about the beginning of the YD. In that layer there are soot deposits and platinum group metals indicating an extraterrestrial source that caused large forest fires.
A recent paper, Stomatal proxy record of CO2 concentrations from the last termination suggests an important role for CO2 at climate change transitions, covers the YD period, and as the title suggests, claims a role for CO2 in the temperature changes of this period. The southern Sweden Dwarf Birch stomatal proxy record has a higher time resolution than the ice core CO2 records of this period, showing a higher variability with a resolution of around 100 years.
What follows is a plot of that period with their stomata data with two assumptions of the baseline Holocene CO2 value, the Greenland ice core temperature record, and a marker for the ND event.
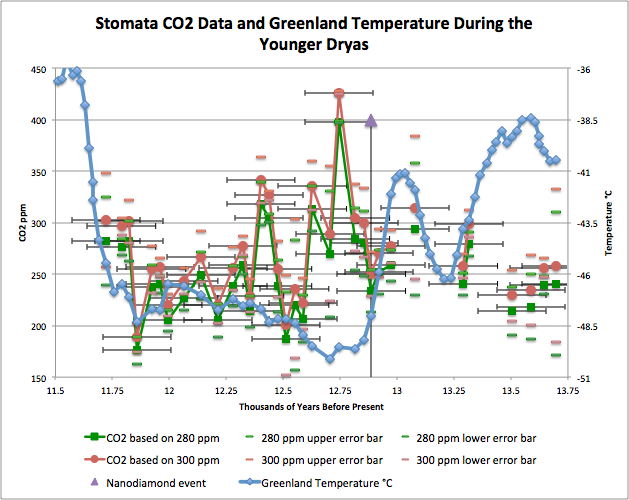
(GISP2), with the nano-diamond event marked. Time is passing right to left. The orange points assume a 280 ppm Holocene baseline, and the red points assume a 300 ppm Holocene baseline. The red and orange dashes are the standard error bars for the corresponding measured points.The horizontal error bars indicate a ± 150 year uncertainty in the C14 dating for the stomata based on C14 error in Figure 2 here. The purple diamond and vertical line is the nano-diamond event at 12,877 ± 3.4 calendar years Before Present (BP) based on ice core annual layer data from Greenland.
It should be noted that the Greenland ice core dating is very accurate, as the annual layers have been counted. So the temperature dating and the nano-diamond layer in the ice are known to less than ± 5 years accuracy. Figure 1 indicates that the YD cooling began 100 years before the ND event. This paper claims a C14 age error of ± 55 to 60 years, but other calibration sources are far wider. An error of 150 years puts the CO2 spike within the era of the ND source. The CO2 spike is likely the result of large fires resulting from the comet or meteor strike.
The timeline runs like this, from the oldest event on the right, to the newest on the left:
14200 BP is the approximate time of meltwater pulse 1a, at about the time of the peak in the Bølling oscillation. (This date is not on this plot.) For sea level in this era see here.
13,600 Before Present (BP, from the year 2000), is a warm peak of the Bølling oscillation.
13,200 BP, is the coldest point of the Older Dryas cold period.
13,000 BP, is the warmest peak of the Allerød oscillation.
12,970 BP is the beginning of the YD cooling.
12,877 BP is the date of the Nano-Diamond event.
12,750 BP is the approximate date of the CO2 peak at about 400 ppm.
12,700 BP is the coldest point of the YD.
11,850 BP is the date of the lowest CO2 value at about 180 ppm and the approximate end of the YD. In the next 250 years, Greenland temperatures rose 12°C.
11,600 BP is the time of meltwater pulse 1b, at the peak temperature at the left on this plot.
Important points to be noted in this data:
1. The ND event did not trigger the ice sheet collapse. The ice sheet collapse happened 1300 years later. The dating of Meltwater Pulse 1b is 11,600 years BP, well after the ND event, and 1400 years after the beginning of the YD cooling.
2. The ND event DID trigger a massive increase in CO2, to 400 or 425 ppm, depending on the baseline used, that lasted for less than 40 years. Those values have standard errors of ± 1.2 ppm because the additional CO2 caused increased biomass, providing a larger sample.
2a. That increase in CO2 did not cause a warming period in the YD. It continued to cool after the ND event.
2b. That increase in CO2 lasted less than 40 years based on the time resolution of the stomata data. Thus large amounts of CO2 are not persistent in the atmosphere for a thousand years as some in climate science claim.
3. There is no evidence in this data that CO2 drives temperature. On this plot, CO2 and temperature tend to go in opposite directions more than in the same direction.
4. The paper does acknowledge that CO2 stimulates plant growth. Their paper states that organic matter in their core samples rose during the higher CO2 period from around 20% to a peak of 35%.
The Antarctic ice core CO2 data is very poor at resolving rapid CO2 changes. Here is the best resolution CO2 plot from Dome C in Antarctica. The large changes in the stomata data are not reflected in the ice core data. The average value is the same at about 240 ppm.
Figures 2a and 2b are the Dome C CO2 data. The red dot marks 12800 BP. Figure 2b is an enlargement of the YD time circled in 2a.
This paper made the usual assumptions that CO2 drives temperature, but they picked the Antarctic ice core temperature data that agrees with their assumptions instead of the much closer and more detailed Greenland ice core data that does not. They failed to investigate the large CO2 spike in their data that exceeds modern values in an era where humanity played little part in the world. Their assumptions forced them to miss the important facts that the stomata data revealed.


Thanks Ed: what bothers me is that papers like this pass peer review. Omitting parallel literature used to be cause for reworking or denial of publication by reviewers. It appears that current researchers pay little attention to the body of past work available.
“Nobody” looks at the data or methods again if the results are as expected/desired.
That’s normal for humans.
It’s not how science should be done, but with humans doing it, that’s the tendency of how it will be done, despite it being contrary to the scientific method.
I am sorry to disagree with you Bernd: Had Mankind always behave as you suggest, we would be still in archeo-Stone Age by now….
We have lost sense of realism and intellectual honesty (in the West yes, nevertheless others did’nt…).
Spiegel, Bojanovski: We don’t know jack about climate sensitivity because satellites cannot distinguish high from low clouds, say researchers.
http://www.spiegel.de/wissenschaft/natur/klima-erwaermung-und-wolken-bestimmen-klimasensitivitaet-a-997780.html
Which is quite amazing, because as we all know, satellites can determine the sea level to a fraction of a millimeter (/sarc).
Ed,
You are good.
Pierre,
Thank you for posting this.
So we had higher CO2 levels in the past and nothing untowards happened, why the panic now?