The following by German scientists Fritz Vahrenholt and Sebastian Lüning exposes yet another classic example why we cannot trust climate institutes.
=======================================
Caught red-handed: Geomar omits crucial 1960s Arctic sea ice melt phase in press release
By Fritz Vahrenholt and Sebastian Lüning
(Translated/edited by P Gosselin)
The most well-known historical Arctic region melting period took place 1000 years ago when the Vikings sailed through the Arctic Ocean, which had little sea ice. Eventually they colonized Greenland and Iceland. Today no one wants to hear it because it doesn’t fit with the climate catastrophe storyline.
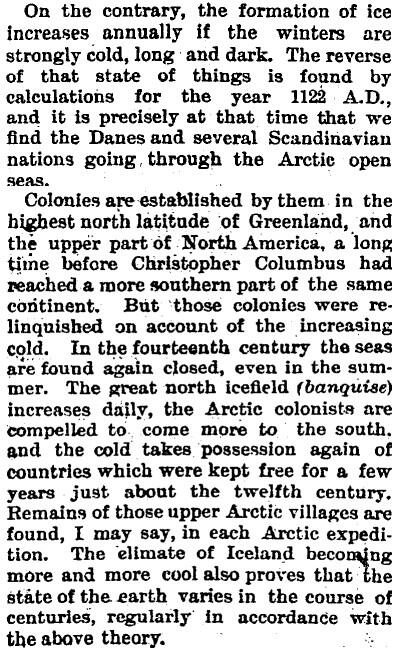
In 1887 the topic was less important. Back then the planet was emerging from the Little Ice Age and people were glad about the warming. Warm was good. There was no IPCC back then. For example in the New Zealand daily The Press on 8 November 1887 there was a story about the Viking journeys and a sharply reduced sea ice extent – something that would be unimaginable today (hat-tip Steve Goddard):

But one does not need to go back so far into history. Also between 1920 and 1940 there was a strong phase of melting in the north polar sea. Former Max-Planck director Lennart Bengtsson summarized the knowledge of the warm phase in the Journal of Climate in 2004. Already back then he saw a relationship with ocean cycles that influenced the climate with a 60-year period. What follows is the abstract of that paper:
The Early Twentieth-Century Warming in the Arctic—A Possible Mechanism
The huge warming of the Arctic that started in the early 1920s and lasted for almost two decades is one of the most spectacular climate events of the twentieth century. During the peak period 1930–40, the annually averaged temperature anomaly for the area 60°–90°N amounted to some 1.7°C. Whether this event is an example of an internal climate mode or is externally forced, such as by enhanced solar effects, is presently under debate. This study suggests that natural variability is a likely cause, with reduced sea ice cover being crucial for the warming. A robust sea ice–air temperature relationship was demonstrated by a set of four simulations with the atmospheric ECHAM model forced with observed SST and sea ice concentrations. An analysis of the spatial characteristics of the observed early twentieth-century surface air temperature anomaly revealed that it was associated with similar sea ice variations. Further investigation of the variability of Arctic surface temperature and sea ice cover was performed by analyzing data from a coupled ocean–atmosphere model. By analyzing climate anomalies in the model that are similar to those that occurred in the early twentieth century, it was found that the simulated temperature increase in the Arctic was related to enhanced wind-driven oceanic inflow into the Barents Sea with an associated sea ice retreat. The magnitude of the inflow is linked to the strength of westerlies into the Barents Sea. This study proposes a mechanism sustaining the enhanced westerly winds by a cyclonic atmospheric circulation in the Barents Sea region created by a strong surface heat flux over the ice-free areas. Observational data suggest a similar series of events during the early twentieth-century Arctic warming, including increasing westerly winds between Spitsbergen and Norway, reduced sea ice, and enhanced cyclonic circulation over the Barents Sea. At the same time, the North Atlantic Oscillation was weakening.”
Today in the press one hardly hears any mention of this melting phase. IPCC scientists would have us believe there has been only one single trend over the last 150 years, namely the steady death of Arctic sea ice.
In December 2013 in the journal PNAS a reconstruction of Arctic sea ice cover appeared for the past 650 years using algae as a proxy. The study was carried out by Jochen Halfar of the University of Toronto. Also involved in the study was Steffen Hetzinger of the Geomar Institute in Kiel, Germany. On November 19, 2013 a Geomar press release announced:
Since the end of the Little Ice Age around 1850, the archives of the red algae show a continuous decrease of the ice, a trend which continues through today. This decrease is stronger than anything we previously observed in the 650 year long history of the red algae record.“
The Austrian national daily Standard sounded the climate alarms, informing its readers:
For the first time a team of international scientists traced the development of sea ice in the Arctic all the way back to the Middle Ages. Here the scientists of the University of Groningen and others found out that the ice sheet has been melting continuously since the middle of the 19th century. They were helped by red algae which conserved the climate history of the last centuries. So far the data on the Arctic from satellites have gone back only to the late 1970s.”
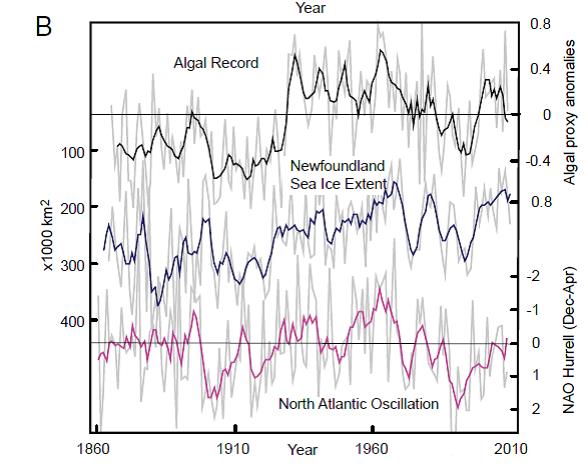
The use of the word “continuously” leads us to understand that the ice is melting steadily, without any larger phases of ice growth in between. Only a very few readers have taken the time and effort to read the original paper. In press releases, authors certainly only tell the truth and nothing but the truth, right? One look at the publication, however, delivers a bitter disappointment. Figure 2b of the study shows the development of the sea ice curve for Newfoundland for the past 150 years in detail (Figure 1). The result: In the 1960s, in the pre-satellite era, sea ice had shrunk to levels seen today. However in the press release, that inconvenient condition never got mentioned.

Figure 1: The blue curve depicts the development of sea ice near Newfoundland for the past 150 years. High peaks indicate shrinking, low peaks depict growth. Source: Halfar et al 2013.
In the paper itself the authors correctly attribute the development to the impact of Atlantic ocean cycles:
Modeling studies have shown that the NAO exerts an influence on the spatial distribution of winter sea ice via wind-driven anomalies of sea-ice velocity, surface vertical heat flux, and possibly horizontal oceanic heat flux (7). There is strong observational evidence connecting Arctic sea-ice distribution with the positive NAO trend from the 1960s to the early 1990s.”
Conscious deception of the public
In the GEOMAR press release there is also not a word about the cyclic nature of sea ice. This is a conscious deception of the public. The ice is neither “shrinking continuously” nor is CO2 playing the only role as some scientists would like us to believe.
Does Steffen Hetzinger know what he is doing? He is a young man who probably is in search of a permanent position and thus has to play along with the climate panic game. Did the GEOMAR force him to write such a press release or what it his own idea to score big points with climate alarmism? One thing is clear: this has nothing to do with reputable science. Hardly a good way to begin a career.
What would the sea ice discussion be like today if systematic satellite-based measurement had begun already in 1960?
IPCC, German government removed 1960s melt
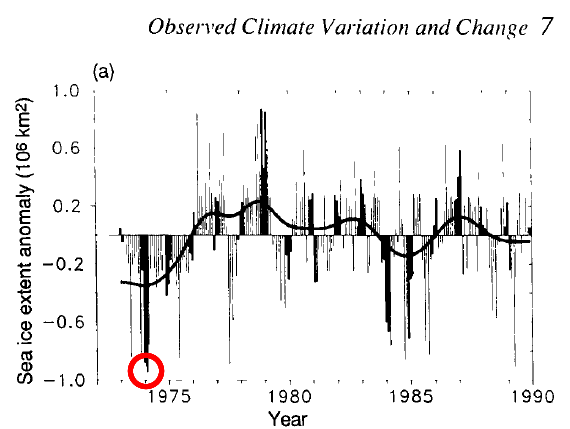
Measurements first began in 1979. The first IPCC report of 1990 was naively honest and openly revealed that shortly before satellite measurements began, there had been significantly less Arctic sea ice than there was during the measurement period beginning in 1979 (Figure 2). In the subsequent IPCC reports, they truncated the inconvenient start of the chart, thus taking it out of the readers’ view.

Figure 2: Development of Arctic sea ice from 1973-1990. Source: 1st IPCC Climate Report (1990).
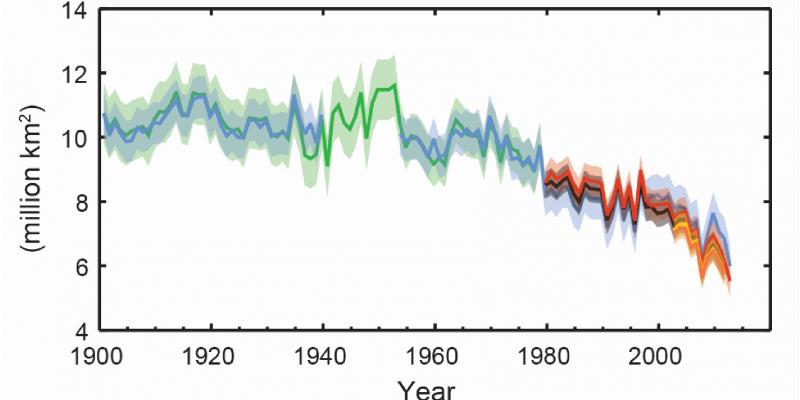
Looking at the melt phase of the 1960s and 1970s shown in the above chart, one really has to wonder that the German Ministry of Environment is using a dubious IPCC chart which fails to show the melting of the 1960s (Figure 3).

Figure 3: IPCC chart that the German Federal Ministry of Environment has at its website for illustrating Arctic sea ice development. Shown is the supposedly “observed mean Arctic summer sea ice (July-September)”. Original source: IPCC.
The discovery of old Nimbus satellite images must have been very awkward for the Federal Ministry of Environment. The images document huge holes in the Arctic sea ice. Spiegel Online reported on November 4, 2014:
‘Nimbus’: Nasa releases old satellite images
They were forgotten in NASA archives: Scientists discovered satellite images from the 1960s. A huge hole in the Arctic sea ice, large masses of snow, intact lakes – the images offer some surprises.”
Already on October 21, 2014, Mashable had reported on the unexpected gaping holes in the north polar sea ice:
The Nimbus data provides the earliest known view of Antarctica’s sea ice, which has made headlines recently for setting a record for the largest ice extent, and spotted large breaks in Arctic sea ice where none were thought to have occurred. The modern satellite record of sea ice in the Arctic and Antarctic starts in 1979, so the added data gives scientists a longer-term view that informs their understanding of present-day events. […] Sea ice extents in the Arctic were much larger in the 1960s than they are now, Gallaher said, which is consistent with the global warming-induced decline in Arctic sea ice. Still, even in years with higher volume’s of sea ice, the satellite spotted ice-free areas near the North Pole that were 200 to 300 miles across. “We found holes in ice at North Pole that we didn’t expect to find,” he said. “It’s a big hole,” said Garrett Campbell, who also works on the Nimbus project from the NSIDC.”


O/T: The following Spiegel article is yet another reason why public is losing faith in the institutions. http://www.spiegel.de/kultur/gesellschaft/rtl-bei-pegida-demo-stimmungsmache-fuer-ein-paar-zitate-a-1009755.html
Spiegel reports on how a “right wing protester” was in a reality a TV reporter who was only acting the part of a protester in order to produce some good right-wing, tea-party like quotes for the evening news shows….
This sort of dishonest manipulation is what we see in the climate media all the time. Suspicion of the German media by the nation’s citizens is rising rapidly. Hats off to Spiegel for exposing the Dresden Pegida media coverage scandal.
Well, I am a bit surprised that Spiegel – owned to 25% by Bertelsmann – exposes Reichstein, the RTL reporter who did the stunt – RTL is owned to 100% by Bertelsmann. Maybe the old collectivist editors at Spiegel, who own 50.5%, have pushed this through against the will of Bertelsmann.
(Bertelsmann is a tax exempt globalist foundation forming one of the four media blocs in Germany. They are promoters of open borders and an end of national states.)
Wait – it looks like Spiegel had no other choice – NDR (state broadcaster) published the false flag journalism, and then announced that they had been hoaxed. Junge Freiheit reported yesterday here:
http://jungefreiheit.de/kultur/medien/2014/ndr-interviewte-falschen-pegida-demonstranten/
Maybe Spiegel now had to write something as well to try to protect remaining credibility. I don’t know who was first – Spiegel has no date on their article.
Hi Pierre,
Thank you very much for your wonderful blog! Huge, natural variation is the general rule of the Arctic. Both animal and human populations flourish during warm, natural periods. This was common knowledge long time ago (see the references below). Please note that you (probably) cannot find these studies on the internet, you have to visit a library, i.e., a place full of books!
– Koch, L. 1945: The East Greenland Ice. – Meddelelser om Grønland, vol. 130, No. 3, pp. 1-374
– Vibe, Ch. 1967: Arctic Animals in Relation to Climatic Fluctuations. – Meddelelser om Grønland, vol. 170, No. 5, pp. 1-227
Best wishes from Finland & Merry Christmas! Antero Järvinen
Thanks!
Also wishing you a nice Christmas and hope you have snow for it. Here it looks like another bare ground Christmas.
Pierre, thanks for sharing figure 1.
A review of the new book “CLIMATE CHANGE THE FACTS 2014” by about 24 authors – available here.
The best and most relevant chapter in this new book is that by William Soon, namely Chapter 4 “Sun Shunned” in which he discusses things such as the eccentricity of the Sun’s orbit that I have also pointed out as the principal regulator of glacial periods.
The rest of the chapters on the “science” do not discuss the valid physics which is really what does determine Earth’s surface temperatures. Instead the “lukes” all reiterate the false claim that carbon dioxide causes significant warming of the surface by radiative forcing. Nowhere is the assumed process of forcing actually discussed. We just get the usual false paradigm that carbon dioxide traps outward radiation and thus supposedly makes the surface warmer.
Carbon dioxide does not trap thermal energy. It disposes of what it absorbs either by subsequent radiation or by sensible heat transfer (via molecular collisions) to other air molecules which outnumber it by 2,500 to 1. It also helps nitrogen and oxygen cool through such collisions, and may subsequently radiate the energy thus acquired out of the atmosphere.
All radiation between regions at different temperatures can only transfer thermal energy from the warmer region (or surface) to a cooler region. This means all heat transfer in the troposphere is generally upwards to cooler regions, with a proportion always getting through to space. There is no thermal energy transferred to a warmer surface. The energy transfer is the other way. The Sun’s radiation is not helped by radiation from the atmosphere which is only sending back some of its own energy now with much lower energy photons. Radiating gases reduce the insulating effect by helping energy to escape faster, and that is why moist air in double glazed windows also reduces the insulating effect, just as does water vapor in the troposphere.
Nowhere in the book do we see the surface temperature explained correctly using Stefan Boltzmann calculations. No one ever does this, because it is an absolute stumbling block for climatologists. The mean solar flux entering the surface is only about 163W/m^2 after 52% of the solar radiation has been either absorbed or reflected by the surface, clouds or atmosphere. But such a low level of radiation would only produce a very cold -41°C. That’s even colder than what the IPCC claims would be the case, namely -18°C without greenhouse gases. They deduce that by assuming that the whole troposphere would be isothermal due to convective heat transfer, including sensible heat transfers by molecular collision.
Hence all the “luke” authors fall for the trap of not actually explaining the existing surface temperature, let alone what carbon dioxide might or might not do. How could you work out the latter if you don’t know your starting point? The truth is that you cannot calculate the surface temperature of any planet that has a significant atmosphere by using radiation calculations. Hence all the considerations pertaining to radiation and absorption by carbon dioxide are totally within a wrong paradigm.
That assumption by the IPCC (and thus by the “lukes” who have written this book) that the troposphere would be isothermal was rubbished in the 19th century by some physicists who understood the process described in statements of the Second Law of Thermodynamics. It is still being rubbished to this day, and even more so, now that physicists realise that the Second Law is all about entropy increasing to the point where there are no unbalanced energy potentials. In a gravitational field this state of thermodynamic equilibrium is attained when all the energy potentials involving gravitational potential energy, kinetic energy and radiative energy balance out. That is when the environmental temperature gradient is attained, and the very fact that it exists enables us to explain all planetary surface temperatures (and the required energy flows) without the slightest reference to back radiation, let alone trace gases like carbon dioxide. Only water vapor has a significant effect in lowering that gradient because of its radiating properties. It thus cools the surface, and that puts a big spanner in the works for the IPCC et al.
Apples and oranges. The AR1 graphic is maximum (i.e. winter) sea ice extent, which is described in the text as “greater than 10%”, and the authors presumably thought summer extent wasn’t relevant, as they didn’t show it. The AR5 chart shows summer sea ice extent, which is defined as “greater than 15%”. The IPCC stopped showing the winter extent in reports, presumably when it was realised it didn’t give the “right message”. Even if they did show winter extent, direct comparison would be impossible because of the change from 10% to 15%. Some have said that change is “moving the goalposts”.