It has been clear for a long time to those who simply observe climate that temperatures are driven by, in the long term, orbital and Earth tilt cycles, the Milanković cycles, in the medium term by solar cycles with ocean cycles. like the Atlantic Multi-Decadal Oscillation (AMO), and in the short term, by ocean and atmosphere cycles like the El Niño Southern Oscillation (ENSO).
A few researchers have used this information to project the future. An example can be found on the sidebar of this blog. A problem with these projections is that factors such as volcanoes cannot be predicted. Due to the chaotic nature of most ocean cycles, these also cannot be used to predict the future. Only the AMO is regular enough to extend into the future, and then only for one or two cycles.
The sun is our source of energy, and it also has cycles. The 11-year sunspot number cycles (SSN) are regular but seem not to affect climate in any cyclic way. Only the integrated energy over whole cycles seems to push temperatures, and this affect seems to be delayed by about one whole sunspot cycle. Here is a history of the last 150 years and a simple projection to 2050.
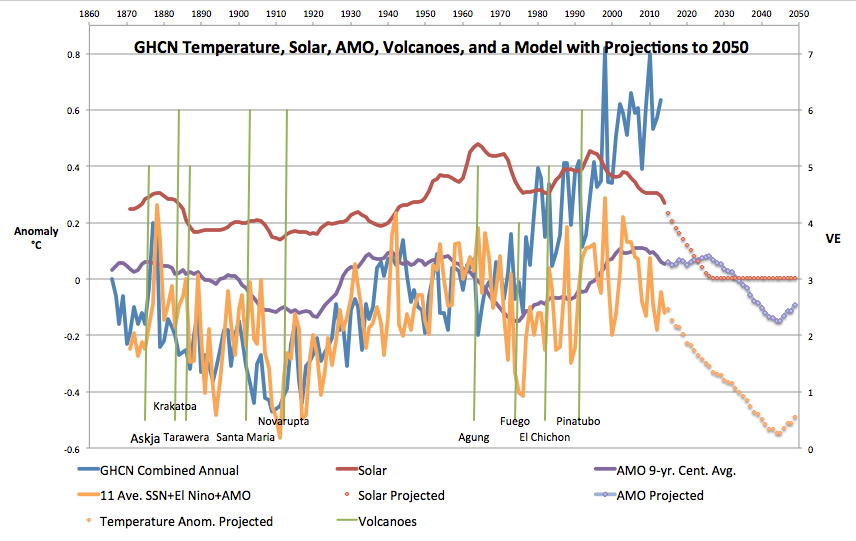
Figure 1 is a chart of the main influences on global temperature over the last 150 years. The red trace is based on the SSN processed with an 11-year trailing average. The purple AMO trace has been smoothed with a 9-year centered average. These were then combined with the annual average central Pacific El Niño 3.4 to produce the orange trace. The orange trace is a model of global temperature before volcanic cooling. The vertical green lines are named volcanic eruptions, the height of the lines is the volcanic eruption index (VE) using the right side scale. The blue trace is the global annual temperature average as published by GHCN.
For over a hundred years, the orange model follows the GHCN temperature closely except where perturbed by volcanic activity. Volcanoes can warm the atmosphere if they are primarily ash eruptions, or cool the atmosphere if they loft large amounts of sulfur dioxide into the stratosphere. The Askja eruption and caldera collapse in Iceland in 1875 produced primarily ash. That eruption plus a Grand El Niño the following year produced a warm year in 1876. The VE6 eruption of Krakatoa in 1883 and Tarawara three years later, produced five years of cool climate.
Santa Maria and Novarupta were two more VE6 eruptions, that along with a cool sun and a negative AMO sent temperatures plunging in the early 20th century. From 1918 until 1975, temperatures followed the ocean cycles and the sun very closely. Smoke and soot from WWII, along with a strong El Niño in 1942, may have caused the warming from 1939 to 1945. In contrast, a strong La Niña in 1975 that lasted for two years produced a pronounced cooling. This was the “ice age scare” of the late 1970’s.
After 1978 a serious divergence began between this model based on sun and ocean cycles and the GHCN measurements, leading to the current 0.6°C difference. For UAH satellite measurements this difference is less, from 0.3°C to 0.45°C, depending on the level set for the 1979 record beginning relative to GHCN.
To account for this difference, the reader is urged to note the changes over the years to the global temperature records as found by the following reporters:
– Steven Goddard: Data Tampering At USHCN/GISS and about a thousand other posts on the same subject.
– Paul Homewood: Posts Tagged Temperature Adjustments, and Another GISS miss: warming in the Arctic – the adjustments are key
– Ira Glickstein: The PAST is Not What it Used to Be (GW Tiger Tale)
– Willis Eschenbach: The Smoking Gun At Darwin Zero.
– MS at The Hockey Stick: Paper finds more smoking guns of temperature data tampering in Northern Australia.
– Ed Caryl: A Light In Siberia. This was also posted here. And Is GISS Also Cheating In The Arctic?
– Jennifer Marohasy: Corrupting Australia’s Temperature Record, along with here, here, and others.
– Michael and Ronan Connolly: Global Warming Solved
These adjustments can account for the whole difference between the model and the GHCN temperature record. It is not necessary to invoke any CO2 warming. If it is there, it is very slight, on the order of 0.1°C.
The model indicates that it has been cooling since 2010, and that the cooling will continue as solar output declines and the AMO goes negative. Yes, the years from 1998 to 2010 were warmer than the 20th Century average because the globe was at the peak of all the natural cycles. But it is all downhill from here.
Cooling next 30 years
Solar activity is going into a decline as well. We don’t yet know if this decline will be to a Dalton Minimum-like level or a Maunder Minimum level. The model projection into the future does not contain ENSO or volcanic data as that data cannot be predicted. But it will get cooler for the next thirty years. The AMO will turn positive some time in mid-century, and solar output may not decline as much as indicated, so another full-blown ice age is not beginning, but a Little Ice Age may be starting. See here for further projections into the future based on the deVries 230-year cycle and the 1000-year Suess cycle.


Judith Curry just posted an article describing a delayed volcanic warming effect that may be another factor leading to the early and late 20th Century warming, years after the volcanic activity.
http://judithcurry.com/2015/02/06/on-determination-of-tropical-feedbacks/
This factor is also now ending, as we have had no major (VE5 or 6) eruptions since Mt Pinatubo.
We have much to learn about the climate system. The distraction provided by the CO2 alarmists has delayed this learning for over twenty years.
Your video TheBoyWhoCriedWarming gets redirected to a Blacksmith site. By the way excellent video
Fascinating how, in view of the decade and a half pause, the Warming Alarmists have shifted their argument to, “Since the sun is becoming quieter, it should actually be cooling, but it’s not!” — when just a few years ago, natural factors were considered negligible compared with human greenhouse gases.
If it DOES become cooler, I hope it isn’t too severe.
These sorts of things are not clean. The several points below show why.
Your chart (Figure 1) has a line for “Solar” and a line that includes “sunspot number” or SSN. It is not clear (unless I missed it) that Solar = SSN; or something else.
There are different SSN series. It might be best to use another solar metric that does not have this problem. Or explain.
The El Niño 3.4 index is used by the USA folks but is not the only metric that can be used. The Japan Meteorological Agency did declare an El Niño in 2014.
http://www.reuters.com/article/2014/12/10/us-elnino-japan-idUSKBN0JO0I620141210
At the end there is “. . . the deVries 230-year cycle and the 1000-year Suess cycle.”
On 2 Feb., on this site, I wrote:
Some places show a “de Vries (Suess) cycle” of ~208 years. Here we have a 1000 year Suess and a 230 year deVries. There are others. The 3rd one here (60-65 years)[another place it is 65-70][elsewhere, 50-80] seems to be the Atlantic Multidecadal Oscillation (AMO), . . .
So here is my issue. I know there are definitional problems with some of the variables used. I don’t know how these are handled in this presentation. Thus, for me, the presentation raises more issues than it answers.
Solar = SSN
El Niño 3.4? I needed to pick one. They are all similar, especially after annualizing.
The AMO is also not a constant length, so all those periods could describe it. In the graphic I used 75 years.
It has always been my objective to raise issues and provoke discussion.
No, we are already in the middle of slight net cooling as I explained three and a half years ago in an archived statement explaining why this will end soon after the year 2027. Then we will see 30 years of warming from 2028 or 2029 to a maximum in the 934-year cycle around 2059, after which there will be nearly 500 years of cooling. The plot on our group’s website (linked via the name above) shows temperatures until 2200.
Yes our planet seems to have many cycles within cycles when it come to cooling and warming. Over at tallbloke talkshop they have looked at these many times but the one I feel readers here may find interesting is the posting about the 1200 to 1500 year cycle as everything appears to point to us due one soon.
https://tallbloke.wordpress.com/2013/01/09/tim-cullen-solar-system-holocene-lawler-events/
I particularly like the note about the Voyager 1 space probe seeing a cyclic variation in solar particle that are show to have a probable time period of 1350 years. Nice correlation…
“Since the sun is becoming quieter, it should actually be cooling, but it’s not!” – I tried to apply that ‘logic’ when boiling a pot of water. I reduced the heat a little, expecting the pot of water to freeze. The denialist thing refused to freeze, still boiling after a while. I guess even a pot of water can deny the ‘logic’ of warmists.
Sun-Climate 101
I’ve graphically summarized numerous well-constrained sun-climate observations throughout the comments section here:
https://tallbloke.wordpress.com/2015/02/06/gerry-pease-sc23-24-longest-peak-to-peak-solar-cycle-length-since-dalton-minimum/
Charles Krauthammer compared global warming junk science to an Indian rain dance.
“The science is unstable. Because in the case of climate, the models are changeable because climate is so complicated. The idea that we who have trouble forecasting what’s going to happen on Saturday in the climate, could pretend to be predicting what’s going to happen in 30 to 40 years is absurd.
“And, you always see that no matter what happens, whether it’s a flood or it’s a drought, whether it’s warming or cooling, it’s always a result in what we are ultimately talking about here – human sin with pollution of carbon. It’s the oldest superstition around. It was in the Old Testament. It’s in the rain dance of native Americans. If you sin the skies will not cooperate.”
–Charles Krauthammer, MD
Charles Krauthammer compared global warming junk science to an Indian rain dance.
“The science is unstable. Because in the case of climate, the models are changeable because climate is so complicated. The idea that we who have trouble forecasting what’s going to happen on Saturday in the climate, could pretend to be predicting what’s going to happen in 30 to 40 years is absurd.
And, you always see that no matter what happens, whether it’s a flood or it’s a drought, whether it’s warming or cooling, it’s always a result in what we are ultimately talking about here – human sin with pollution of carbon. It’s the oldest superstition around. It was in the Old Testament. It’s in the rain dance of native Americans. If you sin the skies will not cooperate.”