Wintertime is when people especially need reliable power for their homes, living and workplaces – especially in a northern country like Germany.
Unfortunately wind and solar power just aren’t able to come through and deliver when the chips are down.

The above chart shows German power supply by the various sources available and demand over the last 30 days. The lion’s share of Germany’s installed renewable energy (wind and sun) went just about completely AWOL three times during the period. Chart source: Agora.
Dark blue – conventional power (fossil and nuclear)
Medium blue – wind
Yellow – solar
Green – biomass
Germany today has a combined installed wind and solar capacity of close to 80,000 MW (see chart below). But as the chart above shows, often they put out only a tiny, measly percentage of that.
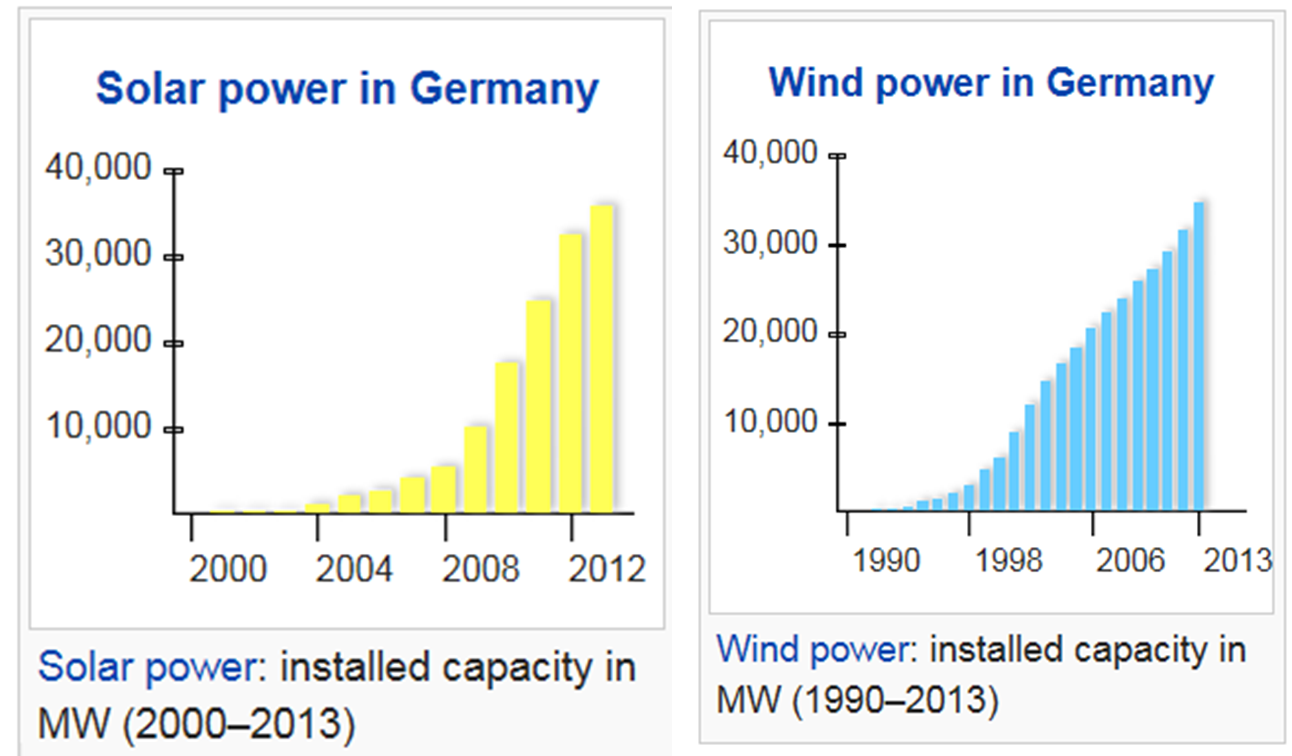
Germany installed sun and wind capacity (2013). Source Wikipedia.
And on the seldom occasions when the sun and wind do both happen to be in supply at near full capacity, the power grid gets severely overloaded, conventional power plants have to throttled, massive amounts of surplus energy need to be dumped at negative prices in foreign countries, power plants have to shut down (and lose money), yet can never be taken off line. Overall the German energy production system system is market hostile where demand is ignored and supply is uncontrolled.
Recently, German energy giant E.ON announced it is getting out of conventional power generation business altogether: too risky and no foreseeable profits in the future.
Former German Economics Minister and socialist party honcho Wolfgang Clement calls the German Energiewende “a disaster“.
in a recent stinging op-edpiece, environmentalist centre-left Die Zeit called the Energiewende “a blunder with ugly consequences“.
Renewable energy expert Prof. Fritz Vahrenholt recently called Germany’s energy policy “suicidal”.
Late last year, German Vice Chancellor and socialist party leader Sigmar Gabriel called the mad rush to green energies “ruinous” and said “others think we’ve lost our marbles“.
Overall in Europe wind puts out on average a measly less than 15% of its installed rated capacity.
Much of Germany’s solar system manufacturing, which in its heady days employed tens of thousands, have shuttered their operations – leaving a silicon rust belt in its wake and tens of thousands of disillusioned workers.
To top it all off, Germany’s coal consumption has risen, and not fallen as green energy proponents hoped.
But don’t expect to read this at Winston’s Wikipedia, or to hear any of it from Europe’s green energy swindlers.


Well done Pierre keep preaching the gospel.
The penny will only drop when Germany or the UK has a significant grid failure due to loss of Renewable Energy. I hope that will occur in the UK before the election only then maybe the country will understand the stupidity of the Green religion. And that there is something they can do about it at the ballot box.
Very seriously. we are on the same page and I am contemplating doing exactly what you are planning. I’m a resident of Maryland which recently voted on strictly party lines to fund a $1.4 Billion 220 MegaWatt offshore wind project. This project is analogous to the Cape Wind Nantucket Sound offshore project which has been under consideration for the past 11 years. This project has been subjected to intense scrutiny by the population most directly impacted. Unfortunately this population was discounted as NIMBY which is pejorative which frankly I bought into and have since then changed my mind.
Cape Wind, the first offshore turbine project has had a major setback and probably won’t happen. The reason why it is unlikely to be built is because the ‘NIMBYs” over a ten year period subjected the promoters to $100 million in litigation expense and because the project failed to meet begin of construction clauses in the outrageous contract cost negotiated with the two Utilities which recently have withdrawn their participation Be advised that New Jersey, Delaware, North Carolina, Rhode Island and Maryland are on the same trajectory as they have offshore wind projects in the planning stage.
To your comment. The important numbers are Nameplate Capacity (maximum measured output under optimal conditions), Capacity Factor (the actual output as measured by real time measurements). There is a third factor which is referred to as Demand Capacity which is incredibly important but not relevant to this post.
Example, Industry standard Capacity Factors for Nuclear 90% to 92%, Coal 64%, Natural Gas 85%. Actual measured output divided by nameplate.
Example. The GE Flex 50 is currently the state of the art Combined Cycle Natural Gas Turbine plant. This plant cost is $450 Million (right to work state) $550 Million (Union State). Currently GE is building one in France at 500 Million Euros. This plant has a Nameplate rating of 510 MW, it’s Capacity is 85% (Industry standard) the calculation is Nameplate X Capacity Factor X 8760 ( annual hours). Therefore 510 X .85 X 8760 = 3.8 MegaWatts, annually. 410 Million /3.8 MW = on a one year basis = $118 per MW
The Cape Wind Project is documented at $2.6 Billion, Nameplate 468 MW projected Capacity Factor 30% to 34%. Therefore the output is 1.4 MegaWatts annually. Again the math is 2.6 Billion / 1.4 MW = on a one year basis = $1,857 per MW.
Again, I would really appreciate contacting you because I’m planning to bombard my State Representatives with a concerted effort to point them to the basic cost/benefit analysis on their projected project.
“This plant has a Nameplate rating of 510 MW, it’s Capacity is 85% (Industry standard) the calculation is Nameplate X Capacity Factor X 8760 ( annual hours). Therefore 510 X .85 X 8760 = 3.8 MegaWatts, annually. 410 Million /3.8 MW = on a one year basis = $118 per MW”
I’m confused. 510 MW * 0.85 * 8760h = 3797460.0 MWh or 3.8 TWh; not 3.8 MW.
As far as I can tell one MW of new gas capa costs roughly one Megabuck and that’s that.
Two Items:
The optimum production dates shown for wind and solar caught my attention. It appears that, on a good day they are still less than 50% efficient. Am I correct?
Second, would you inform regarding permission rights for reuse of this article. My intent is to use it to inform our newspaper reporters and our opposition politicians. My state, Delaware has placed a mandatory tax on gas and electric bills to… build offshore wind turbines and solar panels.
Regards and thank you.
Solar does reach its nameplate capacity – momentarily, in summer, during noon, when there are no clouds. Over a 24h day it can never reach its nameplate capacity; the unsolved problem of periods of darkness stands in the way.
Power output over a day looks somewhat similar to a Bell curve if not interrupted by clouds.
Well Dirk, you just touched on the reality of the definition of Nameplate, “maximum” output under ideal conditions on a one hour production time frame. “Capacity Factor”, the measure of the actual output for the time frame of 8760 annual hours per year divided by the “nameplate”. This calculation results in a metric which may used in a cost benefit analysis.
this is a terrible idea!
electricity produced during day time is worth a lot more than during night time.
your calculation is giving a completely false result, as it is punishingh solar PV for not being able to provide power at 2 am to 4 am (when no power is needed).
a reasonable approahc will multiply the power produced with the price of power at that time.
solar PV is a very usefull source of electricty and it will be even more so, when more people switch to air conditioning.
Sod, John has given the canonical definition of capacity factor.
“your calculation is giving a completely false result, as it is punishingh solar PV for not being able to provide power at 2 am to 4 am (when no power is needed).”
A calculation does not punish. A calculation is correct or incorrect.
You have repeatedly shown to have no math or physics or EE skills or knowledge – and are even unfamiliar with the most basic terms.
May I ask you: Are you a German journalist?
my skills are fine.
look at my emergency diesel. It is running only a couple of hours per year. HGorrible capacity factor.
look at on demand water power. delivers power only for minutes! horrible capacity factor.
we should get rid of both and the grid would become much more stable…
You wouldn’t know an emergency Diesel if you sat on it.
Are you a sociology student?
only insults left, no arghuments?
hydro power has a global average capacity factor of 44%.
Why would anybody run such an unreliable power source?
You are confused. I explained why the capacity factor of solar must be below 50%. You take that explanation as an insult. It is in fact a simple explanation of facts.
IF solar power AND storage WERE cheap enough to survive unsubsidized, that would not stop its success.
It is a simple fact that currently solar is not capable of surviving unsubsidized, and not capable of being a useful source of energy if there were not a 100% fossil fuel spinning reserve.
People like you force us to install and maintain two energy infrastructures, one fully capable on its own, another one as an unneeded crutch.
This is , of course, unnecessarily wasteful, diminshes the standard of living of everyone EXCEPT the receivers of the subsidies.
It is also unnecessarily destructive to the environment, so your Greenness is only a pretense. You represent the destructive, dishonest forces that hold humanity down. Why? Because you are unable to survive under fair conditions.
It’s been shown that energy feed-in acts are the biggest poor-to-rich wealth redistribution schemes around that favor rich property owners and force the poor to cough up the money. Either you are one of the few beneficiaries, or one of the many victims.
Dirk:
why is water power if a capacity factor below 50% a good power source and why is solar (or wind) with a capacity factor below 50% a bad power source?
(the answer is somewhat obvious, by the way!)
Pierre has posted a link in his newest post (“75% of international experts…”) in which the experts come to the conclusion, that their country could run on 100% renewable electricty producton in 2050.
That is not my opinion, but those of the energy experts.
and not “my” experts, but the ones Pierre chose to quote!
Pierre:
i do not like this redistribution and it is a real problem.
But there are solutions (for example the new solar schemes paid by a company on your roof…)
And poor people benefit from falling prices of power. and in the long run, alternative power will drive prices down. (this can even now been seen in Germany, by the way!)
[…] In a separate post, Gosselin adds in solar power and shows that in the last 30 days, in the dead of winter, both wind […]
I’ve assumed that “installed capacity” is a number derived from the physical dimensions of the unit and how well its internal components work. I don’t know if that is true. The metric used ought to be stated with regard to the Betz limit.
Betz Limit: 59% This is the maximum achievable efficiency of a wind turbine.
http://www.wind-power-program.com/betz.htm
See the paragraph under equation (7).
Robert Doyle @15:06 mentions “still less than 50% efficient” but I don’t know what the true context of this is. If the things could get power from the wind 24/7 they could be useful even at a moderate efficiency. Such wonderful gifts used to be called “White Elephants.” That’s a neat term with an interesting history. Wind power might better be described as stupendously stupid.
This seems to me a little strange. A wind turbine is a machine that converts the work of the wind into rotational energy to drive a generator. An aeroplane propeller converts the work of an engine into rotational energy to drive a wind. (These are really the same thing except reversed). Even the Wright brothers first propellers were 66% efficienct, and modern propellers are about 85% efficient. Why should wind turbines not have efficiencies similar to propellers?
“The Performance of Wind Farms in the United Kingdom and Denmark”. Dr Gordon Hughes, 2012, Renewable Energy Institute.The normalized load factor for UK onshore wind farms declines from a peak of about 24% at age 1 to 15% at age 10 and 11% at age 15. The decline in the normalized load factor for Danish onshore wind farms is slower but still significant with a fall from a peak of 22% to 18% at age 15. On the other hand for offshore wind farms in Denmark the normalized load factor falls from 39% at age 0 to 15% at age 10. A 2009 study reported by CEPOS, a Danish think tank, found that while wind provided 19% of the country’s electricity generation, it only met an average 9.7% of the demand over a five year period, and a mere 5% during 2006. This referred to as Demand Capacity. “Wind Energy, The Case Of Denmark” September 2009
John could you define “normalized load factor” for readers unfamiliar with the term?
Thanks
In statistics, when presenting raw data in the form of independent variables of differing orders of magnitude to an algorithm, say a polynomial regression, one must first order the values in a form that the algorithm can process appropriately. For each value of the independent variable one examines the range of values in that dataset and ranks them from highest to lowest. One then converts the values to a range of 0 (lowest) to +1 (highest) while maintaing the hierarchal relationship of the original raw data.. This must be done in order for the polynomial regression to produce a statistically meaningful result.
Richard, maybe what you’re talking about is efficiency relative to the Betz limit.
http://en.wikipedia.org/wiki/Betz%27s_law
The output of a wind turbine rises with the 3rd power of the wind speed. To generate 100% of its nameplate capa, the wind would have to blow exactly at max speed for this turbine, beyond which the turbine goes into automatic emergency shutdown, no longer generating anything. THat’s why the power surges are such steep spikes, and that’s why most of the time they generate virtually NOTHING at all, and then momentarily a lot.
Efficiency of propellers/turbine blades is irrelevant.
The Wright brothers were able to apply controlled power to create their wind.
The output of their engine was predictable and able to run at a constant speed.
Ask any sailor you know whether wind energy can be controlled at constant speed on demand.
Very good I will try and get this to the folks in Ontario who a fighting the same issues as Germany and UK. However, the greenies have junk science to fall back on. Thank you Mr. Gore!!!!
Not the only problem with solar energy.
http://www.theguardian.com/money/2015/jan/29/investors-lose-millions-bond-company-administration
Thanks Pierre! Your blog totally ROCKS! Always very interesting content.
Thanks!
What a nice controversy on the energy system analysis.
Everybody knows that renewable energy needs long term storage, Nature has I. Fact already made it by storing biomass underground and convert it into fossil fuel.
So the Energiewende needs more then just short term thinking.
1) think efficiency, efficiency in usage, efficiency in conversion
2) do not forget that inefficiency is heat
3) think cogeneration
4) (40 years) old inefficient systems have to be replaced by smart systems
5) smart systems needs smart engineers and smart politicians and smart citizens
Not sure that the one who analyse the system with data from the past are in the position to make any critics. The disaster is doing nothing, the future is negawatts.
“4) (40 years) old inefficient systems have to be replaced by smart systems”
This tells me that you have no idea of the efficiency of German municipal district heating and power generation – from coal and gas. BTW these systems constantly get expanded and improved.
The 14.8% figure is worked out from the MW per hour delivered over the year, divided by the installed capacity at the end of the year. This is not as accurate as using the average installed capacity for the year.
The average installed capacity ‘eye-balled’ from the graph is about 37,000 MW, which then gives a figure of 15.8%. This is still catastrophically poor.
Any wind turbine enthusiast, with a modicum of environmental concern, try to justify more wind turbines from this image: http://lftrsuk.blogspot.co.uk/
I am puzzled: in the graph, why is the Stromverbrauch konsistently some 15GW below (!) the Stromerzeugung?
because Germany is exporting a lot of power.
If you go to the source of the graph (link above, AGORA) and you change timeframe to last year(letztes Jahr), you will see the few occasions were demand is higher than (domestic) supply.
aghain: germany is exporting a lot of electric power. The “unreliable” alternative power is helping out Francew which has trouble with its nuclear plants.
(and no, this is not “giving away power for free” but profitable business!)
So, sod, we pay 20cent/kWh in subsidies to the PV owners, and then sell the electricity for 5cent/kWh to the French just to get rid of it, and you call it profitable? Well, surely for the PV owner, I agree with that.
I fear that people with limited understanding of the topic will be misslead by the information presented here.
There seem to be several missconceptions.
Nampeplate capacity for solar and wind has a completely different meaning than for a gas or coal plant. you do not expect to reach nameplate capacity regularly.
the capacity factor obly matters if linked to a price. (or if the system is extremely unstable, which it is not at 20% to 30% renewables)
The article in “Die Zeit” is also presented in a way, which will cause people to draw false connclusions. Please read the full piece, if you are able to do so in German!
In short, there is a problem: Instead of coal we have seen a reduction of power produced by gas. But the cause of this is a failure of the CO2 certificates and several other developments which really were difficult to foresee.
The situation has changed since the “Zeit” article was printed in Dezember. CO2 output has dropped and is not rising any longer.
…Subsidies stay at 20 bn EUR per year for the time being due to the failure of PV to deliver in last August (having less PV production reduces the monetary loss as less subsidies have to be doled out).
Let’s hope for a very cloudy year… hopefully with no wind… would immediately lift German standard of living…
Sorry about this argument, but nameplate power is what is listed on the “nameplate” of the unit. Every good manufacture of generators will list for Ann generator, motor, engine or boiler, what the capacity of work available for an input, such as inputed rpm, if the wind goes over speed, ant the imputed power cannot be adjusted, or the wind dies, the output cannot be stabilized to the proper output, should you use this to recharge grannies pacemaker?
please look at the graph at the top of this discussion. Wind never drops to zero, so your granny would be doing fine.
Solar is (OBVIOUSLY!) not meant to produce power 24h per day. But it does follow peak demand rather nicely (that is also obvious, if you look at the graph again..).
If you check the graph, you will also notice that the “AWOL” Wind around the 20th January does not change the amount of surplus power over demand. Germany is not forced to export more power during the high wind times at the start of the graph either. The GHerman power grid is rather stable and has no serious problems with a little bit of wind or solar power.
sod 17. February 2015 at 00:35 | Permalink | Reply
“please look at the graph at the top of this discussion. Wind never drops to zero, so your granny would be doing fine.”
Sod, you are not talking to the average Green numpty here. Wind power production grows with the 3rd power of windspeed, which shows your statement to be meaningless drivel. Please up your game just slightly, would ya.
I do not understand, what you are trying to tell me.
wind power is doing fine. It is a cheap power source and most countries will have about 20% of it in a couple of years. And this will work without problems, as we can see from places with highh amounts of wind power today.
Th egraph above demonstrates this really well. The difference between domestic demand and peak production does not realy changhe, when there is lots of wind or when there is very little. The system is pretty stable.
Wind power is highly unstable. Anyone who thinks otherwise needs to check into a clinic.
nobody is denying that wind is not a 24/7 power source.
But this has no effect in a stable power ghrid, up to a rather high penetration of wind.
you can see this in the hgraph you posted above. The relevant relationship (power produced to power used) does not changhe dramatically with the rise an d fall of wind.
“wind power is doing fine. It is a cheap power source and most countries will have about 20% of it in a couple of years.”
sod, you never heard of this, but electricity is only 1/7th of German primary energy consumption. So even if the randomly occuring wind power spikes (requireing 100%backup capacity for the long windless times) add up to 20% of electricity production that is still only 3% of total energy needs.
Of course, reducing energy consumption by a factor of 30 would fix that. But I don’t see the greedy fat government reducing its consumption. (Yes! The greedy fat state consumes energy too! They like it warm, and they like fat luxury limos!)
5this article is about electric power.
But wind (and solar) will also effect other power demands.
Backup for alternative power will come from small local heat and power plants.
and cars will switch to electric, which will solve a big part of the storage problem (car batteries will provide storage, but the bigger effect will be a massive reduction in price for battery storage).
Whgere are those long windless times? the graph shows 2 days with little wind. Is that what you mean?
sod, you never before heard of a blocking high? My oh my.
As to the fairytale of the owner of an expensive electric car giving away the expensive recharge cycles of his expensive car battery: Please stop believing the crap that German journalists write.
Due to battery wear and tear and conversion losses a kWh that goes IN and OUT your battery again costs about 1 EUR.
Of COURSE you can heap madness on madness; the USSR did; you only collapse the entire economy at a not too distant point.
sod:
local heat and power units are a good idea as they have a high efficiency of energy use. Denmark has over 600 CHP units. Unfortunately only a small proportion of the world’s population is living in a position where the continuous heat can be used.
Worse, the fluctuating power from wind (and solar) interferes with the economics of CHP, as the ‘renewables’ have priority, so one way of reducing emissions rules out the other.
As for car batteries???? Think, you have a car so you can be mobile when you want, not just when someone 20 km. away wants to run his large TV.
my car spents 99% of the time parked. how about yours?
So you are using your car for 15 min a day – 7.5 min each way. Assuming you have to travel through your village or city before going on faster roads, that’s 50 km/h, 7.5 min, or about 3.5 km each direction.
Or 2700 km a year.
I understand that you could do that with an electric car.
What I don’t understand is – why do you have a car at all?
Oh sorry, I miscalculated.
It’s 2555 km a year. Don’t know where I botched it.
Why do you talk about me? how much time is your car spending on the road? 99%?
I left my car after a party at the house of a friend last saturday and have not picked it up yet.
i did not calculate the 99% number (rule of thumb), but your figures are rather accurate (apart from the annual total, which is highher but this is explained by a higher speed).
Like most families we own two cars, when we need 1.5 at best. But as noone is selling us half a car, we need two. we will have an electric car, as soon as the price gets reasonable.
This (second car for short trips) is the typical situation in which electric cars will be used first (again, the price is a serious problem, but look at the amount of money people pay for cars that get rarely used!).
if you use your car 24/7 DRIVING or you tend to do 1000+ miles trips every day, do NOT get an electric car (but even the car dealer will tell you this!).
10 second google search gives this link:
http://www.greencarreports.com/news/1071688_95-of-all-trips-could-be-made-in-electric-cars-says-study (95% Of All Trips Could Be Made In Electric Cars, Says Study)
On the “study days” used in this analysis, 39% of the cars were not, moved. Funny fact, eh?
I would still like to know: How much of they day does your car spend movingh?