The Sun in May 2015, and Atlantic Waves
By Frank Bosse and Fritz Vahrenholt
[Translated, edited by P Gosselin]
Our primary “fusion reactor” remains in a weak phase in its current solar cycle, number 24 since systematic observations began in the year 1749. In May sunspot activity was below normal. The observed sunspot number (SSN) was 58.8. The mean of all previous cycles for the current 78th month into the cycle is SSN=79. Thus May saw 75% of the usual activity.

Figure 1: The current cycle 24 (started in December 2008) is shown in red and is compared to the mean cycle (blue) and to cycle no. 5 (black).
A pronounced lull
Figure 1 shows that current solar cycle 24 has never exceeded the mean (blue) at any time since it began. In the 78 months since the it began, SC 24 has always been below normal. This has never been observed for any previous cycle. The low solar activity since December 2008 is unique when it comes to its consistency when compared to the other cycles since observations began!
Even when activity reached a maximum in October 2011 in the sun’s northern hemisphere, and in February 2014 for the southern hemisphere, it remained just below the mean value. Together with the delayed start of the cycle we now have a record 10 years of quiet solar activity.

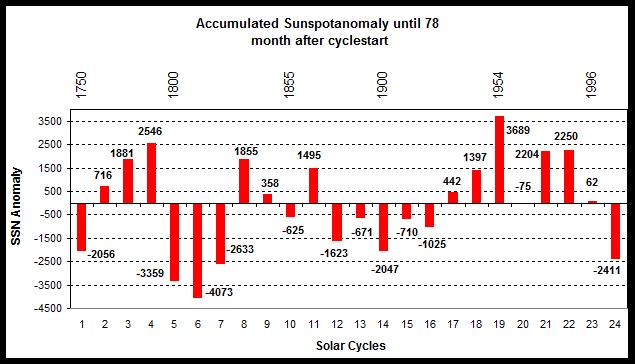
Figure 2: The accumulated sunspot anomaly of all cycle up to the 78th solar cycle month.
Figure 2 depicts a comparison of all the cycles with respect to solar activity. So far the current cycle is in 4th place in terms of low activity. But 3rd place is very reachable because SC 7 saw high sunspot values in its last third of the cycle, and so the chances are good that the total activity of SC 24 will be quieter than the last cycles of the Dalton Minimum.
Atlantic waves…
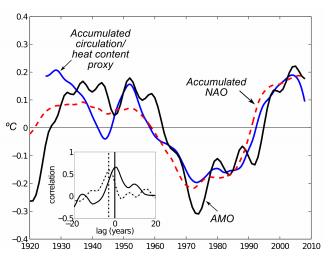
…are really high when it’s stormy. In early May off the coast of Portugal one of the co-authors of this article came to realize this in a 14-meter long sail boat. But the Atlantic also created other types of waves in the past month. A team of scientists led by Gerard D. McCarthy of the University of Southampton went on the search for internal North Atlantic variability, see www.nature.com/nature/journal.html. They determined that the Atlantic Multidecadal Oscillation (AMO) not only has ups and downs in sea surface temperature (SST) in the extratropic Atlantic region, but that these temperature variations lead to changes in sea level (SSH) along the east coast of the USA. The pattern appears as follows:

Figure 3: The “circulation series” shown in blue. In the paper the SSH variation is determined by comparing the sea level south of and north of Cape Hatteras. The AMO is black. Source: Figure 3 of the cited McCarthy publication.
The relatively long time series of tide measurements at the East Coast is thus a proxy for the ocean heat content (OHC) of the North Atlantic. Its direct measurement since the 1950 entails large uncertainty. But beginning in 2004 it has been much more precise thanks to the submerged ARGO measurement buoys and the RAPID network.
What implications does this study have? First of all, the existence of natural Atlantic Multidecadal Oscillations is confirmed, and not only as a variation in sea surface temperature (SST) as it was previously defined. It is now sure that the AMO is a large-scale North Atlantic water mass circulation pattern. It is an independent internal natural variability of our climate system, and not just one involving global temperature.
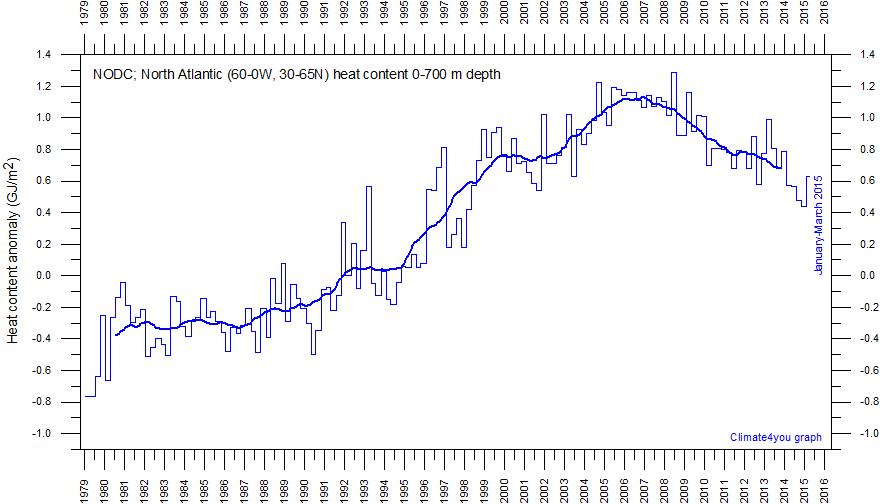
Already in January 2013 we pointed to falling North Atlantic ocean heat content (OHC) since 2007. What follows is the data plot:

Figure 4: The ocean heat content (OHC) of the extratropical North Atlantic since 1979. Source: Climate4you.
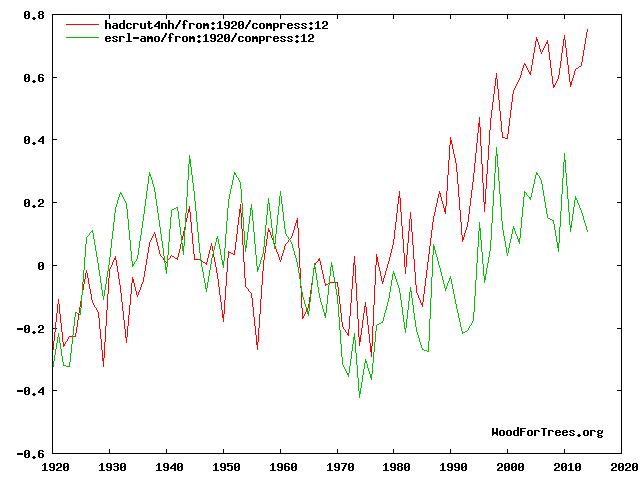
In the paper and its accompanying press release it is explained that the current decline in the OHC means it is announcing that the probability of the North Atlantic cooling more than 10 years is very high. The AMO’s impact on temperatures in the northern hemisphere was major in the past, as the following plot shows:

Figure 5: The AMO (green) compared to temperature changes of the Northern Hemisphere (red).
If the AMO exists as an internal variability, as the McCarthy paper tells us, then that could imply that 0.5°C warming seen in the northern hemisphere since 1975 was due to the AMO and that the remaining 0.5°C of warming was due to impacts from greenhouse gases and other factors, such as varying solar activity.
For estimating climate sensitivity from greenhouse gases, this has far-reaching implications: Up to now we were not able to completely exclude the impact of aerosols on the cooling of temperatures between 1945-1975, but now it is appearing as increasingly improbable. Indeed it is becoming more evident that the cooling was due to the weakening AMO during that time period (see Figure 3).
If indeed aerosols have a lesser cooling effect than previously assumed, then the climate sensitivity with respect to greenhouse gases must be less. Since 1975 for the northern hemisphere it was not 0.26 °C / decade increase, but rather only 0.13. This is close to being identical to the southern hemisphere. We’ve often discussed this 50:50 order here …and once again we are confirmed.


… which underlines just how little we know about the factors driving climate on earth.
In Figure 5, most of the divergence between HadCrut and esrl comes from data adjustment.
Esrl probably gives a much closer representation to real planetary temperatures.
The green curve in Fig. 5 is the AMO.
The red curve in Fig. 5 is the N. Hemisphere Temp. Anomaly.
No, the red line is HadCrut 4 !
ps.. because that red line is HadCrut, I maintain that the green line is almost certainly closer to the reality of NH temperatures over that last 100 or so years, than the red line.
Otherwise, the people at the CRU would not have worked for their money.
Aerosols might have a warming impact due to Clean air act-at least in the northern hemisphere after 1980.
Global dimming cools the earth but when aerosols go out of the air we get global brightening.
More here:
http://journals.ametsoc.org/doi/pdf/10.1175/BAMS-D-11-00074.1
Analysis which shows the cause of climate change:
1. Establish a least-biased assessment of all reported measured average global temperatures (AGT).
2. From examination of historical AGT and historical solar cycles, form the hypothesis that a relation exists between sunspot numbers and the planet warming and cooling.
3. From examination of historical AGT and other information, determine that ocean cycles contribute to AGT and the effect of ALL ocean cycles on AGT can be approximated by a saw-tooth function with period 64 years and amplitude of approximately ±1//5 K (to be determined more precisely later).
4. Apply the first law of thermodynamics (conservation of energy) to obtain an equation relating the historical measurements. Incorporate coefficients on each term in the equation to facilitate optimizing the equation to best match the calculated temperature anomalies to the measured temperature anomalies.
5. Apply the mathematics of coefficient of determination, R2, to compare the calculated temperature anomalies to historical measured temperature anomalies.
6. Adjust the coefficients in the equation alternately and repeatedly to obtain the absolute maximum R2. This results in R2 greater than 0.90 irrespective of whether the influence of CO2 is included or not and an equation which predicts a future down trend in average global temperatures.
7. After Schwartz (2007) and other considerations, rapid (year-to-year) variations in reported average temperatures contain substantial random uncertainty as to the true energy content of the planet. This uncertainty is substantially removed by taking a running average of reported measurements. A 5-year running average increases R2 to greater than 0.97 leaving less than 3% to explain all factors not explicitly considered such as volcanos, aerosols, measurement errors, non-condensing greenhouse gases (the average sunspot number is a proxy accounting for average water vapor, the sunspot number anomaly is a proxy which accounts for cloud variations), difference from assumed wave form of ocean cycles, ice change, etc.
This analysis, along with independent proof that CO2 has no effect on average global temperature (and therefore no effect on climate) is at http://agwunveiled.blogspot.com .
Sorry for offtopic. Just to point that the site is much more difficult to read than the older one. Also the image in background is too contrasting.
If you mean the font size, use ctrl + or ctrl – to zoom if you’re on a PC. I only mention this because I sometimes run across people who don’t know it, apologies if you’re not one of them.
As to the background pic, I agree… it draws a little too much attention in work environs… How about a nice cool blue glacier? 😉
Thanks, Dirk – learned something today – will not forget.
Your favorite Schellnhuber is getting ready for a big event:
http://www.breitbart.com/london/2015/06/13/popes-eco-encyclical-will-be-overtly-political-says-senior-member-of-major-catholic-charity/
Pope needs to be reminded of: “8.You shall not steal.” This is what this movement is all about. Taking other people’s money.