NOAA conflict of interest? “The problem is that the same staff responsible for creating reports and running some greenhouse models are also responsible for the databases that validate the forecasts.”
The National Oceanic and Atmospheric Administration (NOAA) June 2015 results are out and once again the government-directed institute is claiming the globe is at a record high temperature while the other independent global temperature datasets are telling a very different story.
The NOAA claims that the global surface temperature reached a new all-time record high with an anomaly +0.88°C – the warmest since recordkeeping began in 1880!
However measurements taken by satellite Remote Sensing Systems (RSS) show that although June 2015 indeed was a warm month at +0.39°C, it was only the 4th warmest June ever, and more than 30 other earlier months have seen greater positive anomalies.
Satellite data (revised) taken by the University of Alabama in Huntsville UAH show that the June 2015 temperature anomaly was +0.31°C, a warm month but not the hottest June ever as three other June months were as warm or warmer.
Moreover plots of the RSS and UAH data continue to show that global temperatures have been flat for now close to 20 years:
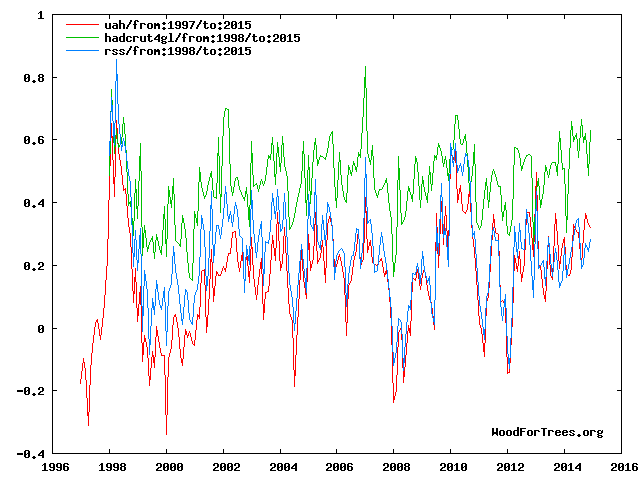
Chart: woodfortrees.org/
Even the Hadley Climate Research Unit (HadCrut) in England shows no temperature increase over the period.
Yet no one at the NOAA has gotten the idea that maybe their data and results have gone awry and that they’d be wise to look for what is causing it.
When asked what they thought of the NOAA June result, 2 expert meteorologists suggest that there’s probably more to it than faulty computational methodology and that it may have to do with scientists milking out the results they want.
When asked about the NOAA results, former Accuweather veteran meteorologist and now chief meteorologist at Weatherbell Analytics Joe Bastardi expressed serious doubts on the NOAA June results. In an e-mail he commented:
“NCEP real time data, computed every 6 hours from model input shows no such thing. It is available to the public at weatherbell.com/temperature.php. […] How is it the NCEP data, where NCEP is a part of NOAA, show no such warming? […]Moreover using NCEP data May, 2015, was the NINTH warmist, not the first, and June looks like 5th since 1998.”

2015, NOAA’s NCEP data show no records occurring.
Long-time meteorologist Joe D’aleo was more blunt about the suspicious NOAA data, writing that there’s probably on conflict of interest where the climate modelers also happen to be the data-crunchers. D’Aleo wrote in reply to an e-mail inquiry (my emphasis):
“The problem is that the same staff responsible for creating the reports about the climate (USGCRP, State of the Climate, EPA TSD, IPPC) and running some of the greenhouse models that project the scary scenarios (NOAA and downstream NASA) are also responsible for the databases that validate the forecasts. The actual data should be constructed independently of the forecasts with people who do not have a financial and personal interest in seeing their forecasts verify. Indeed we see in the independent datasets like the satellite and balloon based ones, widespread model failures.
There is a lot of control available for modelers to predict a desired result, and data source inconsistencies allow NOAA to be creative – and the result is a hybrid of data and models (with their adjustments like TOA, infilling and homogenization) to show whatever the puppet-masters in government require. It may be that some really believe in their science and work hard to mine the data, achieving a form of bias confirmation. In other cases it is ideologically or politically driven or a matter of job security.”no


The future of Green mobility has arrived in England, for only 345,000 GBP a piece.
http://www.breitbart.com/london/2015/07/21/londons-greener-cleaner-hybrid-buses-are-running-on-diesel-thanks-to-battery-problems/
Changing the reported temperature anomalies hasn’t hidden the proof that CO2 has no effect on climate. Only existing data [Phanerozoic (last 542 million years) and current ice age] and a grasp of the fundamental relation between math and the physical world are needed or used.
Proof that CO2 has no effect on climate is expressed in steps as follows:
1) Atmospheric CO2 has been identified as a possible climate change forcing. Forcings, according to the ‘consensus’ and the IPCC, have units of J s-1 m-2.
2) A thermal forcing (or some function thereof) acting for a time period accumulates energy.
3) If the forcing varies (or not), the energy is determined by the time-integral of the forcing (or function thereof)
4) Energy, in units J m-2, divided by the effective thermal capacitance (J K-1 m-2) equals average global temperature (AGT) change (K).
5) Thus (in consistent units) the time-integral of the atmospheric CO2 level (or some function thereof) times a scale factor must closely equal the average global temperature change.
6) When this is applied to multiple corroborated estimates of paleo CO2 and average global temperature (such as extant examples from past glaciations/interglacials ice cores, and proxy data for the entire Phanerozoic eon), the only thing that consistently works is if the effect of CO2 is negligible and something else is causing the temperature change.
Three estimates of paleo temperatures are shown at these links:
Temperature during the Phanerozoic: http://mysite.science.uottawa.ca/idclark/courses/Veizer%20Nature%202001.pdf
Average global temperature and CO2 levels during the entire Phanerozoic eon (about 542 million years) http://www.geocraft.com/WVFossils/Carboniferous_climate.html.
CO2 & temp during glacial and interglacial periods of the current ice age: Figure 1 at http://www.skepticalscience.com/co2-lags-temperature.htm (Ignore the narrative nonsense at this site. SS has a poor grasp of the relation between mathematics and the physical world.)
For all time, atmospheric CO2 level must have been higher than 150 ppmv or so for life as we know it to exist.
==
Identification of the two factors that do cause reported climate change (sunspot number is the only independent variable) is at http://agwunveiled.blogspot.com (now with 5-year running-average smoothing of measured average global temperature (AGT), the near-perfect explanation of AGT, R^2 = 0.97+ since before 1900).
The ongoing average global temperature trend is down. Monthly reported temperatures are being temporarily propped up by el Nino.
When I read the ‘hottest June’ headline I decided to look for myself.
June 1998
June 2015
The claim is complete rubbish. Even with your eyes you can see that June 1998 was quite a lot warmer than June 2015.
And Bruce, in July so far, your home town of Newy, is 0.5C BELOW average. ( averaging min and max anomaly)
Wish I had the June data, but I recall it being rather cool in June.
They had the snow plows out over Donner Pass in the Sierras today!
It is in the troposphere where the additional carbon dioxide is supposed to absorb more outward long-wave radiation and cause an enhanced “greenhouse” effect thereby resulting in a warming at the surface. Yet, neither the satellites (both RSS and UAH) nor the weather balloons show record temperatures for June 2015 which suggests the cause had nothing to do with “greenhouse” gases.
Left-right across-the-aisle black-white community-wide wake-up-call:
ERSSTv4 = Confirmed Fatality
ERSSTv4 supposed “bias” adjustments match decadal IPO (Interdecadal Pacific Oscillation):
http://s16.postimg.org/zbthw15fp/IPO_BIAS_ERSSTV4_HADNMAT2_ICOADSSST2_DOT5.png
The gun is smoking and that’s a deathblow to NOAA’s ERSSTv4.
Folks:
We simply cannot allow them to get away with this.
They must be compelled to retract within 2 business days.
Sincerely,
Paul Vaughan, B.Sc., M.Sc.
P.S.
…extra help with visualization for the math-averse among us:
https://tallbloke.wordpress.com/2015/06/05/noaa-tries-to-make-global-warming-slowdown-vanish/comment-page-1/#comment-104168
Warmunists have found a drama queen in the run-up to Paris, De Brum, boss of the Marshall Islands, complains that his Islands will go under, refuses to do anything about it like building stuff, (or building better housing against Hurricanes – his logic seems to be that that would be admitting failure) complains that he had to jail his Greenpeace friends because they illegaly entered a Norwegian drilling platform , complains that very unfortunately he has to do business with Big Oil (but it doesn’t matter because if he wouldn’t someone else would), proposes the entire world cuts CO2 by a third even though USA has guaranteed all of his people immigration.
Shamefully, even though the article has a “Bojanovski” as author, the interviewer does not ask whether any threat to the atolls MIGHT come from depletion of the sweetwater lense. Ok Spiegel works like this, but we are used to better quality by Bojanovski.
Also, whether or not sea level *IS* rising or accelerating in the area is not asked or answered at all.
http://www.spiegel.de/wissenschaft/natur/meeresspiegel-bedroht-inseln-tony-de-brum-zum-klima-a-1038153.html
They failed with Tuvalu, which grew instead of shrinking, they failed with the Maledives, who went on an airport-building binch, now they trot out the Marshall Islands, I guess any island nation (or premier of such) willing to go along earns a pretty handsome sum.
Several years ago I tried to publish a paper about an alternative method to compute the global temperature using averaging of the yearly trend of station data…..No surprise, there was no publication, I was too naïve.
One of the remarks of the reviewers was that “they use sophisticated climate models to fill the gaps in the data..” (to overcome lack of station coverage). Perhaps it is common practice to use the climate models predictions as input for the computation of the average global temperature. Perhaps it is part of the methodology used within climate institutes to avoid a “Chinese wall” between groups dealing with the models and the groups dealing with temperature data analysis (data bases).
/sarc: The positive feedback of that methodology works at least better than the positive feedback of water vapour on the increase of CO2. It may even explain the yearly “global increase” of the adjustments made in the raw temperature data.
“they use sophisticated climate models to fill the gaps in the data..” (to overcome lack of station coverage). –
============================
Strange, when the reality is that they eliminate up to 50 percent of viable stations and infill via a computer algorithm often the infill is from an warm region infected by UHI, so they just spread the heat around.
@David A
Indeed, they eliminate a large part of the stations since 1990, and probably we see the influence of UHI; I do not disagree with you about that.
However, I am afraid the situation could be much worse. The outcome of “independent” sources of “temperature” data like “sophisticated” climate models could also be used to infill the gaps and to compute the adjustments of the data, nowadays but also in te past. More heating due to higher CO2 levels nowadays, more cooling in the past due to lower CO2. We do not khow the homogenisation of the data is done. That is not published completely. We can only guess.
Exactly. Read the travails of “Harry Readme” in the CG1 and CG2 emails. He was the poor sod (oops, sorry – not) who was tasked with infilling those sparse matrices. No scientist or programmer with any sense of honor or integrity would do what he was asked to do.
Then again, the climatologists have shown again and again that they have no shame. Or science.
Their view of temperature data could be (to paraphrase Tom Lehrer) “if correctly viewed, everything is skewed”.
[…] This quote from meteorologist Joe D’aleo speaks for itself. (Read the full post on the NoTricksZone.com blog.) […]
It’s all about Confirmation Bias.
Those Warmists will see in the factual data exactly what they want to see. You will never be able to change their minds, because they are completely sure that they are right.
Part of understanding climate change comes from discovering what does NOT cause it.
Atmospheric carbon dioxide has been higher than now (usually several times higher) for most of the existence of earth. It is required for life as we know it. If it had any effect on climate, we wouldn’t be here to discuss it.
As the co2science.org folks point out, our current global temperature is about 2 degrees cooler than it was in during the four earlier interglacials (covering about 340k years), but co2 level is now 40% higher than it was in any of those, so obviously deflates the IPCC and the cohort claim that the principle part of our current warming is due to anthropogenic activities.
Apparently the 3 supposed terrestrial temperature datasets are not independent since each uses 90 to 95 percent of the same raw data – the difference is the three separate revisions of that raw data.
German wind industry demands access to forests. Prominent Green mayor of Tübingen, Boris Palmer, demands even access to protected forests in mountain regions. Nominally “conservative” WELT, owned by Friede Springer, BFF of Merkel, is surprised to find a majority of Germans (79%) to be against further destruction of the country.
http://www.welt.de/politik/deutschland/article144313452/Windkraft-Branche-will-jetzt-die-Waelder-verspargeln.html
Greens show their true ugly face; nominally “conservative” CDU (Green imitation) will have to face the music. Not only on this topic. I continue to hope for early elections and a resounding destruction for all the Bloc parties.
Halleluyah!
The dying of the German print “media” continues unabated.
Spiegel (owned by the globalist tax-evading foundation Bertelsmann via Gruner+Jahr) sales down 7.5% year on year.
Stern, another Bertelsmann product, down 6.4%.
Nominally “conservative” Friede-Springer-products : Bild down 9.3%; WELT down 10.4%.
http://www.blu-news.org/2015/07/22/schrumpfende-verkaufszahlen-bei-fuehrenden-medien/
We can hope for more mass layoffs! Until the state /the EU kicks in with direct financing, like already in Sweden, at which point even the flimsy semblance of independence is removed for all to see.
What have I been saying about Peak Renewables.
When the subsidies run out ! 🙂
http://www.thegwpf.com/uk-planning-bids-for-renewable-energy-projects-drop-by-80/
What is the difference (what causes them to change) between NCEP and NOAA. What is NCEP and what are the three data sets shown in the posted graphic? Is it possible to see those sets going back to 1997?
https://notrickszone.com/wp-content/uploads/2015/07/NCEP2015.png
NoTricksZone says:
No they don’t.
http://www.woodfortrees.org/graph/rss/from:1997/mean:6/plot/uah/from:1997/mean:6/plot/rss/from:1997/trend/plot/uah/from:1997/trend/plot/.png
RSS use climate models to make their satellite raw data corrections. UAH have never used, and are adamant they will never use, climate models to correct satellite data. UAH insist their method of extracting temperature profiles is therefore more accurate than RSS, and remember Dr Spencer is a CAGW skeptic. According to the UAH satellite data there is no Pause in warming of 10 years or longer.
You could have shown the linear trend lines on your chart, but you didn’t. For a site that calls itself “No Tricks Zone” that is a very sneaky trick to play. You’re hiding the incline in UAH.
At the moment, to find a Pause in UAH data you have to take the trend from April 2009 to July 2015 :
http://www.woodfortrees.org/plot/uah/from:1995/plot/uah/from:2009.33/to:2015.6/trend
This is such a short period that it does not qualify as a pause.
I have only just noticed this in UAH today and I will be refraining from stating there is a Pause until a Pause is actually detected.
[…] website called NoTricksZone has a good roundup today comparing the latest NOAA data showing supposed “records” with data from the […]
[…] website called NoTricksZone has a good roundup today comparing the latest NOAA data showing supposed “records” with data from the other […]
[…] website called NoTricksZone has a good roundup today comparing the latest NOAA data showing supposed “records” with data from the other […]