Berlin is Germany’s largest city, and in and around it there are 7 weather stations reporting to the Deutsche Wetterdienst (DWD), Germany’s national weather service.
Earlier today Germans and Berliners woke up to one of it’s coolest nights so far this fall with temperatures around the freezing point. If you asked people in Berlin what the temperature was this morning at 6 a.m., you’d get very different answers. Why? Obviously because of the siting of the thermometers.
Website Wetterkontor here showed the readings taken this morning at Berlin’s 7 official weather stations located about the city. Below is a cropped table of these 7 stations:
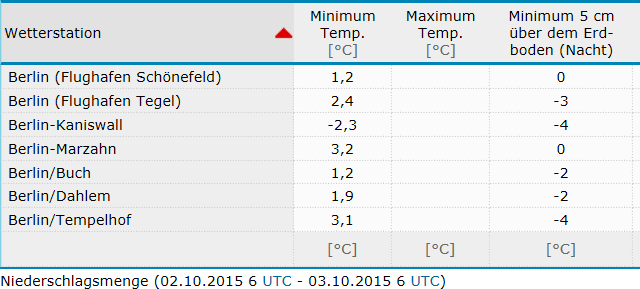
Source: Cropped from Wetterkontor.
As you can see, depending on where the temperature reading was taken, the temperature ranged from a low of -2.3°C to +3.2°C recorded at Kaniswall and Marzahn respectively. That’s a span of 5.3°C!
Clearly the urban heat island (UHI) effect is very real and thermometer readings taken in urban areas are significantly skewed upwards.
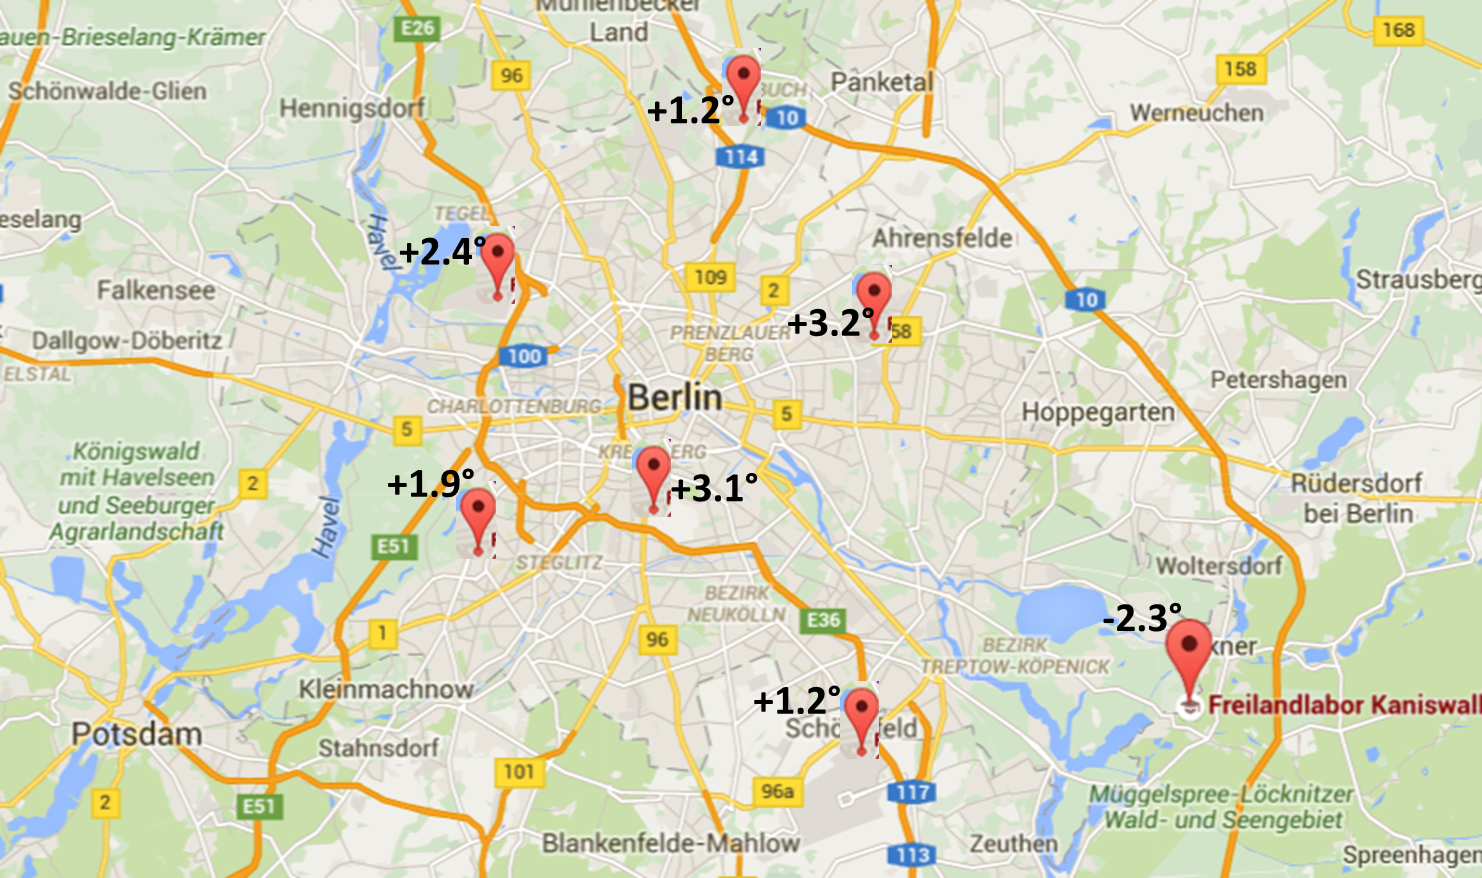
I decided to plot these results on a map depicting the greater Berlin area below. We plainly see that the stations located near the city center are warmer.
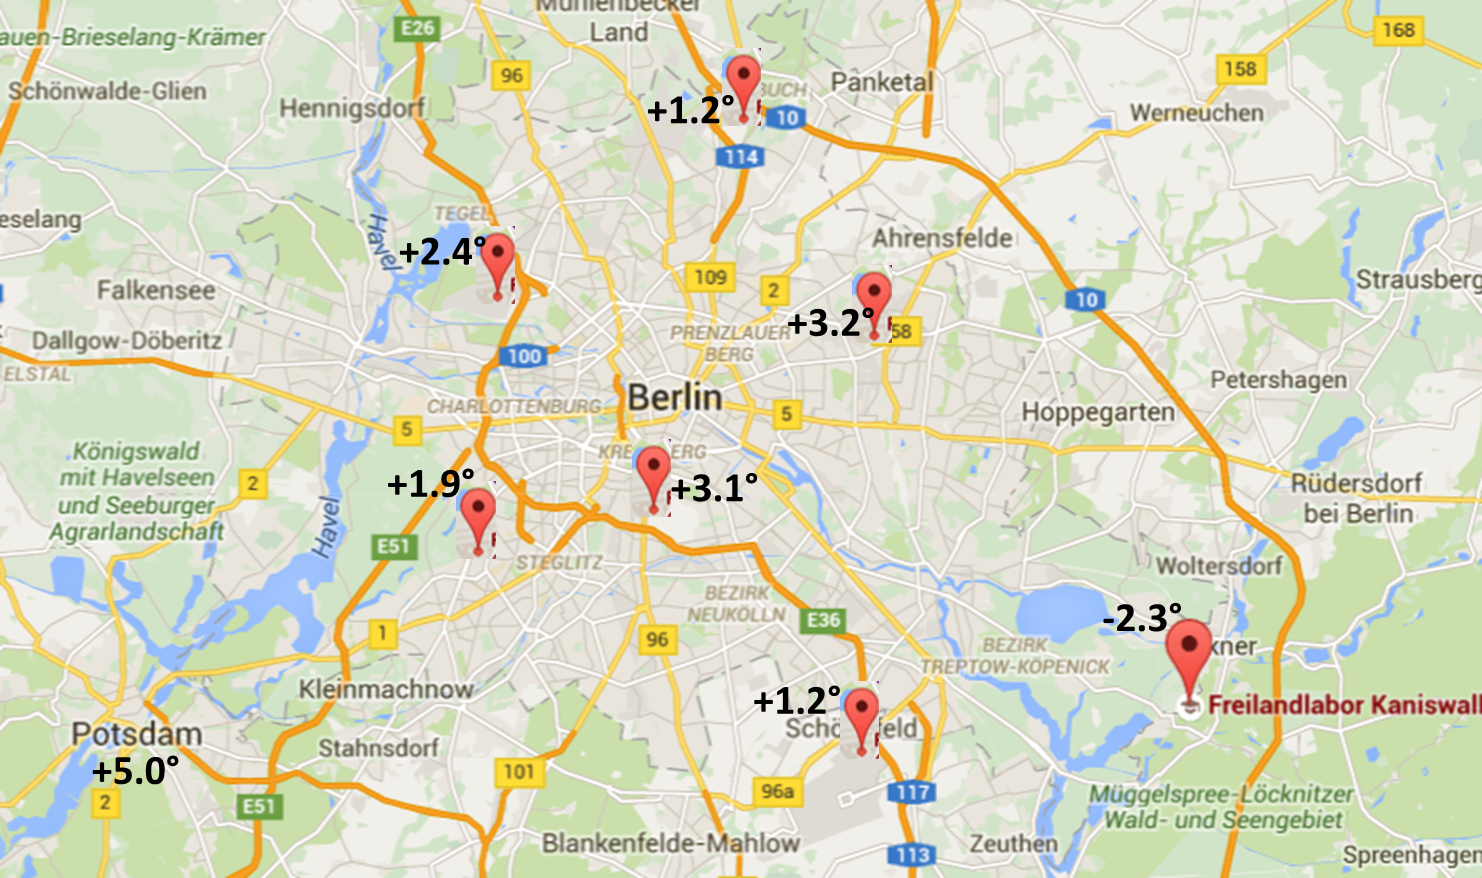
In general, the further out you get from the city center, the lower the temperatures become. This gives real meaning to “cooler temperatures in outlying areas“, which we often hear from local weather reports.
What’s the take-home message? Clearly surface readings entail lots of uncertainty, and it’s probably a good idea to fall back on the satellite readings for accuracy. Little wonder that the 20th century showed a general global warming, especially when we consider that most of the stations have been moved next to large airports and big cities made of concrete, steel and asphalt.
Of course the above are readings taken for only one morning. It would be more interesting and telling to compare the overall long-term trend of each station. But I think it’s safe to say that most of us have a pretty good idea of what those results would be.


I’ve also checked the low for Potsdam, the location of the global warming alarmist Potsdam Institute for Climate Impact Research (PIK). It was a balmy 5°C, more than 7°C warmer than Kaniswall, some 20 or 30 km away. We see the warming is real at least in Potsdam!
P.S. Now added to chart.
They have a new heating system in Potsdam. 🙂
” waste computing cycles from the heating system ”
Fantastic!
Great article! Wonder how much heat and CO2 over all is created (and wasted) by these, erm, heating devices. Not to mention all that computing power that could have been put to better use.
‘“Warm Hans” Schellnhuber’… to paraphrase the old saying,
Warm Hans, cold heart…
but, but, but, you have not gridded, averaged, homogenized, and generally tortured the data correctly…
This post prompted me to check our local (rural) numbers versus those at the very small airport 5 miles to the SW. We have no wind and a temp of 47.7° F while the values reported at the station have 23 mph (gust to 31) wind and a temp of 62. (near Ellensburg, in central Washington State)
Crazy. Made me forget what I wanted to tell you.
~~~~~which was …
Anthony Watts wrote a post on April 4, 2010 of interest, title:
Measure UHI in your town with this easy to use temperature datalogger kit
And also, local temperatures as you have reported do have a use, but climate studies are not one of them.
John, my favorite Eastern WA comparison to demonstrate UHI is the difference between a USHCN site, Spokane IAP (KGEG) and the USCRN site at Turnbull Natl Wildlife Refuge, approximately 14 miles to the south. KGEG has a thermometer at 2372′ elevation (Lat 47.621 – Lon 117.527) between two runways. Turnbull is at 2,270′ elevation (Lat 47.420 – Lon 117.530) and has the superior CRN siting criteria. This morning (2 Oct) at 0653 PDT KGEG reported a low of 47F. At 0645 PDT Turnbull CRN site reported a low of 30F. (An adjacent RAWS site also reported 30F.) One day last month I saw a difference of 20F for the morning low between Spokane airport and Turnbull. Unfortunately, our HCN will archive the runway temperature (really useful) and bury the CRN data.
OT: Boy, nothing like a major big-time backfire! Just love it, http://dailycaller.com/2015/10/02/congress-investigates-scientists-wanting-to-prosecute-global-warming-skeptics/?utm_source=twitterfeed&utm_medium=twitter
Did you catch the guy’s name in the pic? (Bastach), which is probably what they’re going to call him before he’s through.
Good to see that Congress is doing something like SLAPPing
the folks that want to misuse RICO.
On the other hand, maybe the emails they’re after are on Hillary’s server…
And as Berlin was a village 10 years ago, the effect on latest climate data is immense.
And the town will keep growing, until it is as big as Potsdam is!
You didn’t even notice that the very good post does NOT talk about recent INCREASE of Urban Heat Island but concentrated entirely on DEMONSTRATING the existence of the Urban Heat Island.
But then you’re not here to learn anything, only to defend the rotten corpse of the warmunist pseudoscience. What a weird way to spend ones life. Kind of a necrophiliac for bygone frauds?
” but concentrated entirely on DEMONSTRATING the existence of the Urban Heat Island.”
can you give examples of “warmists” denying an UHI effect?
UHI is real. The people fighting against the effect (for example in Stuttgart there is a big fight over keeping railways as a source of cool fresh air to the city centre) do beleive in global warming and UHI (of course!).
UHI is only relevant for climate discussions, if it is increasing over time and is a dominant reason for the global increase in surface temperature. Comparisons with rural stations suggest, that it might be not.
Potsdam is warmer due to the burning straw men.
I recently purchases a Netatmo Weather station. While waiting for it to be delivered I loaded the software, available at netatmo.com They had a great display and I quickly noticed the temperature map of the data provided by all of the Netatmo weather stations. It provides a display like above and should be very useful in showing the UHI effect. Since I have already installed my station I can not go back and give a step by step to explain how to get the map but it was very easy as I remember – I had no manual at the time and just used the provided demo – which gave real time data.
Try it you will like it – not affiliated with Netatmo in any way other than a satisfied owner.
Here is a link – https://www.netatmo.com/en-US/weathermap
Seems there may be a few factors involved. As you point out Pierre there’s the obvious broad scale UHI footprint, but also for individual stations with anomalous readings such as Potsdam, factors such as the positioning of the measuring device with respect to buildings, paved areas as well as proximity to heat emitting plant could also be at play.
University of Melbourne UHI research done a few years back, here, (the original paper has been “disappeared”) confirmed Melbourne to have a substantial UHI footprint. Berlin is larger than Melbourne and doubtless also has a substantial UHI footprint.
So, the question is which station or stations are the source of the
“official” temp for Berlin?
The DWD uses data from some 2000 weather stations scattered about the country to compute its statistics. I assume they all get fed in.
Like a sausage, you may not want to know what goes into it. 😉
Hello sod, glad you popped by. Gives me the opportunity to continue your confrontation with the reality of wind power.
Right now in the UK our 5500 turbines are producing 0.3GW towards a total demand of 32.5GW.
We would need 550,000 turbines to satisfy this demand.
This is here and now reality sod, and one you must face up to before you can make drive by facile childish comments such as the one above.
It gets better, Roger. Recent research shows that the 550,000 turbines needed to cover demand will not only slow each other down due to proximity in great numbers (and therefore, produce less energy), but they will slow down winds enough to change the regional climate.
sod doesn’t appear to have the intellect- or perhaps the Honesty- to acknowledge That, either.
“Recent research shows that the 550,000 turbines needed to cover demand”
The UK currently seems to have 6500 Turbines,
http://www.renewableuk.com/en/renewable-energy/wind-energy/uk-wind-energy-database/
producing about 10% of electricity demand.
https://en.wikipedia.org/wiki/Wind_power_in_the_United_Kingdom#2014
Your number seems to be off by a factor of about 10. On average, those 550000 would supply half the european union.
Problem is that the wind often doesn’t blow anywhere near as hard as it would need to. You could put 10 million turbines, but still get no power when the wind doesn’t blow.
Which part of current output 0.22GW Current demand 30GW do you not understand?
I am happy to accept your figure of 6500 turbines and to amend my observation that we would need 550000
turbines to 910000 to satisfy current demand.
We have a saying that a fool and his money is soon parted.
You are certainly a fool but unfortunately your stupidity and that of your green cronies is parting me from my money.
“Which part of current output 0.22GW Current demand 30GW do you not understand?”
The problem with that number is,. that you would not have posted it, if it was a high number. Do you want to make the same calculation for nuclear power in Japan today?
“to amend my observation that we would need 550000
turbines to 910000 to satisfy current demand.”
That number of wind turbines can provide enough power to supply the whole European union on average. And if we spread it out, it would also have much smaller percentages of minimal output.
Sit and watch, while wind power takes over.
“The UK currently seems to have 6500 Turbines,
producing about 10% of electricity demand.”
At a capacity factor of 20% 6500 turbines are just enough to replace 1 GW baseload – assuming that the 6500 turbines average out perfectly.
UK should have about 50 GW electricity demand, maybe more. Furthermore, about 6/7 of energy demand is non-electric.
I leave the multiplications to the interested reader.
“At a capacity factor of 20% 6500 turbines are just enough to replace 1 GW baseload ”
Your numbers are false. The percenatge is about 10% (a little less in 2014, more in 2015).
https://en.wikipedia.org/wiki/Wind_power_in_the_United_Kingdom#2014
you are just inventing numbers (in this case, your capacity factor) and then draw false conclusions from your false calculations.
“Furthermore, about 6/7 of energy demand is non-electric.”
This number is also completely false. It does not account for the simple fact, that electric power will replace other power sources (for example petrol on cars) on a much higher rate than 1 to 1.
You are doing completely false back of the envelop calculations: Start with the assumption, that we want to run on 100% wind. Base it on a low output day or on a low capacity factor. Invent a false replacement rate for non-electric energy. and end with a completely false number.
You are focusing on low numbers. basically you are lying to yourself, because you will only notice the number, when it is low.
In the real world, we have to add up the total of wind power produced over time, good winds and bad winds.
In Germany, we are already surpassing the total of last year (at the start of october!).
http://www.thelocal.de/20151001/wind-power-pushes-past-2014-total-by-september
so you might keep complaining about low wind days, while both the UK and Germany move from 10% to 20% and to 30% wind power share over the next two decades easily.
Well sod, in my real world I have used electricity every day during the month of September, which has been notable for it’s lack of wind and consequent abysmally low contribution from 5500 turbines over that time.
Sadly for your argument however, the electricity that I, along with 99 percent of the population used, came from reliable fossil fuel sources, because no amount of adding up previous wind power increased current supply.
Meanwhile UAH September is out at 0.25C, extending the pause yet again. With only October figure to come before Paris, even the strong El Nino is refusing to play ball.
Mutti Merkel may be stupid enough to build more turbines alongside her new lignite generation, but here in the UK our DECC exhibits signs of a measured, albeit slow return to sanity.
Yes, pretty quiet wind wise this month here in East Anglia, been useful for getting some outside jobs done. Euan has this graphic at his site showing percentage contributions from the various sources.
http://www.euanmearns.com/wp-content/uploads/2015/10/elecsep15pie.png
He acknowledges his data source being via http://www.gridwatch.templar.co.uk/ which is a quick handy reference for what is providing what.
“Mutti Merkel may be stupid enough to build more turbines alongside her new lignite generation, but here in the UK our DECC exhibits signs of a measured, albeit slow return to sanity.”
Merkel is on her way of becoming a statistic. Fast.
You are not going to get many more turbines approved in England under the current regime. It matters not a jot whether they contribute 10, 20 or 30%, what matters is how much they can provide on a continuous day to day, hour to hour basis. And furthermore, the immense cost of this and the ludicrously expensive energy they produce will severely hurt the poorer people in society. But then you and your ilk don’t care a damn about them.
“You are not going to get many more turbines approved in England under the current regime”
Let us see. There is currently a pretty bad backlash at wind and solar in many countries (UK, Australia, even Germany).
The reasons behind this is often protection for the power companies, which are in danger of banckrupcy. We will see, what will happen.
sod 3. October 2015 at 11:59 AM | Permalink | Reply
“so you might keep complaining about low wind days, while both the UK and Germany move from 10% to 20% and to 30% wind power share over the next two decades easily.”
That is completely meaningless as 6/7th of energy demand are non electric. The warmunist cultists have focussed on the smallest part of energy market and ignored the huge rest. Heating and transport.
This shows just HOW stupid AND malevolent they are.
Also, they will perish as minor nuisance while the ethnic wars in the EU break out through the repopulation of the nations by the treacherous governments with Pashtuns and Sunni Arabs who will want to install their caliphates.
Already now, all ultragreen regulations in Germany go straight out the window while the state turns nature protection biotopes into illegal immigrant accomodation.
The practical limit for wind power extraction is around 1 Watt/M^2 of land area in favourable locations. That limit applies no matter how large the turbines become. The other currently insurmountable problem is that no matter how many turbines you have, despite the “wind is always blowing somewhere myth” there are times when there will be no wind power generated over vast areas. The Australian eastern grid covers a vast area, from west of Adelaide in SA to north of Brisbane in Queensland and there are many instances each year when wind contributes essentially no power at all. With no affordable method available to store grid scale power (except in the few jurisdictions with suitable terrain where the Green lobby will allow pumped storage hydro) the only way to cover these becalming episodes is to balance the load with load following fossil fuel generation. This usually means running Diesel and OCGT both very inefficient methods for generating large blocks of power. Both Diesel and OCGT are also significant emitters of CO2, a problem for some, but more to the point Diesel is also a very significant emitter of “real” pollution i.e. NOx and particulates as a few VW owners are now discovering.
It is a bit funny to hear the meteorologist warn of frost at remote places, and at the same time explain how CO2 traps the heat.
Apparanty CO2 is not so good to trap heat.