Original article in German here
By Dr. Sebastian Lüning and Prof. Fritz Vahrenholt
(Translated/edited by P. Gosselin)
It’s the end of the year tally at the DWD German Weather Service for 2015. In a press release the DWD reported on December 30, 2015:
2015 second warmest year in Germany – tied with 2000 and 2007
2015 in Germany saw a mean temperature of 9.9°C, thus – after the preliminary analysis of measurements taken from some 2000 surface stations belonging to the DWD – it is the second warmest year on record since measurements began in 1881, tied with 2000 and 2007. The temperature record of 2014 stands by a wide margin at 10.3°C. Moreover the past 12 months were also drier and sunnier than normal, the DWD reports.
In 2015, 10 of 12 months were warmer than normal. Only September and October came in below the multi-year mean. August was the second warmest and November and December were even the record warmest ever since 1881. In July and August extreme heat dominated Germany, and the Franconian town of Kitzingen measured 40.3 °C , setting a new Germany record high.”
What a disappointment. We were already looking forward to a new annual record – and then came the blow. Only the silver medal, and that shared with two other years. Theoretically 2015 got only one third of a silver medal.
Back on September 21, 2015, German public television ntv held out hope:
According to scientists 2015 could be the warmest year on record worldwide since measurements began 135 years ago. Also Germany could break a record. So far in the country 2014 has been the warmest, said the chairperson of the German meteorological Society (DMG), Gudrun Rosenhagen at the 10th German Climate Conference in Hamburg. And this year is well on the way to break the record.”
What a pity, Frau Rosenhagen. By the way we are still waiting for an answer to our question sent to the DMG (see “Answer requested: Is the solar trend in the statement released by the German Meteorological Society correct?“). In its press release the DWD claims that in 2015 ten of twelve months were warmer than the mean. We assume this is in comparison to the now obsolete and ancient 1961 to 1990 reference period. When using the more up-to-date 1981 to 2010 reference period, the number of warmer than normal months likely drops.
It also remains a mystery how Germany’s year 2000 managed to reach 2nd place. It was a rained out summer and public swimming pools saw very few swimmers. [The following video shows ARD television asking whatever had happened to the summer amid cold rainy weather]:
Thanks to Klima Manifest Heiligenroth
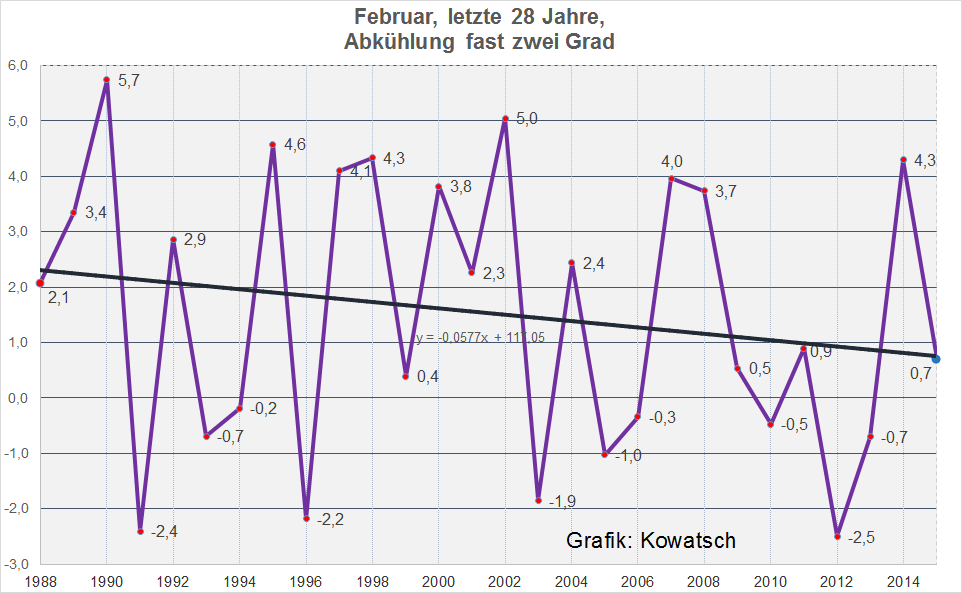
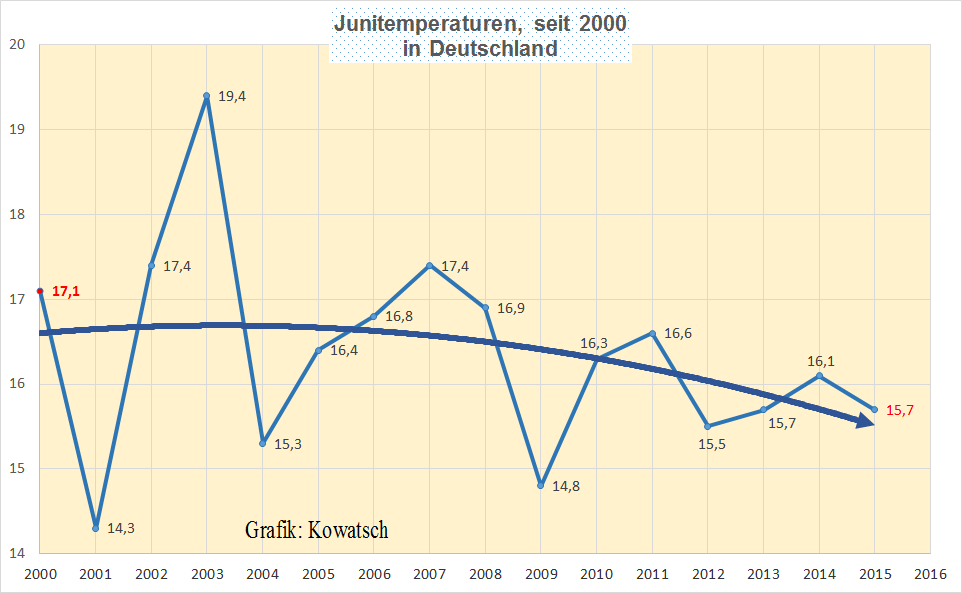
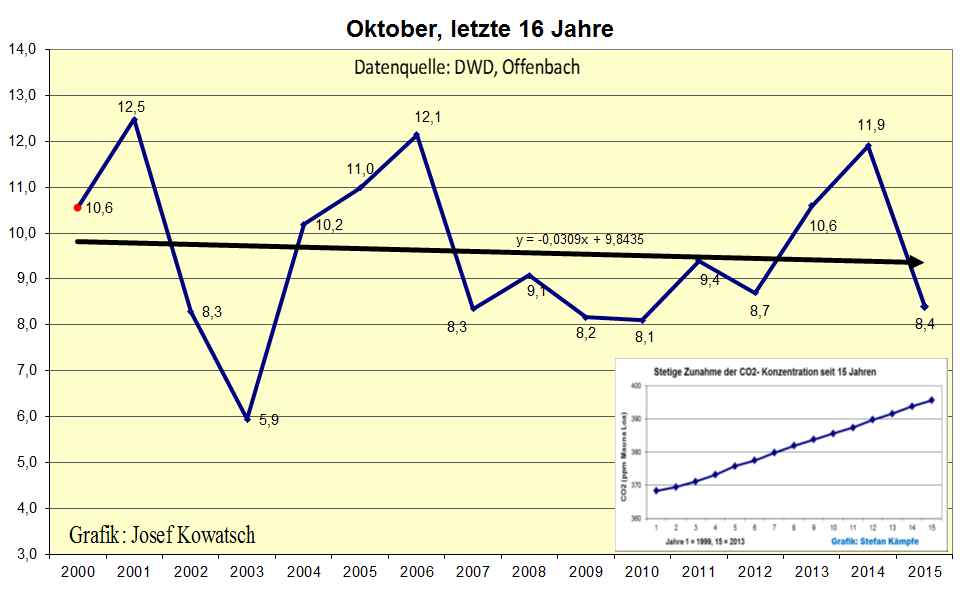
The DWD forgets to mention that over the past 15 years there has been no warming whatsoever. What follows are a number monthly mean temperature plots going back over the recent past. For whatever reason, what the DWD refuses to make public, is made public thanks to Josef Kowatsch. What follows are three examples of the development of monthly mean temperatures in Germany – based on the DWD’s own original data.
February Germany temperature plot since 1988:

July Germany mean temperature plot since 2000:

October mean temperature plot, last 16 years:

No global record
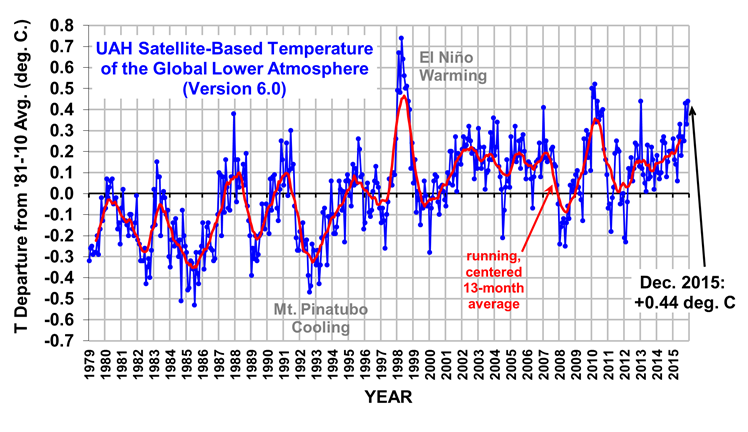
Also the global temperature failed to set a new record in 2015. The UAH measured figures show an extended global temperature pause. 2015 came in only in third place, as NASA satellite expert Roy Spencer of the University of Alabama in Huntsville documents here.
This makes 2015 the third warmest year globally (+0.27°C) in the satellite record (since 1979), well behind 1998 (+0.48 deg C) and 2010 (+0.34 deg. C).
That’s quite lousy for an El Niño year, which in mid 2015 the year was regarded as a candidate for a world record. Somehow the wind behind 2015 must have disappeared in the second half.

Temperature trend as to satellite measurements. Figure: Roy Spencer, UAH.
Moreover surface station datasets GISS and HadCRUT are in crisis. Over the past years they have interfered multiple times with the datasets and carried out a number of highly dubious corrections that make little sense. The data are now highly questionable, and alleged records are suspicious. Here there has to be and there will be consequences.


So second hottest year on record is the new cooling then? At least you can plot a “cooling trend” a whole year back!
The graphs in this post are just horrible. Cherry pick the month and cherry pick the start year and a different one for every month. This is an approach that is plain out nonsense.
And then let us add linear or polynomial trend lines to increase the non existing effect.
Dezember was the hottest dezember in both UAH and RSS records, and the real el nino effect in satellite data tends to show up in the year AFTER the start of the el nino.
http://davidappell.blogspot.de/2016/01/ted-cruz-your-18-years-of-no-satellite.html
The surface datasets are fine and confirm, what the people at the swimming pools could have told you in summer already (and the skiing resorts can by now). the year 2015 was incredibly hot.
sod, did IPCC not warn us of 0.2°C warming per decade? Where is this warming? Maybe you can help me out on this.
“sod, did IPCC not warn us of 0.2°C warming per decade?”
GISS, last 10 years:
http://www.woodfortrees.org/plot/gistemp/last:120/plot/gistemp/last:120/trend
0.17°C per decade. Pretty close?
Sorry, sod, we are not interested in your Kool-Aid.
https://stevengoddard.wordpress.com/2014/06/23/noaanasa-dramatically-altered-us-temperatures-after-the-year-2000/
You’ll have to ascend to the mother ship without us.
Virtually all the “warming” is due to tampered data. The global warming books have been cooked. It’s Enron on steroids.
HOT OFF THE PRESSES!
More nails for the AGW coffin? Or a stake through it’s heart?
“Sorry, sod, we are not interested in your Kool-Aid.”
UAH also gives 0.18°C per decade over the last 10 years.
http://www.woodfortrees.org/plot/uah/last:120/plot/uah/last:120/trend
Oh, and when looking at RSS, I simply reduce the time to 8 years and get 0.20°C per decade.
http://www.woodfortrees.org/plot/rss/last:96/plot/rss/last:96/trend
yonason wrote:
“Virtually all the “warming” is due to tampered data….”
Like in all experimental work, the raw data are adjusted to correct for biases.
Yonason, are you familar with the need for this in determining temperatures? If not, I will be happy to suggest reading material for you, such as:
“Understanding adjustments to temperature data”
http://judithcurry.com/2014/07/07/understanding-adjustments-to-temperature-data/
“Berkeley Earth: raw versus adjusted temperature data”
http://judithcurry.com/2015/02/09/berkeley-earth-raw-versus-adjusted-temperature-data/
“Understanding Time of Observation Bias”
http://judithcurry.com/2015/02/22/understanding-time-of-observation-bias/
Sebastian Luening wrote:
“sod, did IPCC not warn us of 0.2°C warming per decade? Where is this warming? Maybe you can help me out on this.”
Sebastian, I am happy to help you out.
Since 1970 the rate of surface warming according to HadCRUT4 is +0.17 C/decade.
If you have other questions, let me know. Thanks.
data:
http://www.metoffice.gov.uk/hadobs/hadcrut4/
Sebastian:
GISS, last 30 years: +0.17 C/decade.
data:
http://data.giss.nasa.gov/gistemp/tabledata_v3/GLB.Ts+dSST.txt
Well you are in the Freiburg area, I was working in Mannheim this year, not far away. 3 or 4 weeks were pretty warm but nothing unusual for the Rhine valley. So, I think you might be a new arrival from Vladivostok?
Also, this year we got another confirmation for the total incapability of climate science to predict an El Nino strength right. And, as the saying goes, the atmosphere is a continuation of the ocean with other means; the top 3 m of ocean contain as much heat energy as the entire atmosphere. You can’t predict an El Nino? Well then you sure can’t predict the atmosphere.
Total failure for warmunism, it would be exciting if it would not be always the same.
“Dezember was the hottest dezember in both UAH and RSS records”
Well normally I would say, you are uninformed, but in your case, let’s just say: Why do you think we can’t catch your lies?
http://woodfortrees.org/plot/rss
Why do you think lying helps you or warmunism? And why do you keep defending a falsified theory with obvious lies? WHAT’S WRONG WITH YOU?
Ah, the hottest DECEMBER. Sorry. Now that might be. But it’s meaningless. What meaning has it whether an El Nino peaks in December or November, pray tell?
Sorry, the notion was so foreign to me I just didn’t notice that you put such an emphasis on December.
Because. You know, El Nino happens at the equator.
Not where I live in the UK, it wasn’t.
You can always find a new record. If you don’t get a global one, try looking for a national one.
If you can’t find a global or national one, try looking for a European one.
If you cant find a global/national/European one, try looking just in the Eurozone nations.
If you can’t find one in global/national/European/Eurozone data, try looking in December. Maybe on a Wednesday afternoon.
When Barcelona are playing away from home.
Seek for a record, and you can always find one, even if it is utterly meaningless.
You’re making the mistake of looking at your own experience or cherry picked news stories and extrapolating it to the whole globe.
You have to remember that if there is a heatwave in mainland Europe, say, other areas will be correspondingly cooler – possibly even areas of ocean.
The North Atlantic has been very cold all last year.
2015 was not a hot year in the UK, a record number of snow patches survived in Scotland, and outdoor courgettes/tomatoes etc. all but completely failed in my southern England garden.
The Central England Temperature was an unremarkable ~25th ‘warmest’, much more than half a degree C colder than 2014 and ‘only’ average for the last 20 years, despite the unusual persistence of warm southerly air (but not unprecedented in absolute warmth) in Nov/Dec – the December Max. record was not broken.
And despite a spurious spike at a contaminated Heathrow weather site being claimed as a July record, the month as a whole was still colder than the long term average.
Antarctica has never warmed in the Satellite record and is as cold as the early 80s.
Although the Arctic has warmed during the satellite record, it hasn’t warmed for many years now, and looks no warmer than the early 80’s, and the ice looks like it has stopped declining, but only time will tell.
The southern hemisphere (Australia etc.) also had a cold winter.
North America had a ferociously cold winter.
So if you opened your eyes a bit more to contrary evidence, you might appreciate that it is indeed remarkable that there is no evidence of global warming, just the continuing hiatus, which looks more and more like the beginnings of a cooling trend.
Once the warmth from the El Nino has worked it’s way through the system in 2016, this cooling will become more and more obvious year by year.
Of course the other problem for AGW believers is that before adjustment, it’s no hotter now than c.1940 anyway. The significant warming up to ~1940 and similar cooling up to ~1980 has been disappeared. The surface data is now completely politicised/corrupt and unfit for scientific use.
MrGrimNasty wrote:
“You have to remember that if there is a heatwave in mainland Europe, say, other areas will be correspondingly cooler – possibly even areas of ocean.”
This is a poor understanding of physics. The heat capacity of the ocean is about 1,000 times that of the atmosphere.
So “large” changes in the atmosphere will barely be noticed in the ocean heat content.
This is why ocean heat content is by far the best metric of global warming that we have.
ENSO and the AMO happen without adequate explanations, as near as I can tell. Various studies indicate these atmospheric and ocean events have been happening for a very long time. There is historical evidence of glacier advance and subsequent melting back in many mountain valleys, again, for a very long time. Did a little extra CO2 in the atmosphere cause all these things? I don’t think so.
Then episodes happen (think the 1976-77 climate shift of the Pacific Ocean). After the fact, a sequence of events with numbers attached can be found to “explain” such shifts. But an explanation it is not.
Point being, I don’t much care if one year or a dozen show slight warming or cooling. There are no explanations but there are lots of ideas.
~~~~~~~~~
Pierre,
A year or two ago you had a post on the writing of the Kyoto Protocol and the German Greens. I was going to post a link to that on the WUWT post “Who unleashed Climatism?” by Ari Halperin. That post is 3 or 4 down but it still might be a useful addition to that. Thanks, John.
Here there has to be and there will be consequences.
Like promotion and then retirement on comfortable inflation-proofed pensions?
It would be nice if one day, some people argueing about pause or no pause, printed their graphs with ERROR BARS.
Without them, no one can make any judgement about whether you are atlking complete tosh. Or not, as the case may be.
“It would be nice if one day, some people argueing about pause or no pause, printed their graphs with ERROR BARS.”
Will not happen, because the sceptic point of view will completely disappear if they do that.
I wasted the time to add the 16 oktober data points (rounded to full integers) into this tool:
http://vassarstats.net/corr_stats.html
r
r2
Slope
Y
Intercept
Std. Err. of
Estimate
-0.112
0.013
-0.046
9.9044
1.9862
t
df
-0.423
14
P one-tailed
0.3393
two-tailed
0.6786
0.95 and 0.99 Confidence Intervals of rho
Lower Limit
Upper Limit
0.95
-0.575
0.406
0.99
-0.678
0.538
sorry, format doesn t work well.
r² = 0.013 horrible.
And the confidence intervals (0.95)
are huge.
-0.575
0.406
sod, what is the optimal absolute average long year mean temperature of the globe? Not in anomaly to 1960-1990, but as a temperature.
You are a warmunist, you must know. Tell us.
By the way, the “18-yr” claims are about to end:
http://davidappell.blogspot.com/2016/01/ted-cruz-your-18-years-of-no-satellite.html
“Are about to”? A prophet you are now?
http://woodfortrees.org/plot/rss
Past performance is no guarantee for future results.
David, what is the optimal absolute average long year mean temperature of the globe? Not in anomaly to 1960-1990, but as a temperature.
You are a warmunist, you must know. Tell us.
In a saner world, confessions of tortured data would be inadmissible.
Here’s where the dangerous “warming” really comes from, btw.
But maybe it really isn’t bad data. Maybe it’s just misunderstood, and with the proper “guidance” . . . .
“No New Record Heat In 2015 – Despite Help From Strong El Niño.”
Care to explain why surface temperatures for this El Nino were 0.2-0.25 C warmer than in 1997-98, despite it being of comparable size?
It was warmer than the 1998 El Nino yet it produced less of a spike in UAH and RSS? Well you explain THAT to us, you’re the ex part time science journalist.
Unlike the simple example of positive feedback we learned in high school, the increase from every round of feedback gets smaller and smaller, in the case of the enhanced greenhouse effect. It is a significant factor in the overall warming, but it does NOT lead to a “runaway” trajectory for temperature.