By Ed Caryl
There have been several reports of temperature data fudging by the authorities, the most recent by Paul Homewood on several stations in Paraguay.
While exploring long temperature records in Australia, I discovered a particularly egregious example of temperature changing at Adelaide Airport. GISS now offers easy access to their several sets of data for each station: unadjusted (I assume this is the raw data.), adjusted (I assume this is after TOBs, time of observation, and moving adjustments), adjusted after cleaning (whatever that is), and the final step, after adjustments, cleaning, and homogenization.
Infusion of more error?
Homogenization is supposed to correct for urban heat island problems, but it is nearly always used to cool the past, rather than cooling the present or heating the past, the opposite of what an urban heat island correction should be. But I digress.
Here is the Adelaide Airport record before any adjustments:

Figure 1: Adelaide Airport unadjusted temperature record. The top trace is the annual average summer (December, January, and February) temperatures, the middle is the annual average meteorological year, and the bottom is the average winter (June, July, and August) temperatures, all with trend lines. On all these images, click on the image for a high resolution version.
Note in Figure 1 that all the trends are negative, that is, it has been cooling since the turn of the twentieth century, for over the last 100 years, particularly in the summer months. The warmest year was 1914. The warmest summer was in 1880!
Now let us look at the “adjusted” data:
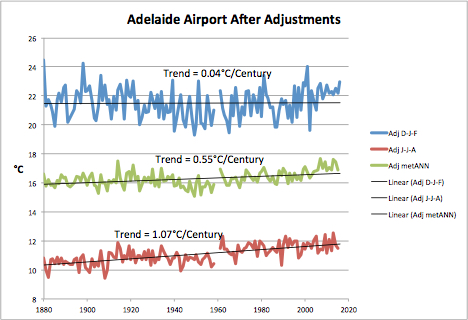
Figure 2: Adelaide Airport after “adjustment”, also with trend lines.
Note that in Figure 2 we see warming, annually, and in all seasons. The warmest year is now 2007, though the warmest summer is still 1880 by a small fraction of degree. But the strange thing about this adjustment is this:

Figure 3: Adjustment applied to Figure 1 to produce Figure 2.
Note that from 1880 to 1947, the adjustment is exactly minus one degree, in all months, all seasons, and all years. It is a blanket, obvious, fudge! Someone got lazy. Instead of attempting to figure out an actual time of observation or move adjustment, they simply slapped on a minus one degree change, and magically, the cooling trend went away. But they were not finished! There is still homogenization to be performed, the finishing touch!
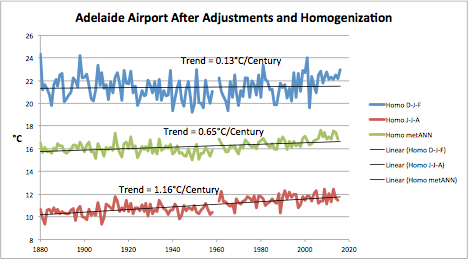
Figure 4: Adelaide Airport after all adjustments and homogenization.
Homogenization now adds another tenth of a degree to the warming temperature trends. How much was the change?
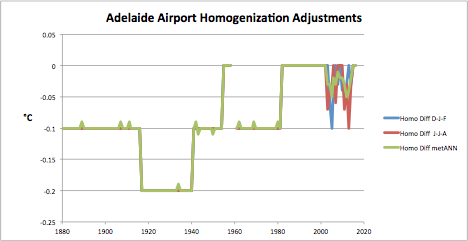
Figure 5: Homogenization adjustment applied to Figure 2 to result in Figure 4.
These changes further cool the past and mostly leave the present unchanged. The changes are the same for all months, season, and years for twenty or more year stretches.
I found the Australian BOM description for their adjustments for Adelaide. They do not resemble the adjustments seen above. They are changes to Tmax and Tmin, are in both positive and negative directions. Changes to Tmax + Tmin sometimes nearly cancel out. (If Tmax is adjusted up and Tmin is adjusted down by the same amount, Tmean will not change.) And the steps are in different years from that above.

Figure 6: Screen grab from an Australian BOM pdf document found here. Click on the image for a clearer version.
Hiding the cooling
It should be obvious to all that these adjustments to the raw temperature data are an attempt to hide the long-term cooling temperature trend at Adelaide. These changes to the temperature data begs us to examine all station data for similar changes. Is global warming real or just a product of pencil, pen, and computer?


I just looked the Australian BOM website, and under “climate data online” looked at the length of temperature records for brisbane, where I live. Of the several stations listed within 100km or so of the brisbane BCD, Amberley goes back to 1942, but the rest are only 10 to 15 years in length. Not much help! What’s going on???
Ed:
Adelaide has had 2 airports. The first at Parafield north of the City. It was wide open plains, very dry in summer (and hotter than the City). The only business nearby was the abattoirs. It remained in use for light aircraft for many years after most traffic switched to West Beach, with increasing housing and industrial development until it was almost surrounded.
The current airport at West Beach started operating in the mid-1950’s (1955 from memory). It is west of the city and not far from the beach on Gulf St. Vincent. Planes normally take off to the SW, over the bordering road (since moved closer to the beach as runway lengthened) then over open sports fields for about a kilometre, then the sea. The Gulf is fairly shallow (max. 20-22 metres) and around 90 kilometres at that point.
Adelaide get a lot of its wind from the SW, S or SE (about 70% or more) which comes from the Southern Ocean, hence cooling. These are very evident at this airport, which is open to them. Also the S & N sides of the airport used to have golf courses, watered by discharge from the nearby sewerage works.
So it isn’t surprising that there should be a cooling from before 1955 to after. Since around 1980 there has been a lot of development on the airport lands (warehousing, shopping centres, hotels, newer terminal with multi-story car parking etc.) so some warming is possible, or the adjustments might have been pulled out of a hat (or thin air).
This points to a cost-efficient way of stopping Global Warming. Instead of squandering 28 billion Euros a year on subsidies for wind oligarch cronies, the German government could simply bribe some small bureaucrat at the DWD to rewrite the past so that the 2 deg warming goal is never surpassed. Just write him a check of 20 million, one time.
Similarly, the USA could simply write a check to Gavin Schmidt instead of pumping 1.2 billion USD a year into NASA for “climate research” which they doubtlessly mostly use for money laundering by investing in run down Vancouver properties.
I am more and more convinced that “homogenisation” was invented to give them a reason for the mal-adjustment of temperatures to suit their requirements.
Great article Ed.
Any chance of posting the hyperlinks to the GISS dataset that you used?
Clever lot us Aussies. We had an airport in the 19th Century?
Ed – those tables of adjustments you have shown are from the BoM highly adjusted and warmed ACORN SAT data. IMHO better to check what adjustments GISS have carried out against raw data from the BoM Climate Data Online
http://www.bom.gov.au/climate/data/
“Homogenization is supposed to correct for urban heat island problems, but it is nearly always used to cool the past, rather than cooling the present or heating the past, the opposite of what an urban heat island correction should be.”
If one wants to investigate temperature trends, I agree with you. However, any such “climate” data sets ought to be isolated from regular meteorological uses.
Insofar as these sets of numbers are not isolated it makes sense to not fiddle with the contemporary temperatures. Such algorithms can be run in real time, but a pilot waiting in line to roll down the runway does not want an urban-heat-island adjusted temperature. She wants the air temperature above the runway. And that is what I expect to hear on the local weather report.
Adding to the ‘homogenisation/adjusting’ debate here are three graphs for Adelaide from GISS showing the changes in just the past few years.
Note the huge adjustments from the ‘raw’ data and version 4.
The first is the ‘raw data (version 1/2).
http://data.giss.nasa.gov/cgi-bin/gistemp/show_station.cgi?id=501946720004&dt=1&ds=1
The second is version 4.
http://data.giss.nasa.gov/cgi-bin/gistemp/show_station.cgi?id=501946720000&dt=1&ds=14
Now we have version 5
http://data.giss.nasa.gov/cgi-bin/gistemp/stdata_show.cgi?id=501946720000&dt=1&ds=5
Note the downward adjustments prior to 1980 noted on the graph.
Hope this helps.
And another version (v3).
http://data.giss.nasa.gov/cgi-bin/gistemp/show_station.cgi?id=501946720000&dt=1&ds=12
Note the position of 1914 in this version compared to v4.
Thanks for rescuing my earlier comment –
I have found some aminations I have online from almost 2 years ago showing 4 Australian sites where GISS has inserted warming compared to versions several years ago.
Alice Springs
Adelaide
Broken Hill
Willis Island
http://www.warwickhughes.com/blog/?p=2948
I posted this in 2006 – “How NASA GISS inserts warming into USA rural T data”
http://www.warwickhughes.com/blog/?p=27
– quoting emails from Dr Jim Hansen about GISS adjusting Florida rurals to make them fit urban trends – Arcadia and Everglades – he could provide no good reason why – but the adjustments stood. These huge organizations do what they like.
As you can see here, the first GISS graph up to 2009 shows only 2005 above +0.6C anomaly.
http://www.realclimate.org/images/Hansen09_fig1.jpg
Here is the latest GISS graph (2014). Note the increase in temps between 1998-2009 and the decrease in temps around 1910.
http://data.giss.nasa.gov/gistemp/graphs_v3/Fig.A2.gif
Whereas 2009 was below both 2005 and 1998, it now is the hottest of that decade.
‘These changes to the temperature data begs us to examine all station data’. You said, all, Ed. May I suggest an ambitious project? Try to find out what stations among the thousands removed from the official data bases at the end of the former century, are still on duty. I know that the Dutch KNMI is among them. Their work is certainly not low-quality. Can we recover their temperature records and make an alternative data base to be compared with the official results?
Mindert
I believe only De Bilt is used for Holland.
Here is v1 data
http://data.giss.nasa.gov/cgi-bin/gistemp/show_station.cgi?id=633062600003&dt=1&ds=1
Here is v5 data
http://data.giss.nasa.gov/cgi-bin/gistemp/stdata_show.cgi?id=633062600000&ds=5
You can find the number and list of stations here. There has been a reduction since 1990.
http://data.giss.nasa.gov/gistemp/station_data/
Do they have a station history for De Bilt, and a picture of its location?
Number at the very end of station identifier is different.
Nothing to do with surface data can be taken as reality until you at least see the station history and its current location/environment.
Can’t find any history except that there would have been a change to an AWS probably in the last 20 years.
Best I can find at the moment is
http://weather.gladstonefamily.net/site/EHDB
and this
http://berkeleyearth.lbl.gov/stations/
Maybe someone who lives around there has the answers.
[…] Source: NASA “Homogenization” Infusing MORE Error? Adelaide Airport: Cooling Turns Into Warming […]
[…] Ed Caryl at Germany’s NoTricksZone has discovered that the long-term cooling trend at Adelaide Airport has been “adjusted” into a […]