Meteorologist Joe Bastardi at Twitter posted a chart from Scripps Oceanography Institute, which does put out some excellent work despite a fair amount climate science activism from a few of its scientists.
According to the Weatherbell meteorologist, Scripps has forecast a La Niña under -2.0 over five consecutive month, as the following chart shows:
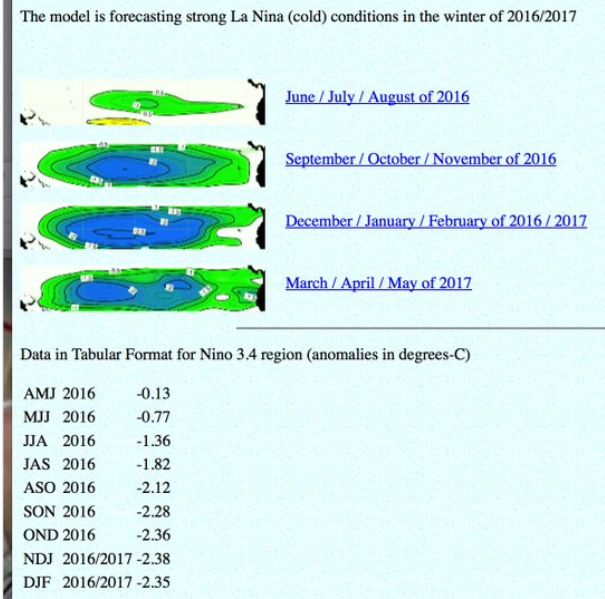
While it’s still questionable that the La Niña will arrive already this summer, there is rapidly diminishing doubt that it will be hitting the globe hard by wintertime. Joe adds:
The implication of the SCRIPPS forecast with the ONI is it would more than counter the recent strong el nino, over a multi year period”
The Australian Bureau of Meteorology writes here (April 26, 2016):
Eastern tropical Pacific sea surface temperatures have cooled significantly in the past fortnight, and are now approaching neutral levels. As temperatures under the surface are below average, more surface water cooling is expected. However the atmosphere is only slowly responding to these changes, and hence the Southern Oscillation Index (SOI) and cloudiness near the Date Line continue to fluctuate around El Niño thresholds.
Six of eight international climate models suggest the tropical Pacific Ocean will return to neutral levels within the next month. By September, seven of eight models suggest La Niña thresholds are likely. However, individual model outlooks show a large spread between neutral and La Niña scenarios.”
The following chart from Wikipedia gives an overview of all La Niña events occurring since 1900.

Source: Wikipedia here.
Note how in the above figure a lack of La Niña events persisted from 1976 to 1998, a time that saw the globe warm some 0.6°C. Since 1998 the frequency of La Niña events has increased with global temperatures remaining flat. Back in the early to mid 1970s, a time of frequent La Niña events, much of the media warned of a coming little ice age. For example in 1974 German Spiegel news magazine warned that the chances of warming were less than 1 in 10,000! A number of scientists sounded the ice age alarms, blaming it in part on sinful human activity.
By 1986, with La Niña events having been absent close to 10 years, Spiegel flipped and began its spectacular warnings of global warming, showing a semi-submerged Cologne Cathedral on the cover of a 1986 magazine. by 1988, James Hansen was before Congress prophesizing the end of the world.
Significant midterm climate cooling in the pipeline?
The oncoming La Niña in combination with weakened solar activity and a flip towards the cool phase by the Atlantic Multidecadal Oscillation (AMO) may soon be all working in tandem to set up months of global cooling ahead, which means a likely resumption in the overall global warming pause over the latter part of the current decade.
Global temperature over the years ahead will hinge in part on how frequently La Niña events occur.


[…] Full post […]
Despite the fact that the US and other governments were involved in determining what would happen with global cooling; despite the fact that scientists were quoted by name concerning global cooling; despite the fact that news media world-wide reported on all of the above, sod should be along any moment now to deride it as ‘one article in Newsweek (or Time Magazine).’
ClimateOtter:
sod could well change his name to that of the famous australian bird, the drongo. It is noted for its clear call for coming rain, days after the event.
Here’s a chart of El Nino’s/La Nina’s since 1950.
http://www.esrl.noaa.gov/psd/enso/mei/
Couple things to note:
1) La Nina conditions were stronger during the “cooler period” worldwide from about 1954 – 1976ish…as would be expected. It also needs to be noted….there was a LOT more Arctic ice sheet back then. A LOT MORE. That is now going quickly.
2) Even with La Nina conditions in (a) late 1980’s (b) 1998 – 2001, and (c) couple of mild ones from 2008 – 2001……the following happened:
A) Temperatures worldwide continued to rise
B) Arctic ice sheet CONTINUED TO DWINDLE
C) Ocean temperatures continued to rise
For those who want to think there has not been rising temperatures over the last 85 years….how does ignore the reality of what has actually happened?
Inquiring minds want to know….
Good day chaps….:)
“.there was a LOT more Arctic ice sheet back then. A LOT MORE. That is now going quickly.”
You mean, like, within 6 months. Then it regrows, another 6 months. Yeah I think I get that.
“You mean, like, within 6 months. Then it regrows, another 6 months. Yeah I think I get that.”
No. I mean with as years go by….less and less ice is left to “regrow” each year. This past winter was the lowest MAXIMUM (winter season) on record. And this summer/fall (September) will be yet another NEW RECORD LOW MINIMUM.
Right now….the ice extent is over 1,000,000 square kilometers LESS THAN IN 2012 for this date (the last record low minimum year).
http://climatechangegraphs.blogspot.com/2012/08/arctic-sea-ice-volume-extent-charts_30.html
So while the fossil fuel companies continue to try and keep their business models alive at ALL COSTS….the ice continues to melt….glaciers continue to melt…and the oceans continue to warm and rise.
Good day mate…:)
“For those who want to think there has not been rising temperatures over the last 85 years….how does ignore the reality of what has actually happened?
Inquiring minds want to know….”
We look at photos. Of the North Pole. From 1958. Taken by submariners. Who took them. While disembarking from their submarine.
https://wattsupwiththat.com/2009/04/26/ice-at-the-north-pole-in-1958-not-so-thick/
It’s no longer certain that surfacing was in March, it’s been relabeled as an August photo, and still is, and I agree.
That occurred right before I posted notes about how much light was available, see that post and some comments about redating things at
https://wattsupwiththat.com/2012/03/17/submarines-in-the-winter-twilight/#comment-927001
It appears that the photographer on the USS Skate didn’t keep great records. I used to “waste” a frame of film on a piece of paper with the date and time on it for things I know I’d otherwise loose track of.
Thanks for the info, Ric!
> For those who want to think there has not been rising temperatures over the last 85 years
Most of the folks here think that temperatures have risen over the last 85 years. Well, maybe since 1900 (or 1800 like one of 97% consensus figures is based 50% on that). Since 2000, not much warming until this El Nino and it will likely drop back down to the doldrums or cooling after that.
Why did you pick 85 years? The 1930s was a very confused decade, meteorologically speaking….
“there was a LOT more Arctic ice sheet back then”
Yu mean around 1800, Yeah there was.. it was called the Little Ice Age
http://s19.postimg.org/fj69ahgoj/Iceland_Sea_Ice.jpg
But before that there was a lot LESS than now, in fact biodata shows that during the first 3/4 or more of the current interglacial, there was most often ZERO summer sea ice.
We are NOWHERE NEAR that at present.
A) Temperatures worldwide continued to rise ..
WRONG… Apart from El Nino events, there has been NO WARMING in the satellite era.
B) Arctic ice sheet CONTINUED TO DWINDLE…
Still recovering from LIA. A long way to go until we get zero summer sea ice that was the norm for most of the Holocene.
C) Ocean temperatures continued to rise..
Ocean temps are dropping. We only have real data since 2003.. and its been basically level in the raw ARGO data.
Any ocean temperature rise before 2003 was based purely on models and is inadmissible as evidence.
addendum
Ocean temps are dropping since the El Nino peak.
ONLY the sea surface temps….but nice try.
NO, the undercurrents are cold too, especially along the El Nino channel. That COLD water is coming from below.
https://wobleibtdieglobaleerwaermung.files.wordpress.com/2016/04/ensounterwasserlanina14042016-e1460742810388.jpg
Wrong again
Buddy, just in case you don’t have the intelligence to work it out…
…your base-level ignorance is based on propaganda lies and mis-information.
You really do need to be far less GULLIBLE.
How much sea was there in 1950? Do not forget a source.
It will be interesting to watch the combination of a cool Pacific and Atlantic, PDO and AMO, combined with very low solar activity, on global temperatures. A big northern hemisphere volcanic eruption would probably be the frosting on the cake.
I’m still waiting for a major eruption of the Hekla volcano on Iceland. As the proverb says, a watched pot never boils. Let’s not pay too much attention to this hellish monster.
I always love how people point to the Arctic ice decline and yet ignore the other end of the world – Antarctica.
Sea ice in Antarctica has been increasing in area and compensates for the change in Arctic ice.
Warm ocean currents entering the Arctic ocean are funneled through relatively narrow passages by the arrangement of the continents – no wonder the Arctic ice is subject to more warming – it is continuously being undermined by warm water which is concentrated in “narrow channels”.
But imagine if that water is reduced in temperature by even a degree or so as appears likely due to the AMO!
Besides all of that it takes a long time to heat something as large as Earth and it takes a longer time for gases with their significantly reduced radiating power compared to solids or liquids to cool the Earth.
Remember radiation does not heat our atmosphere – contact and convection do.
Climate scientists always tell us 99% of the atmosphere doesn’t absorb IR yet it still gets bloody hot where I live.
In should be noted that the Scripps forecast is the coldest of 25 models presented in the weekly updates here:
http://www.cpc.ncep.noaa.gov/products/analysis_monitoring/lanina/enso_evolution-status-fcsts-web.pdf
The average is about -1°C.