According to the IPCC (2013), global sea levels rose by less than two-tenths of a meter (0.19 m) between 1901 and 2010. Considering the scientific record of long-term sea level trends from locations across the globe, this small <0.2 m change in sea levels over the course of the last 110 years does not even fall outside the range of natural variability.
Sea levels have commonly risen and fallen at amplitudes much greater than two-tenths of a meter. As Harris et al. (2015) confirm, “relative sea-level variations of ∼1 m were common throughout the Holocene.”
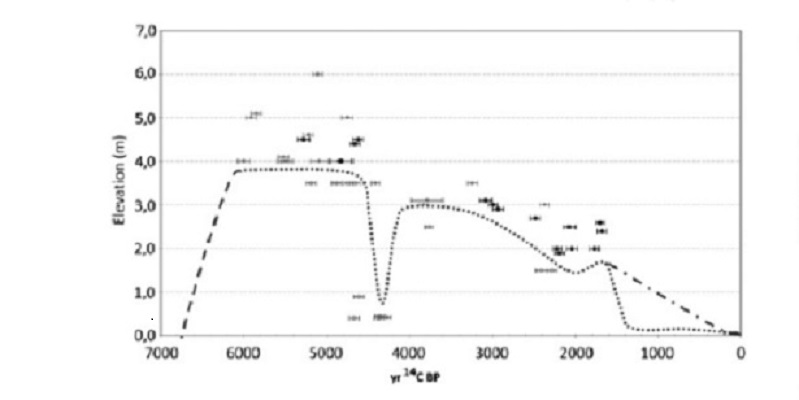
For example, consider Bracco et al. (2014). These scientists found that sea levels along the coasts of South America were a full 4 meters higher than they are now between 5,500 and 6,000 years ago. Then, over the course of just a 400-year time span (between 4,700 -4,300 years ago), sea levels dropped by a full 3 meters (to +1 meter above today’s levels), then rose by 2 meters (to +3 meters above today’s levels), and then fell to current levels after 4,300 years ago. Here’s what these long-term sea-level oscillations look like graphed (Fig. 5):
These rapid variations in sea levels pose critical explanatory problems for advocates of the AGW (anthropogenic global warming) supposition that human CO2 emissions, and not internal Earth-system dynamics, are what drive sea level changes. Specifically, AGW advocates presume that rising CO2 concentrations cause sea levels to rise (and lowering CO2 concentrations cause sea levels to fall). A large volume of rapidly accumulating scientific evidence not only does not support this CO2-rise-causes-sea-level-rise supposition, it suggests that a long-term inverse correlation could just as easily be formulated: As CO2 rises, sea levels decline.
To illustrate this, consider the Bracco et al. (2014) graph above depicting meters-per-century variations in sea levels with the corresponding CO2 concentration recorded for each period. Notice that the highstand period (5,000 to 6,000 years ago) had lower concentrations of CO2 than the following millennia that subsequently had higher CO2 concentrations. Also, consider that there was no significant change in CO2 levels during the 400 years of rapid sea level changes. Finally, notice that the last 200 years of sea level changes (if there have been any) are undetectable on this scale at this location even though CO2 concentrations were rising from 280 ppm to 400 ppm during this period.
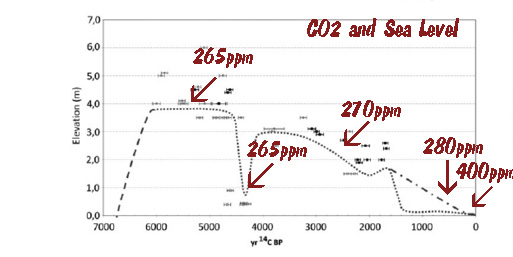
And this isn’t just true for the coasts of South America. In the peer-reviewed scientific literature, a non-correlation — or inverse correlation — for CO2 and sea level (as CO2 rises, sea levels fall) has been reported by scientists for dozens of locations across the globe just in the last few years alone. Graphs (with CO2 ppm concentrations, text, and arrows added) for a few other locations are shown below.
Prieto et al., 2016 (Argentina, Uruguay)
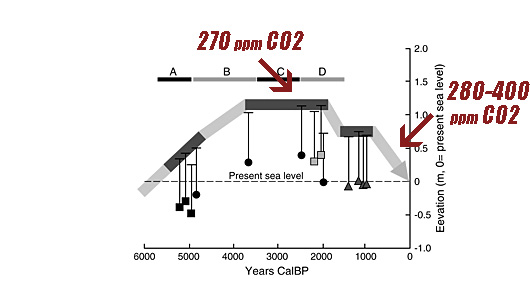
Dura et al., 2016 (Vancouver Island)
Kench et al., 2014 (central Pacific Ocean)
But not only is the CO2-rise-causes-sea-level-rise AGW supposition dubious, so is the entire paradigm of an alarming and catastrophic human-caused sea-level rise future.
Consider Bangladesh. According to Rashid et al. (2013), the mean sea level was “at least 4.5 to 5 m higher” 6,000 years ago than it is today. At that time, CO2 levels ranged close to 265 ppm, or 135 ppm lower than today’s 400 ppm. Not only that, but for the last 1,500 years, there has been no noticeable difference in the shoreline near Bangladesh — despite the rapidly rising CO2 levels during this period.
—
Rashid et al., 2013 (Bangladesh)
“[T]he highest RSL [relative sea level] transgression in Bangladesh at approximately 6000 cal BP, being at least 4.5 to 5 m higher than the modern m.s.l. [mean sea level] After this phase, the relative sea level started to fall, and consequently, a freshwater peat developed at approximately 5980–5700 cal BP. The abundant mangrove pollens in the salt-marsh succession shows the regression at approximately 5500 cal BP, when it was 1–2 m higher than the modern sea level. The curve indicates that at approximately 5000 cal BP and onwards, the RSL started to fall towards its present position, and the present shoreline of Bangladesh was established at approximately 1500 cal BP and has not noticeably migrated inland since.”
—
It was recently pointed out that there are 4 newly published papers confirming that natural variability largely explains recent sea level fluctuations, not anthropogenic CO2 emissions. Scientists also continue to publish papers (about 30 are compiled here) that indicate relative sea levels across the globe were often meters higher than they are now as recently as a few thousand years ago . . . when CO2 concentrations were much lower and anthropogenic CO2 emissions were non-existent.
In sum, scientists are increasingly finding that is difficult to even detect an anthropogenic signal in the noise of strong natural sea level variability spanning decades to millennia. So at what point did it become “settled science” or “basic physics” that raising or lowering CO2 concentrations cause sea levels to rise or fall?
—
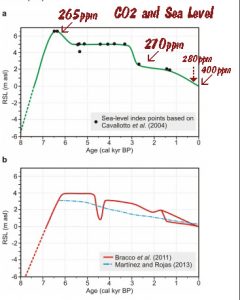
Prieto et al., 2016 (Argentina, Uruguay)
“Analysis of the RSL [relative sea level] database revealed that the RSL [relative sea level] rose to reach the present level at or before c. 7000 cal yr BP, with the peak of the sea-level highstand c. +4 m [above present] between c. 6000 and 5500 cal yr BP (depending on the statistical method used) or at c. 7000 cal yr BP according to the ICE-6G model prediction, gradually falling after this time to the present position … Particularly for the Río de la Plata (RDP), a Holocene RSL curve was presented by Cavallotto et al. (2004) based on 14 uncalibrated 14C ages from selected samples from the southwestern coast of the RDP (Argentina). This RSL curve was re-plotted by Gyllencreutz et al. (2010) using the same index points and qualitative approach but using the calibrated ages. It shows rising sea-levels following the Last Glacial Termination (LGT), reaching a RSL [relative sea level] maximum of +6.5 m above present at c. 6500 cal yr BP, followed by a stepped regressive trend towards the present (Fig. 2a).”
—
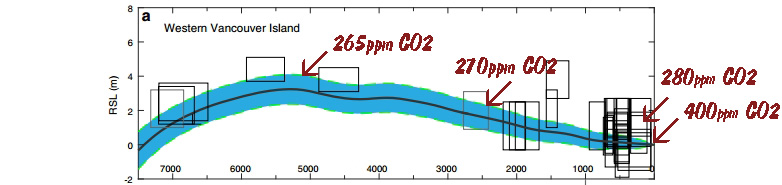
Dura et al., 2016 (Vancouver Island)
“In northern and western Sumatra, GIA models predict high rates (>5 mm/year) of RSL [relative sea level] rise from ∼12 to ∼7 ka, followed by slowing rates of rise (<1 mm/year) to an RSL [relative sea level] highstand of <1 m (northern Sumatra) and ∼3 m (western Sumatra) between 6 and 3 ka [6,000-3,000 years ago], and then gradual (<1 mm/ year) RSL fall until present (Fig. 7a, b).”
—
Sander et al., 2016 (Denmark)
“Results: The data shows a period of RSL[relative sea level] highstand at c. 2.2 m above present MSL [mean sea level] between c. 5.0 and 4.0 ka BP [5,000 to 4,000 years before present] .After that, RSL drops by c. 1.3 m between c. 4.0 and 3.4 ka BP to an elevation roughly 1 m above present MSL. Since then, RSL has been falling at more or less even rates.”
—
Lee et al., 2016 (Southeast Australia)
“The configuration suggests surface inundation of the upper sediments by marine water during the mid-Holocene (c. 2–8 kyr BP), when sea level was 1–2 m above today’s level.”
—
Yokoyama et al., 2016 (Japan)
“The Holocene-high-stand (HHS) inferred from oyster fossils (Saccostrea echinata and Saccostrea malaboensis) is 2.7 m [above present sea level] at ca. 3500 years ago, after which sea level gradually fell to present level.”
—
Long et al., 2016 (Scotland)
“RSL [relative sea level] data from Loch Eriboll and the Wick River Valley show that RSL [relative sea level] was <1 m above present for several thousand years during the mid and late Holocene before it fell to present.”
—
May et al., 2016 (Western Australia)
“Beach ridge evolution over a millennial time scale is also indicated by the landward rise of the sequence possibly corresponding to the mid-Holocene sea-level highstand of WA [Western Australia] of at least 1-2 m above present mean sea level.”
—
Haghani et al., 2016 (Caspian Sea)
“Caspian Sea (CS) water level has fluctuated repeatedly with an amplitude of larger than 25m during the Holocene without any link with the eustatic sea level. …. The data from the Langarud sequence indicate that the CSL [Caspian Sea level] rose to at least −21.44m during that time (i.e. >6m higher than at present), as Langarud was probably not on the shore itself but was affected by distal brackish water flooding. This result is in line with historical findings about the CSL high-stand during the 14th and the early 15th centuries. … This massive brackish water invasion would have caused a serious disruption to food supply to Persia.”
—
Chiba et al., 2016 (Japan)
Highlights
“We reconstruct Holocene paleoenvironmental changes and sea levels by diatom analysis. Average rates of sea-level rise and fall are estimated during the Holocene. Relative sea level during Holocene highstand reached 1.9 m [higher than today] during 6400–6500 cal yr BP [calendar years before present].”
—
Leonard et al., 2016 (Great Barrier Reef)
Holocene sea level instability in the southern Great Barrier Reef, Australia
“RSL [relative sea level] stabilised ~0.2 m above present levels by 900 yr BP. While the mechanism of the RSL instability is still uncertain, the alignment with previously reported RSL oscillations, rapid global climate changes and mid-Holocene reef “turn-off” on the GBR are discussed.”
—
Clement et al., 2016 (New Zealand)
“In North Island locations the early-Holocene sea-level highstand was quite pronounced, with RSL [relative sea level] up to 2.75 m higher than present. In the South Island the onset of highstand conditions was later, with the first attainment of PMSL being between 7000–6400 cal yr BP. In the mid-Holocene the northern North Island experienced the largest sea-level highstand, with RSL up to 3.00 m higher than present.”
—
Zondervan, 2016 (Great Barrier Reef)
“Complete in-situ fossil coral heads have been found on beach rock of One Tree Island, a small cay in the Capricorn Group on the Great Barrier Reef. Measurements against the present low-tide mark provide a [Holocene] high stand of at least +2.85 m [above present sea levels] … Although the late Holocene high stand has been debated in the past (e.g. Belperio 1979, Thom et al. 1968), more evidence now supports a sea level high stand of at least + 1- 2 m relative to present sea levels (Baker & Haworth 1997, 2000, Collins et al. 2006, Larcombe et al. 1995, Lewis et al. 2008, Sloss et al. 2007).”
—
Mann et al., 2016 (Indonesia/Strait of Makassar)
“Radiometrically calibrated ages from emergent fossil microatolls on Pulau Panambungan indicate a relative sea-level highstand not exceeding 0.5 m above present at ca. 5600 cal. yr BP“
—
Wündsch et al., 2016 (South Africa)
“Compared to the present, mostly drier conditions and a greater marine influence due to a higher sea level are inferred for the period between 4210 and 2710 cal BP [calendar years before present].”
—
Engel et al., 2015 (Western Australia)
“The foredunes overlie upper beach deposits located up to >2 m above the present upper beach level and provide evidence for a higher mid-Holocene RSL [relative sea level].”
—
Lewis et al., 2015 (Northeastern Australia)
“[D]ata show a Holocene sea-level highstand of 1–2 m higher than present which extended from ca. 7500 to 2000 yr ago (Woodroffe, 2003; Sloss et al., 2007; Lewis et al., 2013). The hydro-isostatic adjustment is thought to account for these 1–2 m sea-level changes to present levels over the past 2000 yr (Lambeck and Nakada, 1990; Lambeck, 2002).”
—
Lokier et al., 2015 (Persian Gulf)
“Mid-Holocene transgression of the Gulf surpassed today’s sea level by 7100–6890 cal yr BP, attaining a highstand of > 1 m above current sea level shortly after 5290–4570 cal yr BP before falling back to current levels by 1440–1170 cal yr BP.”
—
Hein et al., 2015 (Brazil)
“In southern Brazil, falling RSL [relative sea level] following a 2–4 m [above present sea level] highstand at 5 to 6 ka [5,000 to 6,000 years ago] forced coastal progradation.”
—
Reinink-Smith, 2015 (Kuwait)
“In northeastern Kuwait …. a [sea level] highstand at ~ 5000–3500 cal yr BP [before present]. The berms are presently at ~ + 6 m above sea level, 2–3 m above the beach ridges. Human settlements were common on the ridge crests before and after the highstand [~6 m above present levels]. Regression to present-day sea level commenced after the highstand, which is when the sabkha began forming.”
—
Macreadie et al., 2015 (southeast Australia)
“[R]esults from other studies … suggest that high-stand, at perhaps 2 m above present msl [mean sea level] was achieved as early as 7000 radiocarbon years BP (7800 cal. years BP) and that sea-level has exceeded the present value for much of the mid- to late-Holocene.”
—
Bracco et al., 2014 (Uruguay/South America)
Highlights:
“Sea level reached 4 m amsl [above mean sea level today] between 6000 and 5500 yr BP [before present]. A rapid sea level fall to about 1 m amsl [above mean sea level today] was inferred for 4700-4300 yr BP. A further sea level increase to about 3 m amsl [above mean sea level today] was inferred after 4300 yr BP. After 4300 yr BP there was a constant sea level a decline.”
—
Kench et al., 2014 (central Pacific Ocean)
“[T]he mid-Holocene [sea level] highstand is reported to have peaked at approximately +1.1 m above present and was sustained until approximately 2000 years B.P. in the Marshall Islands (Figure 4).”
—
Strachan et al., 2014 (South Africa)
“The mid-Holocene highstands culminated in a sea-level maximum of approximately 3 m above mean sea level (MSL) from 7300 to 6500 cal years BP and of 2 m above MSL at around 4000 cal years BP. Thereafter, RSL dropped to slightly below the present level between 3500 and 2800 cal years BP13 Sea-level fluctuations during the late Holocene in southern Africa were relatively small (1-2 m); however, these fluctuations had a major impact on past coastal environments. Evidence from the west coast suggests that there was a highstand of 0.5 m above MSL from 1500 to 1300 cal years BP or possibly earlier (1800 cal years BP), followed by a lowstand (-0.5 m above MSL) from 700 to 400 cal years BP.”
—
Rashid et al., 2014 (equatorial Pacific Ocean)
“Upon correction for isostatic island subsidence, we find that local relative sea level was at least ~1.5±0.4 m higher than present at ~5,400 years ago.”
—
Yamano et al., 2014 (New Caledonia, Southwest Pacific Ocean)
“Mba Island initially formed around ~ 4500 cal yr B.P., when sea level was ~ 1.1 m higher than at present.”
—
Eisenhauer et al., 2013 (French Polynesia)
“In between 5.4 and 2 ka [5,400 – 2,000 years ago] minimum sealeveloscillated between 1.5 and 2 m for ~3 ka [3,000 years] but then declined to the present position after ~2 ka BP [2,000 years before present]. Based on statistical arguments on the coral age distribution HSLM is constrained to an interval of 3.5×0.8 ka. Former studies being in general accord with our data show that sea level in French Polynesia was ~1 m higher than present between 5,000 and 1,250 yrs BP and that a highstand was reached between 2,000 and 1,500 yrs BP (Pirazzoli and Montaggioni, 1988) and persisted until 1,200 yrs BP in the Tuamotu Archipelago“
—
Lewis et al., 2013 (Australia)
“[M]ost studies now recognise that sea levels around most parts of mainland Australia in the mid-Holocene reached between 1 and 2 m above present levels (e.g. Baker and Haworth, 2000a; Baker et al., 2005; Sloss et al., 2007; Lewis et al., 2008; Perry and Smithers, 2011), studies purporting a higher level between 2 and 3 m cannot be discounted entirely (e.g. Hopley 1971, 1975, 1978, 1980; Searle and Woods, 1986; Woodroffe, 2009).”
—
Stattegger et al., 2013 (South Vietnam)
“[T]he last phase of deglacial sea-level rise from −5 to +1.4 m [occurred] between 8.1 to 6.4 ka [8,100 to 6,400 years ago]. The rates of sea-level rise decreased sharply after the rapid early Holocene rise and stabilized at a rate of 4.5 mm/year between 8.0 and 6.9 ka.[8,000-6,900 years ago]. Southeast Vietnam beachrocks reveal that the mid-Holocene sea-level highstand slightly above +1.4 m [above present] was reached between 6.7 and 5.0 ka, with a peak value close to +1.5 m around 6.0 ka.”
—
YanTao et al., 2013 (South China)
“Using 1 m below the tidal datum as the upper limit of coral growth, the elevations of these dead corals predict a mid-Holocene sea level 1.5–3.4 m higher than the present level.”


Holocene sea level details can be found here: https://notrickszone.com/2014/05/05/data-show-holocene-sea-levels-trending-downwards-2-meters-higher-4000-and-8000-years-ago/#sthash.eoE1NpNG.dpbs
Unless those papers used differential GPS to correct for local land motion, none of them mean anything. Sea level at Juneau Alaska is falling almost 10mm/year thanks to plate tectonics. The correct average is ~+2.2mm/year, a value that also closes.
“The correct average is ~+2.2mm/year, a value that also closes.”
What year has been selected as the starting point for the 2.2 mm/yr value? Due to 60-year oscillations, the trend must be at least of that length to establish a presumptive “correct” average. Also, the “correct” average should not combine tide gauge data with satellite alimetry (i.e., modeled) data.
And it is wholly true that sea level changes are local/regional, not global.
Beenstock et al., 2015
http://link.springer.com/article/10.1007/s10651-014-0293-4
“[W]e find that sea levels rose in 7 % of tide gauge locations and fell in 4 % [between 1807-2010]. The global mean increase is 0.39–1.03 mm/year.”
1900-2015 from about 40 long running tide gauges with diff GPS correction within 10km. Moerner gets essentially the same value, ~2.1mm/yr. Closure depends on the time frame for ice mass loss and thermosteric rise. Use post 2005 ARGO and GRACE with the 2013 diff GPS Antarctica GIS correction. Closure 2.3, close enough considering the uncertainties.
I am glad it is mentioned that land masses may also sink. Warmists automatically assume any report of higher sea levels, magically implies both a geological dead planet with tectonic plates that can never move downwards, and that villainous carbon molecule wrecking havoc on the world.
Disagree with above. As a geologist I and my colleagues recognize constant global rises and falls in sealevel over very short even human lifetime periods which we can’t explain precisely. Tectonics doesn’t explain all. Maybe icecaps are semipermanent and wax and wane without leaving a global signature. I see enough evidence of the little ice age expanse in my Rocky Mountain hikes to know serious changes only have local signs.
The point all these articles make is that sea levels are subject strongly to planetary level forces other than A-CO2. However A-CO2 could still be the CURRENT driver. If A then B, if B not necessarily A reasoning. But the alarmists need to make today Special to get the impetus for action they feel necessary – and to justify their sense of imperial righteousness.
The geologic record shows either the land or water going up and down without obvious reasons. Of course we can always come up with A reason. But THE reason? No. But a global warming and melting from A-CO2 WILl make that relative change happen. But A-C02 is not a unique solution. The conflict lies in the alarmists refusing to accept that inconvenient truth.
“However A-CO2 could still be the CURRENT driver.”
Please define “current.” What year did the driver of sea level changes switch from internal Earth-Sun-Ocean system dynamics to parts per million (0.000001) changes in atmospheric CO2 concentrations? And please specifically identify how CO2 can be, or is, a predominant driver of fluctuations in deep ocean heat.
The SEAFRAME network in Pacific has sensors for land movements, but does not yet show any acceleration or even much trend in sea level rise.
https://rclutz.wordpress.com/2016/05/05/cutting-edge-sea-level-data/