According to the most highly-cited estimate of recent (1992 – 2011) polar ice sheet melt rates, the land ice on Greenland and Antarctica has been contributing to sea level rise at a rate of 0.59 mm/year in the modern era, which means the equivalent of 5.9 centimeters (2.3 inches) per century of sea level rise might eventually accrue if the polar ice sheets continue melting at current rates for the next 10 decades.
Since 1992 [through 2011], the polar ice sheets [Antarctica and Greenland] have contributed, on average, 0.59 ± 0.20 millimeter year−1 to the rate of global sea-level rise.
Of course, a sea level rise rate contribution from Greenland and Antarctica that amounts to a little more than 2 inches per century is not particularly alarming. And when observed sea level rise contribution rates from melting ice sheets don’t elicit the headlining attention they deserve, it’s time to promulgate climate modeling catastrophes that might occur at some point in the distant future.
For example, earlier this year Slate‘s resident meteorologist Eric Holthaus excitedly embraced the James Hansen ice-melt catastrophe paper (Hansen et al., 2016) as a welcome tenet of a supposedly authoritative scientific canon: “James Hansen’s Bombshell Warning Is Now Part of the Scientific Canon”.
The paper, which has undergone some wording revisions since the original version appeared in July, 2015, apparently “concludes” that the polar ice sheets will soon melt catastrophically, and that this ice sheet melt contribution will in turn result in sea level rise of “at least 10 feet in as little as 50 years“.
Eric Holthaus, Slate:
“The study—written by James Hansen, NASA’s former lead climate scientist, and 16 co-authors, many of whom are ered among the top in their fields—concludes that glaciers in Greenland and Antarctica will melt 10 times faster than previous consensus estimates, resulting in sea level rise of at least 10 feet in as little as 50 years.“
Again, the combined Greenland and Antarctica ice sheet melt contribution to sea level rise was 0.59 mm/year during 1992 – 2011 (Shepherd et al., 2012), or about 6 cm (2.3 inches) per century. To achieve James Hansen’s claimed sea level rise prediction of 10 feet (3.05 meters) within 50 years due to rapidly melting Greenland and Antarctica ice sheets, the current melt rates would have to increase by a factor of 100. Instead of the polar ice sheet contribution rate of 0.23 of an inch per decade for 1992-2011, the rate in the next 50 years will need to average 23 inches per decade — two orders of magnitude more than presently observed.
And for the record, the observed melt-rate contribution from the Greenland and Antarctic ice sheets of 0.59 mm/yr for 1992 – 2011 is very likely an overestimate. For one, NASA has reported that there was an overall ice mass gain for Antarctica during this same period (1992-2008), and thus a reduction in sea level rise equivalent to -0.23 mm/yr (rather than a net positive contribution of +0.19 mm/yr as determined by Shepherd et al., 2011). Secondly, in current datasets the baseline period for establishing the surface mass balance (SMB) of the Greenland ice sheet is the 1961-1990 tricade. However, those 30 years were notoriously cold in Greenland, a full 1.5 degrees C colder than the 1920-1940s period, when Greenland was actually as warm or warmer than recent decades. If the baseline data were not centered on the coldest decades of the century, but instead included the 1920s-1940s warm period, the record of net “loss” for the Greenland ice sheet since the 1990s would be significantly reduced, and there may have been an overall net mass gain relative to the 1920s-’40s for recent decades. Succinctly, different baseline data would yield an even more negligible Greenland ice sheet contribution to sea level rise for 1992-2011 than reported by Shepherd et al., 2011 (0.4 mm/yr, or 1.6 inches per century).
Considering Paleoclimate Data, Sea Level Rise Projections Of Even 1 Meter Per Century Are ‘Sheer Nonsense’, ‘Demagoguery’
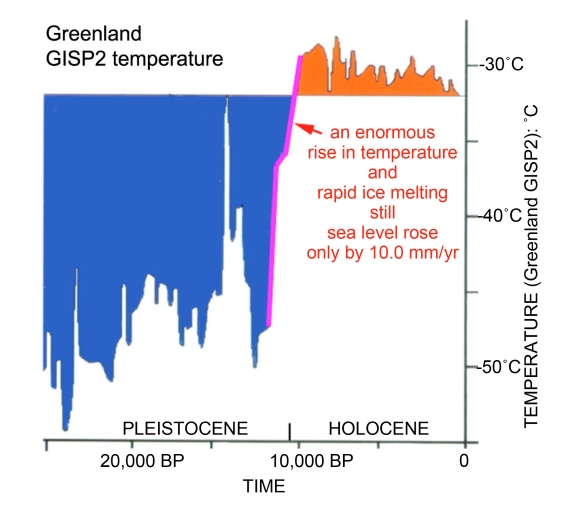
World-renown scientist Dr. Nils-Axel Mörner, a sea level expert who has authored hundreds of peer-reviewed scientific publication during his career, has recently weighed in on the preposterousness of claiming sea levels will rise even 1 meter in the next 100 years — let alone over 3 meters in the next 50, as James Hansen claims. Using past records of sea level rise rates from the earliest decades and centuries of the Holocene (~11,000 years ago), Mörner concludes that it is not possible for modern sea levels to rise at rates of 10 mm/year (1 meter/century) — or faster than they did during a time when much of the Northern Hemisphere was still buried kilometers-deep in ice and temperatures were rising far more rapidly than today.
Sea level is globally varying between ±0.0 and +1.0 mm/yr (0.5 ± 0.5 mm/yr). … At 11,000 BP we had enormous amounts of ice still left in the huge continental ice caps of the Last Ice Age. In Canada, the ice front was in St. Lawrence lowland, and in Scandinavia, the ice margin was at Stockholm. At the warming pulse ending the Pleistocene and starting the Holocene, ice melted at an exceptionally strong forcing. Today, there is neither ice nor climate forcing that in any way can be compared to what happened 11,000 – 10,000 BP. The conclusion is obvious; we can never in present time have any ice melting and sea level rise as strong- and certainly not stronger-than that occurring at the Pleistocene/Holocene transition. Therefore, a rate of sea level rise of +10.0 mm/yr or 1.0 m per century can be held as the absolutely ultimate value of any present day sea level rise. Any present rise in sea level must be far below this value to be realistic in view of past records and the physical factors controlling ice melting. Therefore, we can also dismiss any claim of sea level rise exceeding 1 m in the next century as sheer nonsense and unfounded demagoguery.
Sea Levels Currently Rising Between 0 – 1 mm/yr; Modeled ‘Corrections’ To Sea Level Rise Data Artificially And Erroneously Raise Rates
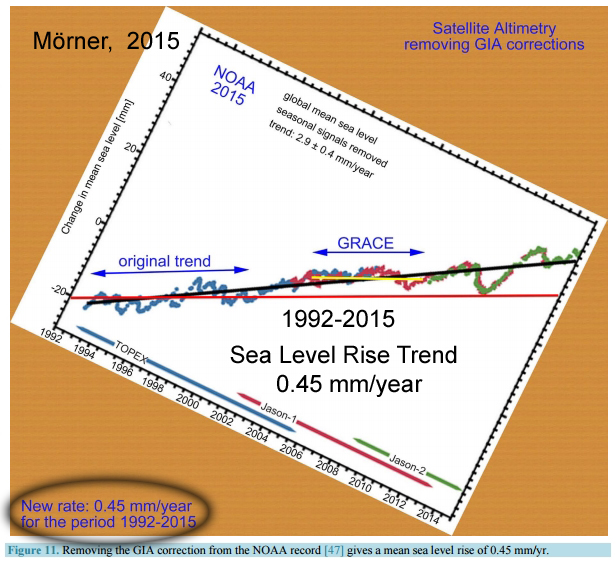
A year ago, Dr. Mörner detailed his comprehensive critique of the alterations to observed data (euphemistically referred to as “corrections”). He determined that if the “corrections” (i.e., modeled adjustments that artificially raise sea levels) for the satellite data are removed, sea levels only rose at a rate of 0.45 mm/year (2 inches per century) between 1992-2015, which is about 1/7th of the rate of rise reported by altimetry datasets.
The satellite altimetry records are claimed to be “a proxy for ocean water volume changes”, but behind the curves are unspecified “corrections” hidden, applied by NOAA and CU in order to obtain the product they personally assumed to be the correct “proxy of ocean water volume changes”. There is a major problem, however: their satellite altimetry records differ by 100% to 800% from observed tide gauge measurements. With the removal of GIA corrections … from the satellite altimetry data, we finally obtain agreements among global tide gauge data, costal morphology data and satellite altimetry data; all agreeing on a mean global eustatic sea level factor somewhere within the zone ±0.0 to +1.0 mm/yr.
The mean of 182 sites (excluding a few outliers) scattered all over the globe is 1.6 mm/ yr. Because of long-term subsidence of many river mouth sites and site-specific compaction problems, this value may, in fact, represent a slightly too high value. The key sites here discussed provide values of about 0.0 mm/yr, and the Kattegatt and North Sea records give firm values around 1.0 ± 0.1 mm/yr. This data set is in deep conflict with the high rates proposed by the IPCC and satellite altimetry. The differences in rates can only be understood in terms of errors and mistakes. The true mean global eustatic component is likely to be found in the zone ranging from +2.0 mm/yr to ±0.0 mm/yr, and most probably in the lower half of this zone; i.e. within 1.0 – 0.0 mm/yr. The error was found to be in the satellite altimetry values for reasons of incorrect “corrections”
The only data set which hangs far above the others is the IPCC predictions. Those data, however, refer to assumptions and model out-puts, and are, by no means, anchored in observational facts. … [I]t is high time to abandon the idea of global isostatic adjustment, and to stop all kinds of GIA corrections of records of sea level changes (i.e. satellite altimetry, GRACE, tide gauges, etc.).
The reported rates exceeding 3 mm/year are based on models instead of direct observational measurements. Echoing a 2015 paper from Beenstock et al., two more new papers (another by Mörner) indicate that observations (i.e., non-modeled, non-adjusted measurements from tide gauges from all over the world) of global sea level rise range somewhere between 0 and 1 mm/yr, or a few inches per century.
Using recently developed methods for nonstationary time series, we find that sea levels rose in 7 % of tide gauge locations and fell in 4 %. The global mean increase is 0.39–1.03 mm/year.
Observational facts recorded and controllable in the field tell a quite different story of actual sea-level rise than the ones based on model simulations, especially all those who try to endorse a preconceived scenario of disastrous flooding to come. “Poster sites” like Tuvalu, Vanuatu, and Kiribati in the Pacific have tide gauge stations indicating stable sea-level conditions over the last 20–30 years. The Maldives, Goa, Bangladesh, and several additional sites in the Indian Ocean provide firm field evidence of stable sea-level conditions over the last 40–50 years. Northeast Europe provides excellent opportunities to test regional eustasy, now firmly being set at +1.0 ± 0.1 mm/year. Other test areas like Venice, Guyana–Surinam, Qatar, and Perth provide a eustatic factor of ±0.0 mm/year. We now have a congruent picture of actual global sea-level changes, i.e., between ±0.0 to +1.0 mm/year. This implies little or no threat for future sea-level problems.
Tide gauges provide the most reliable measurements, and best data to assess the rate of change. We show as the naïve averaging of all the tide gauges included in the PSMSL surveys show “relative” rates of rise about +1.04 mm/year (570 tide gauges of any length). If we consider only 100 tide gauges with more than 80 years of recording the rise is only +0.25 mm/year. This naïve averaging has been stable and shows that the sea levels are slowly rising but not accelerating. …The satellite altimetry returns a noisy signal so that a +3.2 mm/year trend is only achieved by arbitrary “corrections”.
We conclude that if the sea levels are only oscillating about constant trends everywhere as suggested by the tide gauges, then the effects of climate change are negligible, and the local patterns may be used for local coastal planning without any need of purely speculative global trends based on emission scenarios.


My latest book, ‘Human Caused Global Warming, the Biggest Deception in History’.
Available on Amazon and Indigo/Chapters.
My SLAPP lawsuit to silence me comes to trial on Feb 20, 2017,
Dr Michael Mann vs Dr Tim Ball.
http://www.drtimball.com
Tim Ball is not a climate science expert, and this has been admitted in a court of law.
After the Calgary Herald published an op-ed by Ball on April 19, 2006, whom the newspaper identified as the first climatology PhD in Canada and a climatology professor at the University of Winnipeg for 28 years, they published a letter on April 23, 2006 from Dr. Dan Johnson, a professor at the University of Lethbridge, who pointed out that neither of those descriptions is true; that Dr. Ball’s credentials were being seriously overstated. Ball later threatened Johnson and the Herald and ultimately sued for defamation.
In their Statement of Defense filed in Court, the Calgary Herald submitted the following:
1. “…that the Plaintiff (Ball) never held a reputation in the scientific community as a noted climatologist and authority on global warming.
2. “The Plaintiff has never published any research in any peer-reviewed scientific journal which addressed the topic of human contributions to greenhouse gas emissions and global warming
3. “The Plaintiff has published no papers on climatology in academically recognized peer-reviewed scientific journals since his retirement as a Professor in 1996;
4. “The Plaintiff’s credentials and credibility as an expert on the issue of global warming have been repeatedly disparaged in the media; and
5. “The Plaintiff is viewed as a paid promoter of the agenda of the oil and gas industry rather than as a practicing scientist.”
Ball dropped his lawsuit.
Source: The Calgary Herald, Statement of Defense – paragraph 50, Dr Tim Ball v The Calgary Herald, In the Court of the Queen’s Bench of Alberta Judicial District of Calgary, Dec 7, 2006 (http://is.gd/brO4uO).
Behavioral statistics of Appell’s visit on 6 December at time AM. Article 3 New Papers: 3.43, 3,52, 3.59, 4.00, 4.01. Always check the former article when he comes by, or Trump’s Election: 4.08, 4.17, 4.20, 4.22, 4.23, 4.24, 4.26. The comment to Ball must have taken 4.01 – 4.00 or less than one minute.
Can’t refute what I wrong. Just as I suspected.
David Appell on Dr. Tim Ball:
————————————–
https://davidappell.blogspot.com/2014/11/court-filing-tim-ball-not-authority-on.html
“[H]e’s so frustrated that he’s nothing more than a mosquito in the scientific world, that no one who matters takes him seriously, that he’s on the verge of giving up, so he finally went full Nazi and pulled the ultimate pin.”
“Well, penultimate. The only comparison left is to Satan.”
————————————–
THat’s right Kenneth, thanks for quoting that.
You got any substantial reply??
1.. That’s why he is trustworthy. He sees the scam.
2.. That’s because all the warming comes from natural causes. How do you expect him to publish papers on something that doesn’t exist, unless he runs falsified models, of course.
3. Irrelevant. He still knows far more that most of the “climate scientists™” who’s only claim is failed models.
4. Absolutely irrelevant!… and also a big plus for his honesty. They only attack those they can’t argue against.. its the far-left way.
5. Viewed by whom? Irrelevant again.
Seem all you have is your usual irrelevant garbage..
And the “opinion” of the Calgary Herald… roflmao.
.. so funny to see Appell’s absolute desperation.
ZERO proof as always.
I’ve heard him speak, and I’ve read the crap you write.
I’ll take what he says over your garbage any day of the week.
yonason: Your agreement with Ball says nothing about his credentials, as they were submitted to court of law.
Tim Ball is a climate nobody, and was throughout his career.
My comment of 7.04 AM is still in moderation, Pierre, whereas it is factual only. In addition I should remark that mister A. usually works from bottom to top during his visits here. If you would pay a visit to Amsterdam you may wonder why in many corners of buildings there is a skewed aluminum plate fixed at a height of one meter. That’s not for decoration but an effective device making that if males urinate there, the result flows against their legs and into their shoes. Try to get a digital version for your site.
Good luck, Tim.
As a lawyer myself I know how nerve shredding it can be having to rely on judges.
In the end they usually get it right but that doesn’t make the process any easier 🙂
Good luck Dr Ball.
On sea level changes I have pointed out to AGW advocate who bluster on about this nonsense, if sea level are truly rising at an accelerating rate sure all harbors, quays, ports, piers, jetties etc would show evidence of this. People with beach-front businesses and property would have noticed it in the last 30 years or so.
Also of note is that every navy in the world would be demanding funding to refit and modernize with protective structures their shipyard, etc.
No. None of this is happening because seaman around the world do not see any acceleration in sea level rise.
“Two of the longest continuous Australian tide gauge records are from Fremantle in Western Australia (92 years) and Fort Denison in New South Wales (83 years) indicate that the observed rate of sea-level rise relative to the land has been 1.38 mm/yr and 0.86 mm/yr respectively (see DPIWE 2004).”
http://soer.justice.tas.gov.au/2009/copy/84/index.php
http://www.sealevel.info/avgslr.html
Synopsis: Sea-level is not rising everywhere. The measured rate of coastal sea-level change varies from -17.59 mm/yr at Skagway, Alaska to +9.39 mm/yr at Kushiro, Japan. The average, as measured by the world’s best long-term coastal tide gauges, is just under +1.5 mm/yr (about 6 inches per century).
Satellite altimetry
Some sources quote much higher rates, sometimes as high as 3.3 mm/yr (13 inches per century), based on satellite altimetry measurements of sea-level, rather than coastal sea-level measured by tide gauges. That is a mistake. Most fundamentally, satellite altimeters measure the wrong thing. Their measurements are distorted by “sea-level rise” caused by thermal expansion when the upper layer of the ocean warms. But that is a strictly local effect, that doesn’t affect the quantity of water in the oceans, and doesn’t affect sea-level elsewhere (e.g., at the coasts).
Sea-level rise only matters at the coasts, but satellite altimeters are incapable of measuring sea-level at the coasts. They can only measure sea-level in the open ocean. Tide gauges measure sea-level at the coasts, where it matters. Also, tide gauge measurements of sea-level are much higher quality than satellite altimetry measurements. The satellite measurements of sea-level are of questionable reliability, and vary considerably from one satellite to another. Also, some of the tide-gauge records of sea-level measurements are nearly ten times as long as the combined satellite measurement record, and twenty times as long as any single satellite measurement record.
Tide Gauges
NOAA has done linear regression analysis on sea-level measurements (relative sea-level) from 225 long term tide gauges around the world, which have data spanning at least 50 years. (Note: the literature indicates that at least 50-60 years of data are required to determine a robust long term sea-level trend from a tide gauge record.) It is important to realize that there’s been no sign of any acceleration (increase in rate) in most of those tide-gauge records, in over three-quarters of a century.
The rate of measured sea-level rise (SLR) varies from -17.59 mm/yr at Skagway, Alaska, to +9.39 mm/yr at Kushiro, Japan. 197 of 225 stations (87.6%) have recorded less than 3.3 mm/yr sea-level rise. At 47 of 225 stations (20.9%) sea level is falling, rather than rising. Just 28 of 225 stations (12.4%) have recorded more than 3.3 mm/yr sea-level rise. The average SLR at those 225 gauges is +0.90 mm/yr. The median is +1.41 mm/yr.
Thank you Kenneth,
The often quoted line from the AGW advocates is “about 6 inches per century” hence my comment about 30 years living by the sea.
In my experience, the AGW advocates don’t acknowledge “6 inches per century.” They use feet, or meters, not inches. Sounds a lot scarier.
kilometers? 🙂
a) Al Gore said: “20 foot very soon”. It will take 12,000 years for 20 feet at a rate of 2″/century. Not very soon at all. I don’t think I ever heard a climate alarmist refute Al Gore. That was the red flag that got me started as a skeptic:- their ban against refuting any alarmism at all; even the comically extreme. Such a ban shouts out: “we’re here for the politics”. I never needed Tim Ball to tell me that.
b) They hate Tim Ball more than anyone else, and accuse him of writing a “conspiracy theory”. This is a misreading of Tim. He’s careful to explain the politics of climate change not as conspiracy. After all, it all happened in the open.
Mark wrote: “It will take 12,000 years for 20 feet at a rate of 2″/century.”
Why do you think SLR will be linear?
It’s already showing acceleration.
Mark Pawelek wrote:
“I don’t think I ever heard a climate alarmist refute Al Gore. That was the red flag that got me started as a skeptic”
Clearly you don’t read enough. Read harder.
http://davidappell.blogspot.com/2012/12/the-hypocrisy-of-al-gore.html
http://davidappell.blogspot.com/2008/06/gores-electricity-usage.html
http://davidappell.blogspot.com/2010/11/al-gore-may-have-just-lost-all.html
http://davidappell.blogspot.com/2006/06/gore-movie.html
http://davidappell.blogspot.com/2006/06/inconvenient-answer.html
Kenneth Richard wrote:
“In my experience, the AGW advocates don’t acknowledge “6 inches per century.” They use feet, or meters, not inches. Sounds a lot scarier.”
They are all equivalent, you know. (And much greater then 6″/cen.)
One of the dumbest comments ever.
“It’s already showing acceleration.”
No it hasn’t. That is just another piece of alarmist statistical mal-faeces.
“One of the dumbest comments ever.”
OMG.. you truly are an idiot, Appell.
NOAA themselves say 1.4mm/year average from tide gauges. That is LESS than 6″ per century.
Is your maths REALLY that bad ????
No need to answer that question.
Mark, this heap of links is just Appell striving desperately for some relevance.
Why do you think he is trolling climate realist sites at Christmas.
He is a very sad, lonely, pathetic, little worm.
tom0mason wrote:
“On sea level changes I have pointed out to AGW advocate who bluster on about this nonsense, if sea level are truly rising at an accelerating rate sure all harbors, quays, ports, piers, jetties etc would show evidence of this.”
False. For God’s sake, false.
Why would you expect all locales to show the same SLR, when they don’t all show the same tidal changes now??
NO, you are LYING through your pips again rotten-appell
There is ZERO evidence of any sea level rise acceleration.
The easiest ice to melt has already melted. The remaining ice will be more difficult to melt. Further, the rim of the bowl being filled is flared compared to the shape of the ocean basin during the last glacial advance. Thus, greater melt volume is needed to get the same elevation rise.
Some folks just make stuff up. It’s called fiction.
John F. Hultquist wrote:
“The easiest ice to melt has already melted. The remaining ice will be more difficult to melt.”
Why? Why right now, and now 5 yrs ago or 5 years from now?
David Appell: “Why [has the easiest-to-melt ice already melted]?”
About 20,000 years ago, all of Canada, Russia, the UK, most of the northern US…were buried under kilometers-thick sheets of ice. Back then, sea levels were about 120 meters lower than they are now. They rose at rates of 1 to 2 meters per century until about 8,000-6,000 years ago, when global sea levels were about 2-3 meters higher than present. See: https://notrickszone.com/2016/08/29/30-scientific-papers-reveal-inverse-co2-sea-level-signal-as-co2-rises-sea-level-falls/
The melting of much of the great continental ice sheets that commenced ~20,000 years ago was the “easy” ice to melt. Considering both the Arctic region and the Antarctic continent average about -35 C year round, that Antarctica is cooler now than it was for most of the last millennium (PAGES2k), and that the Arctic was about 2-3 degrees C warmer now as recently as a few thousand years ago … the polar ice sheets will not be melting down within 5 years, as you (apparently) believe.
Thanks KR for answering. I’ve been busy.
I’ll point out 2 things.
First, ice melts most rapidly when it is rained on. “Rain on snow” events are studied because they bring a rapid rise in local rivers, flooding. Rain tends to fall at lower elevations and in patterns – more near coastal areas, think British Columbia’s Fraser Valley and Washington’s Puget Lowland – less in a high elevation continental area such as the Rocky Mountains of Colorado.
Second, ice has a high albedo so sunlight alone is less effective than rain as a melting agent. Likewise with temperature. The ice that remains in quantity – Greenland, Antarctica, high mountain glaciers facing away from sunlight – will melt when conditions are right, but getting warm air to high elevations is a problem. The upward moving air tends to expand and (physics says) its temperature drops.
I hope Mr. Appell finds this. It seems appropriate here, following you own response to him and, I think, keeps the order.
John: Are you aware that ice melt in Greenland is *accelerating*?
Rignot et al, http://onlinelibrary.wiley.com/doi/10.1029/2011GL046583/abstract
Enderlin et al, http://onlinelibrary.wiley.com/doi/10.1002/2013GL059010/abstract
Wouters et al, http://www.nature.com/ngeo/journal/v6/n8/abs/ngeo1874.html
Harig and Simons, http://onlinelibrary.wiley.com/doi/10.1002/2016GL067759/full
McMillan et al, http://onlinelibrary.wiley.com/doi/10.1002/2016GL069666/abstract
Accelerating relative to when? As scientist have determined, ice melt for the GrIS was the same (or greater) in the 1930s as it has been in recent years, after which the SMB advanced for Greenland cooled for 40 years (1950s-1990s).
https://notrickszone.com/2016/12/19/scientists-1930s-ice-melt-rates-in-greenland-iceland-were-the-same-as-today-no-net-ice-loss-in-80-years/
Also, the Greenland ice sheet’s current extent is still more advanced now than it has been for more than 90% of the last 7,500 years:
https://notrickszone.com/2016/12/15/scientists-greenland-is-now-much-colder-with-more-advanced-ice-sheet-margins-than-90-of-the-last-7500-years/
I’ve got some coastal property for sale in Florida. Anyone interested?
Call Di Craprio.. he likes coastal property.
Needs to be only 3-4″ about high tide level though.
Paul Krupin wrote:
“I’ve got some coastal property for sale in Florida. Anyone interested?”
Increasingly, no.
“Perils of Climate Change Could Swamp Real Estate,” NY Times, 11/24/16.
http://www.nytimes.com/2016/11/24/science/global-warming-coastal-real-estate.html
Even raising yourself to quote “science” from the NYT.
roflmao !!
roflmao
http://www.primelocation.com/overseas/property/united-states/florida/
Big upgrade from your granny’s cellar.
I’m not in the least bit worried about sea level rise.
And, even if sea level were to fall, living next to a potential hurricane landing strip would not appeal to me.
Thanks Kenneth. I didn’t realize that there were so many new papers out there showing that the man-made global warming theory is flakey, as we always suspected it was. Your hard work over the past months is really opening some eyes.
Easy to check on what Mörner claims – download a few PSMSL series and plot them yourself. Any with current data will do, except Scandinavia and the Baltic, where GIA is raising the land. See if what you get agrees with his claims.
Well if we’re not going to count the Baltic region, should we exclude the areas where the land is sinking too? For example, around the Gulf Coast? Or do we indeed count the sea level data where land is sinking because it conforms to the paradigm, and only exclude the data that do not conform to the paradigm?
Alaska: average -5.84 mm/yr
http://tidesandcurrents.noaa.gov/sltrends/sltrends_states.htm?gid=1240
Ketchikan: -0.30 millimeters/year from 1919 to 2014
Sitka: -2.27 millimeters/year from 1924 to 2014
Juneau: -13.16 millimeters/year from 1936 to 2014
Skagway: -17.59 millimeters/year from 1944 to 2014
Yakutat: -14.35 millimeter/year from 1988 to 2014
Cordova: -0.26 millimeters/year from 1988 to 2014
Valdez: -8.98 millimeters/year from 1988 to 2014
Seward: -2.66 millimeters/year from 1964 to 2014
Seldovia: -10.24 millimeters/year from 1964 to 2014
Anchorage: -0.61 millimeters/year from 1972 to 2014
Kodiak Island: -10.77 millimeters/year from 1975 to 2014
Sand Point: 0.68 millimeters/year from 1972 to 2014
Adak Island: -2.96 millimeters/year from 1957 to 2014
Unalaska: -5.26 millimeters/year from 1957 to 2014
Prudhoe Bay: 1.20 millimeters/year from 1990 to 2014
——————————————————————————
California: average 1.12 mm/yr
+2.08 mm/yr
http://tidesandcurrents.noaa.gov/sltrends/sltrends_station.shtml?stnid=9410170
+2.11 mm/yr
http://tidesandcurrents.noaa.gov/sltrends/sltrends_station.shtml?stnid=9410230
+0.88 mm/yr
http://tidesandcurrents.noaa.gov/sltrends/sltrends_station.shtml?stnid=9410660
+1.43 mm/yr
http://tidesandcurrents.noaa.gov/sltrends/sltrends_station.shtml?stnid=9410840
+0.74 mm/yr
http://tidesandcurrents.noaa.gov/sltrends/sltrends_station.shtml?stnid=9412110
+1.92 mm/yr
http://tidesandcurrents.noaa.gov/sltrends/sltrends_station.shtml?stnid=9414290
+0.67 mm/yr
http://tidesandcurrents.noaa.gov/sltrends/sltrends_station.shtml?stnid=9414750
+1.75 mm/yr
http://tidesandcurrents.noaa.gov/sltrends/sltrends_station.shtml?stnid=9415020
+1.51 mm/yr
http://tidesandcurrents.noaa.gov/sltrends/sltrends_station.shtml?stnid=9415144
+0.04 mm/yr
http://tidesandcurrents.noaa.gov/sltrends/sltrends_station.shtml?stnid=9416841
-0.84 mm/yr
http://tidesandcurrents.noaa.gov/sltrends/sltrends_station.shtml?stnid=9419750
Kenneth wrote:
“should we exclude the areas where the land is sinking too?”
Why? They are the sentinels — the places where SLR will first present as a problem. They are warning signs for everyone else….
Sea levels have been rising and falling for thousands of years. Can you explain why it is that global sea levels were about 2 meters higher than they are now about 6,000 years ago, when CO2 levels were in the 265 ppm range? Why would sea levels be that much higher with so much lower CO2 — if CO2 concentrations are the primary cause of sea level changes?
https://notrickszone.com/2016/08/29/30-scientific-papers-reveal-inverse-co2-sea-level-signal-as-co2-rises-sea-level-falls/
So we can include the places where the land is rising.. OK !
https://tidesandcurrents.noaa.gov/sltrends/sltrends_station.shtml?stnid=9452400
These are the sentinels that show us we are rapidly running out of seawater. !
Appell is all in for those who adjust the data based on their models, to make it look more dangerous. They are like the store clerk who puts his thumb on the scale to make it weigh more, so he can overcharge you. Dishonest cheats, scum of the earth.
I live at ~675 m. elevation and 100 miles east of the Pacific Ocean in Washington State so my property is safe. The nearest sea level is in the Puget Sound area. Tectonic forces are resulting in “the Puget Lowland being compressed and warped like an accordion.”
http://pnsn.org/outreach/about-earthquakes/plate-tectonics
See the last image on the page. Therefore, sea level data is hard to interpret and is not worrying. We do worry about a massive earthquake (9+) and an immediately following tsunami.
You have overlooked that sea level rise is now accelerating.
acc(Aviso) = 0.052 mm/yr2
acc(CSU) = 0.034 mm/yr2
And these accelerations are themselves increasing.
Linear fits no longer suffice.
So it is now accelerating? What year have you selected as your starting point?
http://www.jcronline.org/doi/pdf/10.2112/JCOASTRES-D-10-00157.1
There have been several studies focusing on the acceleration of sea level. Woodworth (1990) analyzed long records from European tide gauges and found an overall slight deceleration from 1870 to 1990, although he found accelerations in individual gauge records. He also analyzed the four oldest European gauge records from Brest, Sheerness, Amsterdam, and Stockholm in 1807, 1834, 1799, and 1774, respectively. Woodworth found a small acceleration on the order of 0.004 mm/yr, which he indicated appeared typical of European Atlantic and Baltic coast mean sea-level acceleration over the last few centuries. He noted that this small acceleration was an order of magnitude less than anticipated from global warming.
Jevrejeva et al. (2008) performed a similar analysis based on long-term tide-gauge recordings at Amsterdam, Liverpool, and Stockholm. Jevrejeva et al. concluded that sea level has accelerated an average of approximately 0.01 mm/yr over the past 200 years, with the largest rise rate between 1920 and 1950.
Douglas (1992) analyzed 23 worldwide tide-gauge records of 75 years or greater and determined an average sea-level deceleration of -0.011 ±0.012 mm/yr (standard deviation [SD]) for the 80-year period from 1905 to 1985. Douglas further analyzed 37 global records that had an average length of 92 years and determined that from 1850–1991 the average acceleration was 0.001 ±0.008 mm/yr (SD). He noted that global climate models forecast acceleration over the next five to six decades in the range of 0.1–0.2 mm/yr and concluded there was no evidence of acceleration in the past 100 or more years that was statistically significant or consistent with values predicted by global warming models.
Church et al. (2004) used nine years of Topography Experiment (TOPEX)/Poseidon satellite-altimeter data to estimate global empirical orthogonal functions (EOFs) that were then combined with historical tide-gauge data to estimate global sea-level rise from 1950–2000. The data led them to conclude, ‘‘… there is no detectable secular increase in the rate of sea-level rise over the period 1950–2000.’’
Woodworth et al. (2009) concluded there was consensus among the authors that acceleration occurred from around 1870 to the end of the 20th century; however, with the major acceleration occurring prior to 1930, the sea-level rise (Figure 1) appears approximately linear [no acceleration] from 1930 to 2004.
We also analyzed the worldwide data of Church and White (2006) for the period 1930–2001 and obtained a deceleration of -0.0066 mm/yr . … We analyzed the new data set from 1930–2007 [Church and White, 2009] and obtained a deceleration of -0.0130 mm/yr. Therefore, the deceleration that we find in U.S. gauge records for 1930–2010 is consistent with worldwide-gauge data of Church and White (Permanent Service for Mean Sea Level, 2010b)
Furthermore, Holgate (2007) analyzed nine long worldwide tide-gauge records and found a decrease in the sea-level trend from the period 1904–53 to the period 1954–2003 that is equivalent to a deceleration of -0.012 mm/yr, the same that we obtained by extending Douglas’s analysis to the period 1905–2010. Holgate noted that the deceleration he obtained was consistent with ‘‘…a general deceleration of sea level rise during the 20th century’’(pp. 243–244) that he said was suggested in analyses by Woodworth (1990), Douglas (1992), and Jevrejeva et al. (2006). We repeated the reanalysis of data presented in Douglas (1992) for the period 1930–2010 and obtained a deceleration of -0.015 ±0.011 mm/yr (SD), which is somewhat greater than the deceleration from 1905–2010.
Conclusions: Our analyses do not indicate acceleration in sea level in U.S. tide gauge records during the 20th century. Instead, for each time period we consider, the records show small decelerations that are consistent with a number of earlier studies of worldwide-gauge records. The decelerations that we obtain are opposite in sign and one to two orders of magnitude less than the +0.07 to + 0.28mm/yr accelerations that are required to reach sea levels predicted for 2100 by Vermeer and Rahmsdorf (2009), Jevrejeva, Moore, and Grinsted (2010), and Grinsted, Moore, and Jevrejeva (2010). Bindoff et al. (2007) note an increase in worldwide temperature from1906 to 2005 of 0.74 C. It is essential that investigations continue to address why this worldwide-temperature increase has not produced acceleration of global sea level over the past 100 years, and indeed why global sea level has possibly decelerated for at least the last 80 years.
roflmao.
Oh really.. Appell.. now you are just getting STUPID.
Those acceleration rates use the satellite series tacked onto the end of the tide series.
A big no-no when they obviously have no correlation.
Is your maths really that ABYSMAL that you accept that little piece of statistical farce ???????
Oh.. we have seen your maths in action… so yes it is that ABYSMAL. !!
David Appell,
These model may indeed be very accurate and may even be useful, given what they are asked to do. However what question do they answer?
They patently do not give the answer that the very real observed data, observations that indicate sea-level rise is not accelerating as seen on this planet.
In science it is usual for models to have methods validated (against mathematically reduced real physics, chemistry, etc.), and data verified against observations.
Thus when a disparity between them is noted the observations are rechecked and when found to be OK, the model is determined to be at fault.
If a thousand models come up with the same wrong answer it indicate that there are a thousand wrong models and not that observed reality is wrong. The models require more work as they are in error.
Reality is the standard in real science, not the models.
Pierre: How many times do you need to be proven wrong?
Give me a number….
The same as anyone else. And it takes only one person, and not a “consensus”.
As often as David Appell has been proven wrong, it’s really sad to see him challenging Pierre the way he does.
————————————-
RE David Appell’s claims of dramatic sea level rise.
“As new data, MODELS and corrections (i.e., ADJUSTMENTS) become available, we continuously revise these estimates…” – U of Colorado (one of main perps in use of modeled “adjustments)
What they do is model what they think should be happening, and adjust the data accordingly to give a fictitious rise in sea level.
See also here for LOTS of info on why David Appell is more than just wrong.
http://www.c3headlines.com/sea-levels.html
From you that is hilarious, appell-worm.
You are perpetually WRONG.
It is your meme.
It is who you are.
As always ChiefIO has looked at some of this before. Here the link, there are some stunning pictures in the comments.
https://chiefio.wordpress.com/2010/12/06/ostia-antica-and-sea-level/
[…] – See more at: notrickszone.com […]
lowest arctic sea ice for tow months.
http://en.es-static.us/upl/2016/12/arctic-sea-ice-graph-comparison.gif
But why look at facts, when you can simply keep quoting papers that support your believes?
So monthly sea ice anomalies are related to sea level rise how, sod?
Svendsen et al., 2016
http://onlinelibrary.wiley.com/doi/10.1002/2016JC011685/abstract
Stable reconstruction of Arctic sea level for the 1950–2010 period
From our reconstruction, we found that the Arctic mean sea level trend is around 1.5 mm +/- 0.3 mm/y for the period 1950 to 2010, between 68ºN and 82ºN.
So, I take it that Appell is back on the green payroll, if he was ever off it?
Why are you only looking at Greenland and Antarctica for sea level rise???
It’s this kind of cherry picking that time and again shows your reality denier are fundamentally dishonest.
James Hansen himself has claimed sea levels will rise 10 feet in the next 50 years due to accelerated melting of Antarctica and Greenland. Is he wrong?
Slate’s Eric Holthaus, summarizing Hansen’s latest catastrophe paper: “Glaciers in Greenland and Antarctica will melt 10 times faster than previous consensus estimates, resulting in sea level rise of at least 10 feet in as little as 50 years.“