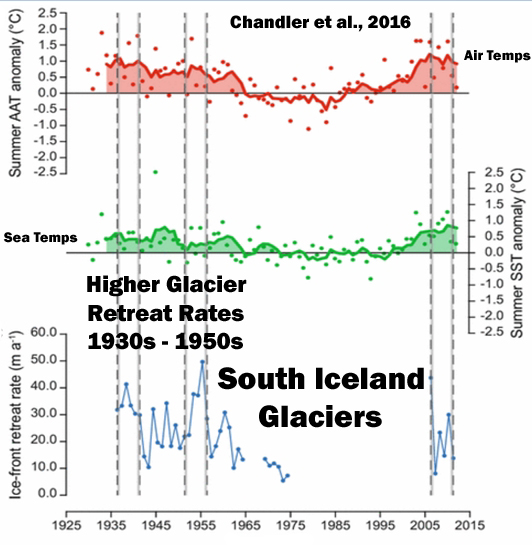
“[T]he coincidence of the most recent phase of ice-frontal retreat…and warming summer temperatures is not unusual in the context of the last ~80 years.” — Chandler et al., 2016
All too often, scientific analysis of modern glacier and ice sheet melt rates is conveniently confined to the last 30 to 60 years. Indeed, the common reference period for determining current surface mass balance estimates marks the three decades between 1961-1990, which “coincidentally” happens to contain some of the coldest temperatures of the last few hundred years — when glaciers were observed to be advancing relative to the period centered around the 1930s. Contemporary scientists routinely reported on these observations (a rapidly cooling climate, advancing glaciers) in scientific journals. For example:
Gordon, 1981 “Since about 1968/69 the glacier fronts have advanced by up to 158 m following a marked climatic recession [cooling] during the 1960s and early 1970s. In general, fluctuations of the glaciers have been in sympathy with prevailing climatic trends and show a relatively rapid response following temperature changes.”
Andrews et al., 1972 “Mean summer temperatures have declined throughout the 1960s to a level cooler than for approximately 40 yr. … The net effect has been for heavier falls of snow in winter and with lower summer temperatures and therefore less melting (Jacobs et al, 1972), resulting in notably increased glacierization. … at least two corries snowfree in 1960 are presently occupied by incipient glaciers. … The present Neoglacial ice is nearly as extensive as the late glacial stade.”
Schneider, 1974 “In the last century it is possible to document an increase of about 0.6°C in the mean global temperature between 1880 and 1940 and a subsequent fall of temperature by about 0.3°C since 1940. In the polar regions north of 70° latitude the decrease in temperature in the past decade alone has been about 1°C, several times larger than the global average decrease.”
Chi-chun and Pen-hsing, 1978 “Research on glacier fluctuations shows that the Little Ice Age was also experienced here with maxima occurring during the 19th century. This was followed by a strong retreat from the 1930s with recent signs of the initiation of a new period of glacier advance. … Our on-the-spot investigations, documental records and information local residents all tell us that, beginning in the thirties, the glaciers in Tibet underwent a period of strong retreating. The air temperature began to fall after the fifties. From meteorological records, we know that the temperature in the sixties was universally 0.7°C or so lower than in the fifties“
Hollin, 1965 “‘Surges’ and ‘catastrophic advances’ in glaciers have received increasing attention recently. More than forty such events have been reported from Alaska and northwest Canada alone.”
Recently published temperature reconstructions of the high Northern latitudes also indicate a significant drop in temperature (relative to the 1920s to 1940s) during this reference or baseline period (1961-1990). For example:
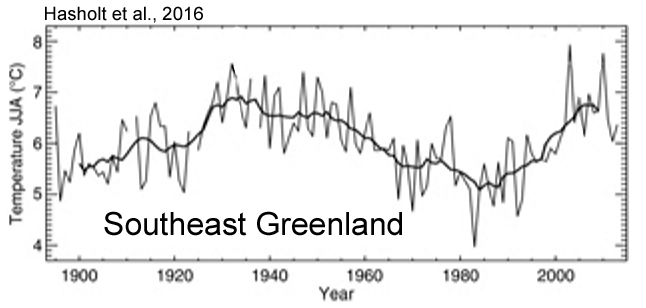
Hasholt et al., 2016 “We determined that temperatures for the ablation measurement periods in late July to early September were similar in both 1933 and the recent period [1990s – present], indicating that the temperature forcing of ablation within the early warm period and the present are similar.”
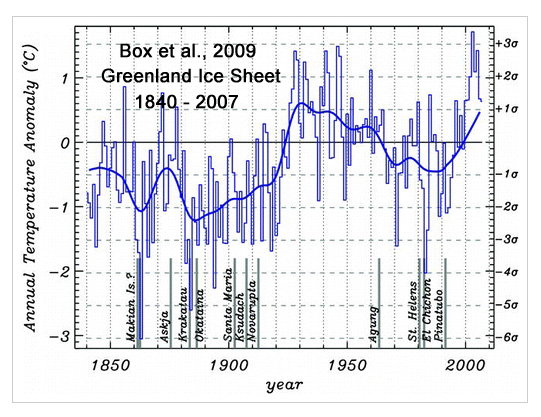
Box et al., 2009 “The annual whole ice sheet 1919–32 warming trend is 33% greater in magnitude than the 1994–2007 warming. … The 1955–82 cooling phase was most significant during autumn in east and southern Greenland.”
So by directly comparing the modern warm phase (1990s-present) in the high latitudes of the Northern Hemisphere to a cool phase (1961-1990), and by failing to include the 1920s to 1940s warm period in their baseline determinations, scientists can conveniently report “accelerated” ice melt rates for recent decades — and thus provide headline material for media outlets (and policy makers) actively promoting the “dangerous” global warming agenda.
‘Present-Day Changes Are Not Exceptional’
On the occasion when scientists extend their glacier or ice sheet studies back to periods earlier than the 1950s, a significantly non-alarming conclusion emerges that does not support the modern zeitgeist that says “catastrophic” and “unprecedented” ice melt is occurring today. For example, in “Surface mass-balance changes of the Greenland ice sheet since 1866,” Wake et al., 2009 write:
“All SMB [surface mass balance] estimates are made relative to the 1961–90 average SMB and we compare annual SMB estimates from the period 1995–2005 to a similar period in the past (1923–33) where SMB was comparable, and conclude that the present-day changes are not exceptional within the last 140 years.”
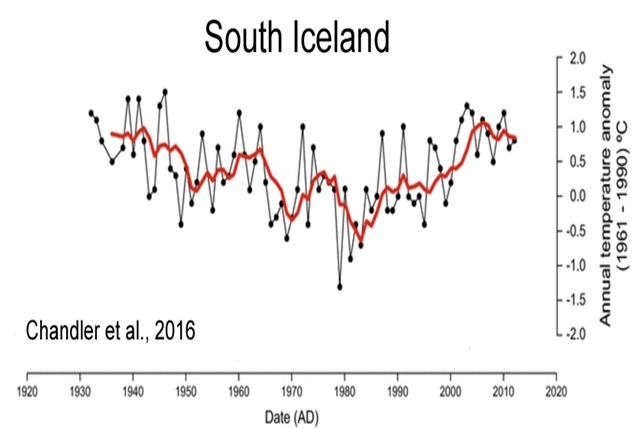
Investigation Of Long-Term Glacier Melt Rates For Iceland Reveal No Net Change In 80 Years
Two new (2016) papers lend further support to the conclusion that there currently is nothing unusual happening in the cryosphere. In their paper “Recent retreat at a temperate Icelandic glacier in the context of the last ~80 years of climate change in the North Atlantic region”, Chandler et al. (2016) compare 3 periods with high glacier-melt rates: 1936-’41, 1951-’56, and 2006-2011. They find that not only were the temperature changes comparable for all three periods, but so was the rate and magnitude of ice recession. In fact, the retreat rates were determined to be higher during the earlier periods (1930s, 1950s) than during the 21st century.
Chandler et al., 2016 (Iceland Glaciers)
“[W]e calculated ice-frontal retreat rates [Skálafellsjökull glacier, SE Iceland] since the 1930s. From the calculated record of ice-front retreat, we recognised two pronounced periods of glacier recession [1936-’41 and 1951-’56] for comparison with the most recent phase of retreat (2006–2011). We undertook quantitative analysis to examine variability between these three periods of retreat, and showed that they are comparable both in style and magnitude. Analysis of climate data for SE Iceland also indicates that the three periods of ice-frontal retreat [1936-’41, 1951-’56, and 2006-’11] identified are associated with similar summer air temperature values, which has previously been shown to be a key control in terminus variations in Iceland. We, therefore, demonstrated that the coincidence of the most recent phase of ice-frontal retreat at Skálafellsjökull (2006–2011) and warming summer temperatures is not unusual in the context of the last ~80 years. This highlights the need to place observations of contemporary glacier change in a broader, longer-term (centennial) context.”
Investigation Of Long-Term Ice Sheet Melt Rates For Greenland Reveal No Net Change In 80 Years
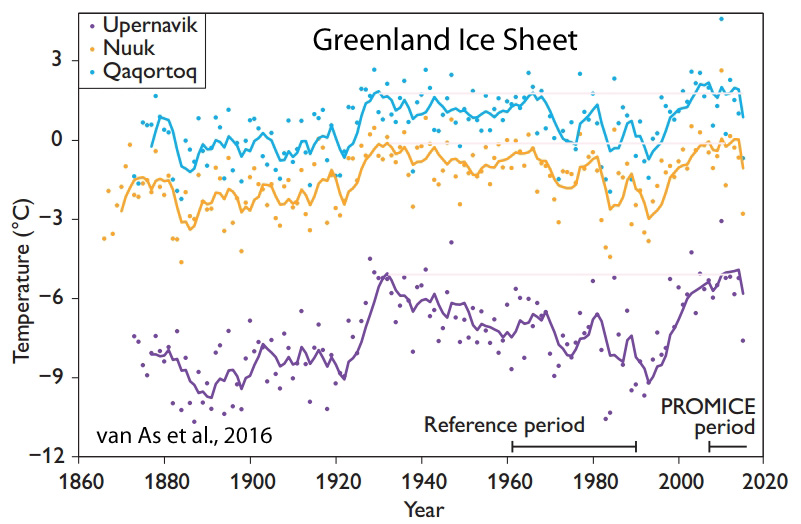
A total of 13 scientists (van As et al., 2016) contributed to another new paper entitled “Placing Greenland ice sheet ablation measurements in a multi-decadal context“, a comprehensive analysis of changes to the Greenland Ice Sheet since the 1880s. Once again, the results do not advance the cause for alarm about modern ice sheet melt trends. The longer-term temperature changes for the ice sheet indicate a sharp warming during the 1920s and 1930s, a pronounced cooling trend during the 1960s to early 1990s (which is once again used as the reference period for this study), and then a subsequent warming after about 1995. Both temperature peak (1930s and 2006-’11) periods were similar in magnitude.
[I]n southern Greenland ablation peaked significantly around 1930. While most of Greenland underwent relatively warm (summer) conditions in the 1930s (Cappelen 2015), this was most notable at the more southern locations, resulting in amplified ablation values according to our estimates. JJA [summer] temperatures were higher in 1928 and 1929 than in any other year of the Qaqortoq record, both attaining values of 9.2°C. This suggests that ablation in those years may have exceeded the largest net ablation measured on the Greenland ice sheet (2010).
Although van As et al. (2016) indicate that it is “likely” that the amplitude of the ablation (melting) volume in recent decades has been more pronounced than during the 1930s, the depicted trend lines for the (4) Greenland Ice Sheet regions that extend back to at least 1900 indicate that 3 out of the 4 ablation amplitudes for the 1930s were comparable to, or exceeded, what has occurred in recent decades.
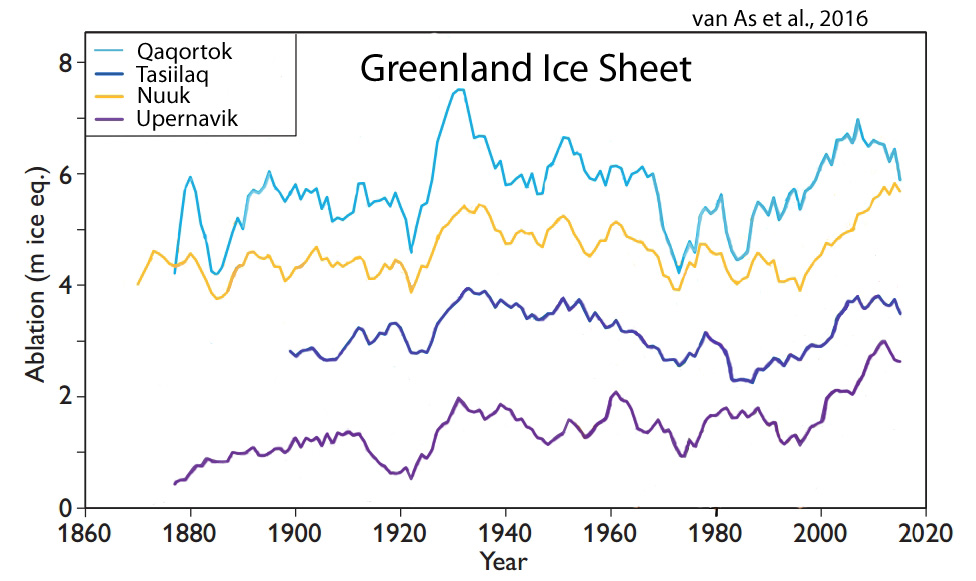
In fact, a composite of the four trend lines (red) shown above suggests no significant differences in ablation rates between the 1920s-1930s and the 21st century.

Other scientists (Fettweis et al., 2008, below) have previously reached the conclusion that modern ice sheet and glacier recession is not only not unusual in the context of the last century, the surface mass balance loss in recent decades may have yet to exceed the losses from the 1930s period. When also considering that the ice sheet cooled and gained mass between the 1960s and 1990s, it would be fair to say that there has been no net mass loss for the Greenland Ice Sheet in the last 80 years, or since anthropogenic forcing is believed to have exerted an “unprecedented” and potentially “catastrophic” influence on the climate.
Fettweis et al., 2008 “The rate of warming in 1920– 1930 is the most spectacular as pointed out by Chylek et al. (2006). Finally, Greenland climate was colder around 1920 and, in the 1970s and 1980s. The temperature minimum (resp. maximum) seems to have occurred in 1992 after the Mont Pinatubo eruption (resp. in 1931). The warm summers of recent years (1998, 2003, 2005), associated with large melt extent areas (Fettweis et al., 2007), seem to be less warm than these of the 1930s, as also pointed out by Hanna et al. (2007).”
“The absolute minimum [surface mass balance] occurred around 1930 with a SMB anomaly near −300 km3 yr−1 . Secondary (minor) SMB minima appear to have occurred in 1950 and 1960, equalling the surface mass loss rates of the last few years (1998, 2003, 2006). … After the 1990s, the GrIS SMB decreases slowly to reach the negative anomalies of the last few years, although the summers of the 2000s were not exceptional compared to 70 yr ago”


A week or so ago I proposed a graph of the approximate Total Greenland Ice Mass from 1979-now
I have just extended it back some 1000 years.
Feel free to offer your own updates/corrections. 🙂
https://s19.postimg.org/heeb8l6r7/Greenland_ice_mass2.png
Oh My God. Greenland has flatlined!
Yep.. The tiny gains and losses are so small they cannot be seen on any properly zeroed graph.
Total mass is somewhere around 30 Million Gigatonnes.
even the largest alarmist loss shows maybe 6000 Gigatonnes since 1979
Ungraphable on a zero scale graph.. They have to resort to anomalies with zero perspective of reality.
But that is the “climate change™” scam from go to woe,
…. total detachment from REALITY.
“even the largest alarmist loss shows maybe 6000 Gigatonnes since 1979”
And 1979 was one of the coldest years in the Arctic in the last 100 years. Notice the anomaly on the bottom of this graph (“Satellite Record Begins”). That’s 1979.
https://notrickszone.com/wp-content/uploads/2016/11/Arctic-Surface-Temps-Since-1920-copy-768×394.jpg
Yep, The late 1970’s was also a time of EXTREMES as far as Arctic sea ice is concerned. The perfect cherry-pick if you wanted to show loss of Arctic sea ice.
The Iceland sea ice index shows this very clearly.
https://s19.postimg.org/bkgbf2prn/Icelandic_sea_ice_index_2.png
My deepest sympathy to the family and friends of the victims of Merkel’s lunacy.
http://www.weaselzippers.us/314558-breaking-truck-drives-through-christmas-celebration-in-berlin-1-dead-50-injured/
[…] for the Greenland ice sheet rather than a more representative period. In fact, as indicated by several recent papers, the Greenland ice sheet’s surface mass balance was similar to or even lower during the […]