What Models Say:
♦ IPCC TAR (2001): “Milder winter temperatures will decrease heavy snowstorms“
♦ Kunkel et al., 2002: “Surface conditions favorable for heavy lake-effect snow decreased in frequency by 50% and 90% for the HadCM2 and CGCM1 [models], respectively, by the late 21st Century. This reduction was due almost entirely to … an increase in average winter air temperatures.”
♦ IPCC AR4 (2007): “Snow season length and snow depth are very likely to decrease in most of North America“
♦ Kapnick and Delworth, 2013: “In response to idealized radiative forcing changes, both models produce similar global-scale responses in which global-mean temperature and total precipitation increase while snowfall decreases. … By using a simple multivariate model, temperature is shown to drive these trends by decreasing snowfall almost everywhere” (press release) “In North America, the greatest reductions in snowfall will occur along the northeast coast, in the mountainous west, and in the Pacific Northwest. Coastal regions from Virginia to Maine … will get less than half the amount of snow currently received.”
What Observations Say:
Coleman and Schwartz, 2017
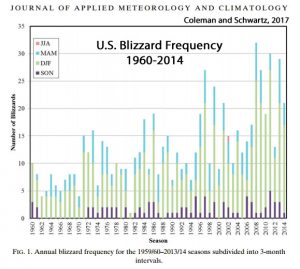
“Data revealed 713 blizzards over the 55 years, with a mean of 13 events per season. Seasonal blizzard frequency ranged from one blizzard in 1980/81 to 32 blizzards in 2007/08. Federal disaster declarations resulting from blizzards totaled 57, with more than one-half of them occurring in the twenty-first century.”
“Storm Data attributed 711 fatalities during the 55-yr study period, with an average of one individual per event; 2044 injuries were reported, with a mean of nearly three per blizzard. Property damage totaled approximately $9.11 billion in unadjusted dollars, with an approximate mean of $12.6 million per storm.”
“Seasonal blizzard frequencies displayed a distinct upward trend, with a more substantial rise over the past two decades. … The modeled increase in blizzard activity showed a nearly fourfold upsurge between the start and end of the study period at 5.9 and 21.6 blizzards, respectively. On the basis of current model trends, the expected blizzard total for a season is 32 blizzards by 2050; uncertainty exists on whether the linear trend will continue or stabilize in the near future.”
The Historical Context: More Snow Means Temperatures Are Cooling, Not Warming
It has long been assumed in the scientific community that snow coverage would decrease during warm periods, and increase during cool periods. For example:
Eichenlaub, 1970
“Evidence suggests that lake effect snowfall has significantly increased during the past several decades, particularly in Southern Michigan and Northern Indiana. While the observed changes cannot be definitively ascribed to any single factor, it seems likely that a general cooling of winter temperatures may be partially responsible for this climatic change.”
[M]any of the snowfall time-series curves for the lake stations show downward trends during the 1920’s and 1930’s, at the height of the recent warm period, and the more recent snowfall increase has coincided with a general world-wide cooling which has occurred in the last several decades.
Recent evidence derived from [isotope] analysis of ice core samples on the Greenland ice cap indicates a continuance of this cooling trend for another 20 or 30 years.”
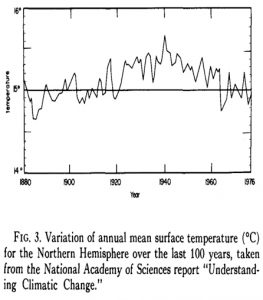
What Dr. Eichenlaub was describing with regard to the increasing and decreasing temperature and snowfall trends is explained by Dr. Agee (1980). The Northern Hemisphere’s surface temperatures warmed by “nearly 1°C” between 1890 and 1940, and then after 1940 and through the mid-1970s, the Northern Hemisphere experienced “comparable cooling” (almost -1°C). (Most of these observations of warming and cooling amplitudes have now been removed from modern Northern Hemisphere datasets via “adjustments” so as to comply with climate model projections.)
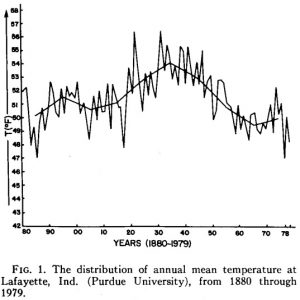
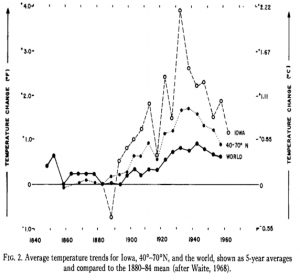
Agee, 1980
In the temperature records for Indiana and Iowa (U.S.), Agee (1980) reported that, following the overall hemispheric pattern, both states warmed sharply during the 1920s to 1940s and then cooled by more than 2°C in the decades after. This was the context that Eichenlaub (1970) was referring to in pointing out that the U.S. had been experiencing a long-term cooling trend since the 1940s which led to a significant increase in snowfall.
The U.S. Cooling Trend Has Returned In Recent Decades
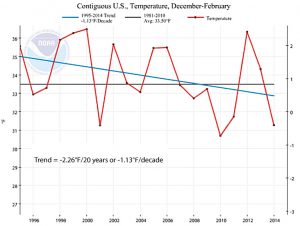
According to NOAA, winter temperatures for the contiguous U.S. declined at a rate of -1.13°F per decade between 1995 and 2014.
NOAA screenshot
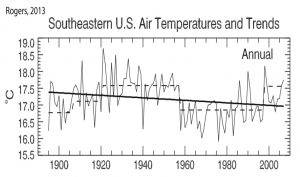
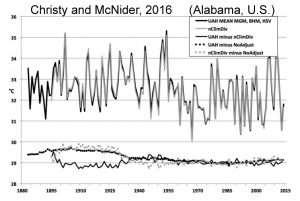
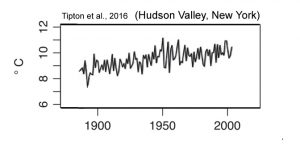
Large Regions Of The U.S. Are Still Colder Now Than They Were In The 1950s
Rogers, 2013
Christy and McNider, 2016
Tipton et al., 2016
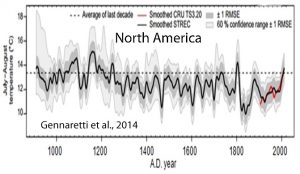
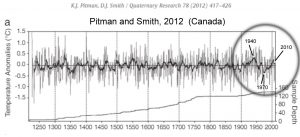
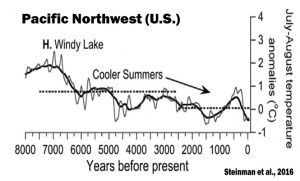
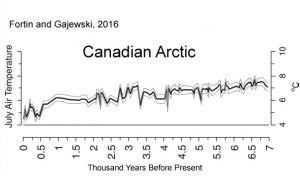
North American Continent Is Not Discernibly Warmer Than During The Little Ice Age
Gennaretti et al., 2014
Pitman and Smith, 2012
Steinman et al., 2016
Fortin and Gajewski, 2016
“Biological production decreased again at ~ 2 ka and the rate of cooling increased in the past 2 ka, with coolest temperatures occurring between 0.46 and 0.36 ka [460 and 360 years ago], coinciding with the Little Ice Age. Although biological production increased in the last 150 yr, the reconstructed temperatures do not indicate a warming during this time. … Modern inferred temperatures based on both pollen and chironomids are [currently] up to 3°C cooler than those inferred for the mid-Holocene.”
Summary
It is widely accepted that enhanced snow cover and more frequent snow storms (blizzards) occur when winter temperatures are cooling (or cooler relative to an identified warm period). U.S. temperatures cooled dramatically after the 1940s and 1950s, and they may only have recently reached the levels of warmth achieved in the first half of the 20th century, when snow cover was significantly reduced. Blizzard frequency has increased almost four-fold since 1960, even as climate models have claimed they should be declining in frequency. This increase in snow storms has coincided with a 20-year (1995-2014) winter temperature cooling trend in the U.S.
Overall, there has been no discernible anthropogenic influence on U.S. snow storm frequency in the last several decades, and there has been no discernible anthropogenic influence on U.S. temperatures in the last several hundred years, or even the last several decades relative to the early 20th century.



Closed minds will of course point to research which says there would be more water vapour in the atmosphere due to global warming, ignoring the FACT that the IPCC said winter precipitation would decrease.
How can this be?
After all David Viner (UEA) said “within a few years winter snowfall will become a very rare and exciting event”.
Well, here’s another one from the carousel of clownishness:
SHUMLIN: Any reasonable scientist will tell you that we’re going to rise anywhere between another two and three degrees in the next 30 years. That means that New Jersey’s climate is moving to Vermont in the next decade. That has tremendous implications in our economy’s ski, maple-sugar making, leaf-peeping and the list goes on and on. So we are — I at least am — looking at this with a major sense of panic.
http://www.marketplace.org/2007/04/18/sustainability/when-theres-less-white-green-mountain-state
Note the date on that story. Less than three months to go!
(This one should be publicized and mocked as much as the infamous Viner emission. None of these clowns should be let off the hook.)
Andrews et al., 2016
http://onlinelibrary.wiley.com/doi/10.1002/wea.2731/full
Long-term observations of increasing snow cover in the western Cairngorms [Scotland]
For 13 consecutive winters between 2002 and 2015, the date for the onset of continuous winter snow cover, and subsequent melt, was recorded on slopes of north and north-easterly aspect at altitudes between 450m and 1111m amsl. Results show that the period of time during which snow is continuously present in the catchment has increased significantly by 81 (±21.01) days over the 13-year period, and that this is largely driven by a significantly later melt date, rather than earlier onset of winter snow cover.
winter snow cover is NOT a good indicator of a warming or cooling world.
Please educate yourself, start by reading the chapter on this topic in the latest IPCC report:
http://ipcc.ch/pdf/assessment-report/ar5/wg1/WG1AR5_Chapter04_FINAL.pdf
The relevant subchapter is seasonal snow, and it starts on page 358.
Please learn the basics of a topic!
Lack of knowledge has never stopped YOU from pontificating about electricity generation.
Get educated sod —
The IPCC report is NOT a science document, it IS a political document.
And sop please be aware those that run the model have spoken —
From https://www.wcrp-climate.org/grand-challenges whitepaper in ‘clouds, circulation and climate sensitivities.
The part i linked to has no model what so ever. Real data shows that winter snow cover is increasing by a tiny bit, while summer snow is decreasing massively.
This is about the strongest warming signal that you can get.
Unless of course you only run on fake news and pretend every snowfall and winter storm is full proof of global cooling.
the amount of Summer snow where I live has not changed a bit in 50 years
I assume you don’t live near Buxton. This news item features the inimitable ‘Dickie’ Bird.
http://www.buxtonadvertiser.co.uk/lifestyle/dickie-bird-recalls-when-snow-stopped-play-in-buxton-1-3493083
So why does the IPCC and “settled” science say that winter temperatures will cause snow to decrease?
IPCC TAR (2001): “Milder winter temperatures will decrease heavy snowstorms“
Kunkel et al., 2002: “Surface conditions favorable for heavy lake-effect snow decreased in frequency by 50% and 90% for the HadCM2 and CGCM1 [models], respectively, by the late 21st Century. This [snow] reduction was due almost entirely to … an increase in average winter air temperatures.”
Even the title study on U.S. blizzards shows that March-May and September-November snows have increased dramatically since the 1960s. There were even summer blizzards during the 2000s, but none during the 1960s.
“So why does the IPCC and “settled” science say that winter temperatures will cause snow to decrease?”
because it obviously will. A warmer world will see less snow, at some time even in winter.
you are just picking several indicators to stack the odds for the result you want to produce, for example: location USA (which has shown a little less warming than other places), winter (which is behaving differently on snow cover than other seasons) and snow cover (instead of snow volume).
here you can see a nice picture of the alps and a simple conclusion
“But in the 1980s and 90s, average winter snow cover started to decrease, and winter rainfall increased at lower altitudes. That trend has continued in the 21st century. Though the average area covered by snow in any given winter has not changed much, the depth and the duration of snow cover has decreased, particularly in the southeastern and southwestern mountains and in areas below 2000 meters altitude.”
http://earthobservatory.nasa.gov/IOTD/view.php?id=87753&src=eorss-iotd&utm_source=twitterfeed&utm_medium=twitter
The IPCC assume that all changes in climate forcing since 1750 are man-made! This is stated in Figure TS.6 of the report from WG1 of AR5. The climate models are based on this assumption, ie that there has been no natural climate change since before the end of the last Little Ice Age.
This assumption is so obviously incorrect that we shouldn’t be too surprised when their results don’t match observations!
And NOAA’s Gavin Schmidt still says it’s getting hotter…
yeah but schmidty liar, has a long history of hyperbole, peddling fake statistics and lying, always lying.
He qualifies for climactivist W-anchor of the year – again.
A number of issues here.
1) The typical definition of blizzard is not necessarily synonymous with especially heavy snowfall. It’s more about snowfall occurring in the presence of a storm event. So an increase in blizzards may indicate an increase in storms rather than an increase in snowfall or heavy snowfall. Comparing blizzard frequency to model snowfall data is therefore not like-for-like. Checking Northern USA Winter precipitation data I can’t see any trend.
There have been trends identified suggesting increased Extratropical storm events over the period from 1960. GCMs are apparently equivocal on Extratropical storm trends in the Northern Hemisphere (IPCC AR5 Chapter 12), in terms of effect from anthropogenic influence, and the suggestion is that trends in this kind of thing could be largely natural variability.
2) This kind of data seems like it could easily be subject to some time-evolving reporting biases. The simplest being that people have reported and documented blizzards more over time, as part of efforts to study them and mitigate their impacts, and as towns have been founded and grown. The paper is paywalled and I can’t find a copy anywhere so I don’t know how they’ve built this blizzard dataset.
3) I’m not sure what the assortment of graphs were meant to show relating to this topic? It seemed like you were trying to imply that the blizzard data suggests a US cooling trend since 1960 but none of the graphs you show support that. All that actually show a trend from 1960 to near-present indicate warming.
The IPCC claims that warming causes a decrease in “heavy snowstorms”.
IPCC TAR (2001): “Milder winter temperatures will decrease heavy snowstorms”
Do you believe there is a clear distinction between “heavy snowstorms” and blizzards? Do you believe the IPCC climate models indicated blizzards would increase, but “heavy snowstorms” will decrease? If so, please provide a citation where (a) the IPCC made this distinction, and (b) where the IPCC claims AGW will cause heavy snowstorms to increase…or is it decrease?
In the body of the paper itself, potential reporting biases were addressed and accounted for in identifying the 55-year trend of a nearly 4-fold increase in U.S. blizzard frequency. The U.S. has the most comprehensive weather database available in the world, and it was fully functional in 1960. It’s a little difficult to imagine that blizzards would go undetected, especially since they are often rather newsworthy.
1. More frequent snowstorms/blizzards are associated with cooler rather than warmer temperatures.
2. U.S. temperatures were warmer in the ’20s to ’50s than in the decades afterwards.
3. The 1995-2014 winter temperatures in the contiguous U.S. have cooled at a rate of -1.13F per decade, consistent with the the large increase in blizzard frequencies during this period (see the introductory graph).
4. The U.S. and North American continent in general is no warmer now than it was during the Little Ice Age. The modern increase in surface temperatures in the U.S. predominantly occurred in the first half of the 20th century, when CO2 emissions were negligible and atmospheric CO2 concentrations hovered around 300 ppm. This strongly suggests that an anthropogenic signal in temperature trends as well as snowstorm frequencies is not clearly discernible.
“3. The 1995-2014 winter temperatures in the contiguous U.S. have cooled at a rate of -1.13F per decade, consistent with the the large increase in blizzard frequencies during this period (see the introductory graph).”
it is the other way round. i slight cooling of winter might explain your increase of blizzards (as added satellites might do, by the way).
Your other main error is the constant focus on the USA. The original claim was a global one. You can not dismiss it by focusing on the USA alone, especially not as you always only focus on the one point that fits your agenda.
“The original claim was a global one.”
FFS… Read the thread title, you dopey twerp !!!
“Do you believe there is a clear distinction between “heavy snowstorms” and blizzards?”
Yes. See here
“In the United States, the National Weather Service defines a blizzard as a severe snowstorm characterized by strong winds causing blowing snow that results in low visibilities. The difference between a blizzard and a snowstorm is the strength of the wind, not the amount of snow.”
I’ve already explained the IPCC’s position on projected Winter Extratropical storms, which would be the closest correlation to ‘blizzard’. Heavy snowstorms would be highly regionally variable. In colder places higher Winter temperatures would tend to enhance snowfall rates (not sure whether that necessarily means more snowstorms) – Greenland being the clearest example. In warmer places higher Winter temperatures would tend to reduce snowfall. I don’t know if the IPCC provide high resolution region-specific info.
————
So, are you trying to suggest that the blizzard data indicates US cooling since 1960? Even if US temperatures were warmer in the 1920s-1950s that would be irrelevant for the Blizzard data you’ve shown, which starts in 1960.
The 1995-2014 trend may show an insignificant cooling trend, but the trend from 1960 is warming, even in the graphs you show here.
I’m suggesting the models that claim snowstorms/blizzards will decrease with warming. And they haven’t decreased. They’ve increased…by a factor of almost 4.
And the distinction between a snowstorm and a blizzard [wind] is not robust enough to separate them, as, regardless of wind rates, blizzards cannot develop without temperatures that are cold enough. In other words, temperatures are the primary determinant of whether or not precipitation is snow or rain. And temperature is what the IPCC bases their (erroneous) models on that claim snowstorms/blizzards/snowcover will decrease because of human activity. It has not happened. Snowstorms/blizzards/snow cover has increased. The models are wrong.
–
Northern Hemisphere winter snowcover has been increasing since the 1960s: https://notrickszone.com/wp-content/uploads/2017/01/Northern-Hemisphere-Winter-Snow-Cover-1967-2013.jpg
–
U.S. winter snowcover has been increasing since the early 1980s: https://www.ncdc.noaa.gov/monitoring-content/sotc/snow/2015/feb/Win_US_snowcover_anoms.png
–
There has been no net change in winter snowfall/snowpack on the U.S. West Coast since the 1920s: http://www.thestormking.com/Weather/Sierra_Snowfall/2015_Snowfall_Plot_web.jpg
–
Why do you think it is, PaulS, that there has been no anthropogenic signal in snowfall/blizzard/snowstorm trends in the last few decades? Will it become detectable someday, or do you think the IPCC models will continue to be wrong?
I would hope so, considering it was “consensus” science (NAS graph depicted in Agee, 1980 above) that the Northern Hemisphere was colder in the mid-1970s than it was in the 1880s. (Of course, these observed NH temperature values have now disappeared, via data manipulation, from the NH temperature record so as to comply with climate model expectations.) So saying it’s been warming since the 1960s, when the 1960s were colder than several periods during the Little Ice Age, is like saying that, by looking at this graph (below link) of the Pacific Ocean heat content (Rosenthal et al., 2013), we humans have caused “unprecedented” warming:
https://notrickszone.com/wp-content/uploads/2016/11/Holocene-Cooling-Pacific-Ocean-Rosenthal-13-CO2.jpg
Why do you think it is, PaulS, that the anthropogenic influence has been undetectable in surface temperatures for North America, snowcover/blizzard/snowstorm rates, and the heat content in the Pacific Ocean?
Unfortunately, this is just proof of increases in “extreme” or “weird” weather” in the lexicon of the alarmists.
CAGW is a belief system, not a knowledge system. Which is why the alarmist can dismiss IPCC reports as too conservative and not be roundly criticized by their peers.
If ever a science based debate were allowed by the warmists or the MSM, the charts would speak for themselves. But a belief system isn’t impacted by facts. Facts are transitory “noise” within a composed orchestral masterpiece. The sound of audience members sneezing.
We prepare and store the ammunition, advise the world it exists and abide our time right now.
The day the warmists drop some of the excessive models in the IPCC scenarios, we will be able to talk. But when 29 years of experience hasn’t invalidated either the highest or lowest projections, you know that fact-based knowledge is not involved. Belief is: how CAGW occurs may not be determined, but CAGW WILL occur.
“Unfortunately, this is just proof of increases in “extreme” or “weird” weather” in the lexicon of the alarmists.”
It is. and you might be able to figure it out all by yourself: slightly more snow in winter with drastically less snow in summer.
can you figure out the combined effect?
“weird weather” might be a little mild for a description…
There is nothing here that hasn’t happened before. It is completely normal weather as anyone with an open mind can see. You fail to see this because you apparently don’t have a mind, let alone an open one.
“There is nothing here that hasn’t happened before. ”
This claim is garbage and it is also garbage as an argument.
2016 was the hottest year on record and we have positive proof that it was the warmest year in recent times.
if you have other data, you will have to bring some proof!
So if we live in “unprecedented” times, sod, why does the paleoclimate record indicate that most of the world was much warmer than now as recently as a few hundred to a few thousand years ago?
https://notrickszone.com/2016/12/22/the-hockey-stick-collapses-50-new-2016-scientific-papers-affirm-todays-warming-isnt-global-unprecedented-or-remarkable/#sthash.BDE0CLNh.dpbs
Actually, the Arctic, Greenland, Iceland, Scandinavia, Northern Europe…were all as warm or warmer than now during the 1930s according to many dozen recently published scientific papers, not NASA and NOAA’s made-up, in-filled, data-manipulated graphics.
Satellites have 2016 as 2/100ths of a degree warmer than 1998, which is well below uncertainty levels. So the “unprecedented” warmth of the El Nino-induced temperature anomaly for 2015-’16 (which has now disappeared) is actually only “unprecedented” since 1999.
sod: “2016 was the hottest year on record and we have positive proof that it was the warmest year in recent times.”
Australia’s Bureau of Meteorology (BoM) claims that reliable records only began in 1910*.
Is your 2016 record, of which you fail to substantiate, older than 1910, and, if so, is there any evidence data collection was of any more reliable standards?
*”Temperature data prior to 1910 should be used with extreme caution as many stations, prior to that date, were exposed in non-standard shelters, some of which give readings which are several degrees warmer or cooler than those measured according to post-1910 standards.”
http://www.bom.gov.au/climate/cdo/about/about-airtemp-data.shtml
Thanks in advance.
“we have positive proof that it was the warmest year in recent times.”
Its great that you keep displaying you total lack of understanding of errors.
Its good that you keep displaying your abject ignorance about longer time spans.. and your continued aim to remain abjectly ignorant… a refusal to learn anything.
I’ll repeat it again, even though I know you will not allow the truth into your brain-washed skull..
The world is current on a small molehill just above the COLDEST period in the last 10,000 years. It is nowhere near as warm as any time except since the tail end of the MWP.
The current period should be labelled…
THE MODERN “SLIGHTLY” WARM PERIOD.
Do
you
com-
pre-
hend ????
“you will have to bring some proof!”
Seriously, Sop??
From you, has rarely offered actual proof of anything, mainly because you have zero idea what scientific proof is!
|Sod you really are losing it, perhaps you should stay away from here as it is clearly no good for your blood pressure. Then again if you did leave, we would miss your comic posts
“can you figure out the combined effect?”
You are correct. This is exactly how it happened the last time the glaciers came.
Certainly nothing to do with warming.
Australia’s leading 97% climate scientist, Tim Flannery, who quotes IPCC:
2007, and as Tim Flannery put it, coal fired power stations “emit much of the CO2 that is the ultimate cause of the drying.
The Australian of the Year says people instead should learn to live in a permanently drier climate..
http://www.smh.com.au/news/National/Wetter-north-only-temporary-Flannery/2007/06/14/1181414456995.htm
2017, and …
“The study’s lead author Jiawei Bao said most parts of Australia would be affected by an increase in global temperatures.
“Extreme precipitation is projected to increase almost everywhere in Australia from tropical regions in the north to mid-latitudes in the south and from dry deserts in the centre to wet places along the coast,” he said.
http://www.smh.com.au/environment/more-rain-on-the-horizon-as-climate-change-affects-australia-study-finds-20170115-gts0l1.html
But, this dry-wet cycle is as old as time itself:
Alien-looking shrimp of the desert appear in Central Australia after flooding rains
http://www.abc.net.au/news/2017-01-13/shield-shrimps-in-central-australia-heavy-rains/8176744
“Satellites have 2016 as 2/100ths of a degree warmer than 1998, which is well below uncertainty levels.”
simple challenge again: Which year in the more recent times (say no more than 1000 years?) was globally warmer than 2016?
Please add error bars to your temperature!
No one knows if 2016 was warmer than 1998 in the satellite record. The difference (2/100ths of a degree) is about 10 times smaller than the uncertainty/error ranges.
We also don’t know if either 2016 or 1998 were warmer than the 1930s and early 1940s, as data tampering has removed about 0.4 C from the early 20th century warming. Reconstructions have shown that Greenland, Scandinavia, Northern Europe, Iceland, North America…were all warmer in the 1930s and 1940s than in recent decades. So no one really knows what year was “hottest.”
“We also don’t know if either 2016 or 1998 were warmer than the 1930s and early 1940s, as data tampering has removed about 0.4 C from the early 20th century warming.2
you need to back this claim up with real data.
even dropping today by 0.4°C would still beat the years you are talking about.
http://www.woodfortrees.org/plot/gistemp/mean:12
” Reconstructions have shown that Greenland, Scandinavia, Northern Europe, Iceland, North America…were all warmer in the 1930s and 1940s than in recent decades.”
No.
Please do not forget to include error bars in your comparison and please name the exact year!
This should not be complicated stuff. All you need to do is: 1937 was warmer than 2016, showing 15°C +- 0.4 while 2016 is only 14.2°C +- 0.2
You moron.. GISS has been DELIBERATELY and FRAUDULENTLY tampered to remove the 1940’s peak
We know you support FRAUD and DECEIT, because you support the renewable scam.
“even dropping today by 0.4°C would still beat the years you are talking about.”
Thanks for showing everybody JUST HOW MUCH GISS has been fraudulently adjusted.
Always. Below are about 30 links to graphs from locations all over the world taken from peer-reviewed scientific papers. All show that the 1930s to 1950s period was as-warm or warmer than the post-1998 temperatures. I have another several more dozen graphs just like these. I challenge you to examine each one, sod.
Of course, via data manipulation, the NH warming of about 0.8 C between 1880 and 1940 has been largely eliminated. For example, as of 1976, 1880 was about +0.2 C warmer than 1976, as seen here from Agee (1980):
https://notrickszone.com/wp-content/uploads/2017/01/Northern-Hemisphere-1880-1975-Agee-80.jpg
In today’s graphs of the NH, the mid- to late 1970s are about +0.3 C warmer than 1880 – because the 1940s warmth has been suppressed by about +0.4 C. That’s an additional +0.5 C of warming accrued via data manipulation. The datasets are not data. They are infilled modeled temperatures.
The entire Arctic region shows no net change in temperature since the 1940s: https://notrickszone.com/wp-content/uploads/2016/11/Arctic-Surface-Temps-Since-1920-copy.jpg Notice that the anomalies were much higher in the ’30s and ’40s — even in the HadCRUT dataset, which has been compromised.
According to satellite datasets, the overall warming trend has been +0.4 C since 1978, while the “data”sets with in-filled modeled temperatures show more like +0.7 C, meaning they’ve added another 0.3 C. Considering about +0.4 or +0.5 C has likely been removed from the 1930s/1940s peak, there is no telling whether or not 1998 or 2016 reached higher amplitudes than the 1940s. Indeed, the scientists below — whose data are not compromised by UHI and sighting compromises — find no significant differences between the 1930s/’40s and recent decades.
https://notrickszone.com/wp-content/uploads/2017/01/Northern-Hemisphere-Ljungqvist-2010.jpg
https://notrickszone.com/wp-content/uploads/2016/12/Holocene-Cooling-Alabama-Christy-McNider-16.jpg
https://notrickszone.com/wp-content/uploads/2016/12/Holocene-Cooling-New-York-Hudson-Valley-Tipton-16.jpg
https://notrickszone.com/wp-content/uploads/2016/12/Holocene-Cooling-Portugal-Moreno-16.jpg
https://notrickszone.com/wp-content/uploads/2016/12/Holocene-Cooling-Australia-SE-ODonnell-16-768×444.jpg
https://notrickszone.com/wp-content/uploads/2016/12/Holocene-Cooling-Irminger-Sea-North-Atlantic-de-Jong-16.jpg
https://notrickszone.com/wp-content/uploads/2016/12/Holocene-Cooling-Indian-Ocean-SSTs-Zinke-16-768×453.jpg
https://notrickszone.com/wp-content/uploads/2016/12/Holocene-Cooling-Greenland-Ogi16-copy.jpg
https://notrickszone.com/wp-content/uploads/2016/12/Holocene-Cooling-North-Atlantic-OHC-Serykh-16-768×377.jpg
https://notrickszone.com/wp-content/uploads/2016/12/Holocene-Cooling-Greenland-Southeast-Hasholt-16-1.jpg
https://notrickszone.com/wp-content/uploads/2016/12/Holocene-Cooling-Scotland-Rydval-16.jpg
https://notrickszone.com/wp-content/uploads/2016/12/Holocene-Cooling-China-Northeast-Zhu-16-copy-768×353.jpg
https://notrickszone.com/wp-content/uploads/2016/10/Holocene-Cooling-Antarctica-e-Southern-Ocean-SST-Jones16.jpg
https://notrickszone.com/wp-content/uploads/2016/12/Holocene-Cooling-Iceland-South-Chandler-16.jpg
https://notrickszone.com/wp-content/uploads/2016/12/Holocene-Cooling-Iberian-Range-Tejedor-16-768×361.jpg
https://notrickszone.com/wp-content/uploads/2016/10/Holocene-Cooling-Antarctica-Peninsula-Turner16-copy-768×312.jpg
https://notrickszone.com/wp-content/uploads/2016/12/Holocene-Cooling-India-Western-Himalaya-Sunkara-Tiwari-16-768×412.jpg
https://notrickszone.com/wp-content/uploads/2016/12/Holocene-Cooling-Greenland-Ice-Sheet-Zhao-16.jpg
https://notrickszone.com/wp-content/uploads/2016/12/Holocene-Cooling-Pakistan-Karakorum-Mountains-Zafar-16.jpg
https://notrickszone.com/wp-content/uploads/2016/12/Holocene-Cooling-Scandinavia-Zhang-16-768×422.jpg
https://notrickszone.com/wp-content/uploads/2016/12/Holocene-Cooling-Andes-South-America-De-Jong-16.jpg
https://notrickszone.com/wp-content/uploads/2016/10/Holocene-Cooling-Canada-Pitman-Smith-12-1940-1970-2000-copy-768×350.jpg
https://notrickszone.com/wp-content/uploads/2017/01/Holocene-Cooling-Northern-Europe-Rydval-17-768×382.jpg
https://notrickszone.com/wp-content/uploads/2017/01/Holocene-Cooling-Pyrenees-France-Spain-Rydval-17-768×463.jpg
https://notrickszone.com/wp-content/uploads/2017/01/Holocene-Cooling-European-Alps-Rydval-17-768×446.jpg
https://notrickszone.com/wp-content/uploads/2017/01/Holocene-Cooling-Arctic-Air-Temperature-Yamanouchi-11-copy.jpg
https://notrickszone.com/wp-content/uploads/2017/01/Holocene-Cooling-North-Atlantic-Central-England-Temps-Reynolds-17.jpg
https://notrickszone.com/wp-content/uploads/2017/01/Holocene-Cooling-Bahamas-Saenger-09.jpg
https://notrickszone.com/wp-content/uploads/2017/01/Holocene-Cooling-North-China-Li-17-768×425.jpg
” I challenge you to examine each one, sod. ”
This is the first link from your list.
https://notrickszone.com/wp-content/uploads/2017/01/Northern-Hemisphere-Ljungqvist-2010.jpg
can you please tell me, how i can find the temperature from 1941 on that graph and where you have hidden the error bars that i asked for?
I’m not going to take the time to point out how to use the bottom grid with years on it and line it up with the temperature trend at the top. That should be simple enough for you to understand. I haven’t “hidden” error bars from you. The graph comes directly from a just-published peer-reviewed paper (Li et al., 2017).
https://notrickszone.com/wp-content/uploads/2016/10/Holocene-Cooling-Global-Temps-1940-1970-2000-Gerhard-04-copy.jpg
https://notrickszone.com/wp-content/uploads/2016/10/Holocene-Cooling-Global-Temps-Gerhard-04-copy.jpg
Here is a graph of global temperature taken from Gerhard, 2004. I have labeled 1940, 1970, and 2000 for your convenience in the first link, and the second link shows the larger context. I don’t know if it’s possible to make this any simpler.
It’s rather pointless to provide information like this to you though, sod, as you have your beliefs that you’re going to stick with no matter how robust the counter-evidence is.
sop you are hilariously dopey..
Why do you want to restrict it the Little Ice Age and the period of highly beneficial warming out of that COLDEST PERIOD IN 10,000 YEARS.
Waiting for you to move to Siberia or Alaska.
I will believe you are worried about warming when you do that and live purely on renewable energy and carbon free food.
But you won’t will you..
Hypocritical little worm that you are.
“Why do you want to restrict it the Little Ice Age and the period of highly beneficial warming out of that COLDEST PERIOD IN 10,000 YEARS.”
because nobody cares about temperatures 10000 years ago.
But please, name me the single year in the 10000 year span, that was warmer than 2016 including error bars.
Except that it shows that we are actually at the COOL end of the current interglacial..
But you wouldn’t want that very salient FACT get in the way of your little anti-CO2 renewable scam, would you, sop.
We NEED warming (not that CO2 provides any), and plants most definitely NEED extra CO2.
As soon as that FACT becomes generally recognised, the so-called renewables, which WASTE money and provide nothing in the way of planetary sustenance, will be utter and completely destroyed.
No wonder you don’t want the truth about temperature history to come out !!!!
We still note that you have chosen NOT to avoid all this warming by moving to Siberia.
I bet you also have the coal or gas electricity powered heater on at the moment.
Hypocritical little sop.
TRUTH TIME Sop… (if you even know what the word means)
Are you using a heater, or have you in the last 2 weeks.. what energy source does it use?
Are you using coal/gas/nuclear electricity for any part of supply to your computer, refrigeration etc?
I’m perfectly willing to tell the truth, ARE YOU?
Here we go.
I had the air-con on for about 8 hrs the other day, because there was a westerly wind blowing which bring HEAT from the centre of Australia, and it was VERY WARM.. probably 40C outside !!!
Yes, I use EXCLUSIVELY coal fired electricity from the Hunter Valley, and run 2 computers 24/7 plus numerous other electrical appliances.
My electricity bill says I use as much as a 3 person house.. 🙂
(just me and a part time tenant)
Cooking and water are gas.
Now..
…. have the GUTS to tells us what sources of electricity, heating etc, YOU use.
ps.. I also drive a V8 Holden 🙂
Do you own a car.. if so… what type
Have you got once single ounce of TRUTH in you, sop..???
We are waiting.
ps.. remember .. TRUTH.
Only YOU will know if you are LYING.. so you will be LYING only to yourself.. (as if that ever mattered to you)
“Yes, I use EXCLUSIVELY coal fired electricity from the Hunter Valley.”
Actually, that may not be totally correct.
There may be some coming from Eraring Power Station on the central coast (coal fired).
And at times there may even be 0.0000000000X% coming from trivial local rooftop solar.
Not many people around here bother with that crap.
There used to be one Wind turbine a Kooragang, but that was remove a couple of years ago to make way for the new big coal loader.
That was a very strange turbine, it turned slowly when the wind blew, but turned faster when greenie politicians came to town, even when there was no wind.. quite bizarre really.
“…. have the GUTS to tells us what sources of electricity, heating etc, YOU use.”
I did never claim that i was using 100% renewables. What are you talking about and what is the purpose of this insane line of argument?
I knew you would decline.
Hypocritical weasel !!
“But please, name me the single year in the 10000 year span, that was warmer than 2016 including error bars.”
Any year during roughly the interval 7,000 to 3,000 years BC.
https://en.wikipedia.org/wiki/Holocene_climatic_optimum
That enough?
No really sod, we know what you’re playing and you know that we know, now come on tell us, are you an assistant professor at the institute for the spread of international Marxism-Leninism in Freiburg? There must be a reason for your insanely repetitive behaviour. Is it a medical condition?
“Any year during roughly the interval 7,000 to 3,000 years BC.”
no.
https://upload.wikimedia.org/wikipedia/commons/c/ca/Holocene_Temperature_Variations.png
You forgot to add the error bars. But just looking at the difference between those different reconstructions makes it utterly clear, that you will not be able to name a year that is warmer than 2016 when you factor in error bars.
sod, Wikipedia is not a reliable source of information on the paleoclimate. People like William Connolley personally altered and/or wrote over 5,000 Wikipedia entries so as to have Wikipedia reflect the views of the activists.
Did you read what was written above? There is a 0.02 C difference between 1998 and 2016 in both satellite datasets (RSS and UAH). That value (2/100ths of a degree) is much smaller than the error bars for each dataset. What that means is there is massive uncertainty as to whether 1998 or 2016 was warmer. We don’t know. Not only that, but reliable global data only extend back to 1978. The NASA, NOAA, HadCRUT datasets have all been compromised by data manipulation and UHI/sighting issues.
Pure ignorance. The USA48 is not cooling — its warmest years have been, in order, 2012, 2016, 2015.
10-yr trend = 1.6 F/decade
30-yr trend = 0.4 F/decade
Source:
NOAA USA48 monthly
http://www7.ncdc.noaa.gov/CDO/CDODivisionalSelect.jsp
[…] the “consensus” forecasts made 15 years ago, which warned that snow and ice would become rare. Defying IPCC Models, U.S. Blizzard Frequency Has Nearly Quadrupled Since 1960, As U.S. Continues Coo…. What Models Say: ♦ IPCC TAR (2001): “Milder winter temperatures will decrease heavy […]
[…] normal not warmer as can be seen by this preliminary analysis from NOAA CPC," says D'Aleo. Defying IPCC Models, U.S. Blizzard Frequency Has Nearly Quadrupled Since 1960, As U.S. Continues Coo…. What Models Say: ♦ IPCC TAR (2001): “Milder winter temperatures will decrease heavy […]