The statistics arm of the European Union, Eurostat, has released recent figures on energy consumption. They are a huge disappointment and show that the community has only succeeded at wasting hundreds of billions of euros, while having no impact on the climate.
EU energy consumption fell only a measly 2.5% from 1990 to 2015, eurostat reports.
Also the share of fossil fuels in total energy consumption in the EU remains stubbornly high:
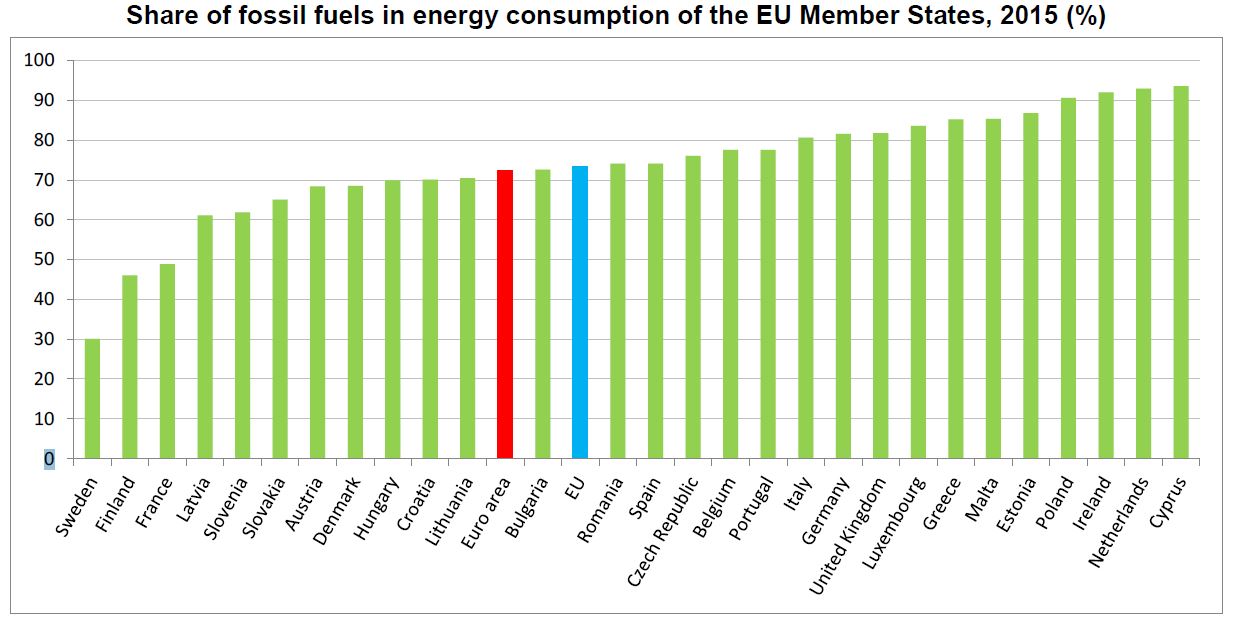
Despite committing an estimated 1 trillion euros in green energies, Europe remains intensively high with respect to fossil fuel consumption. Source: eurostat
For the money, Europe will contribute theoretically only a very few tenths of degree less warming to the global climate by the year 2100.
Though energy consumption in the EU is below its 1990 level, EU dependency on fossil fuel imports is on the rise:
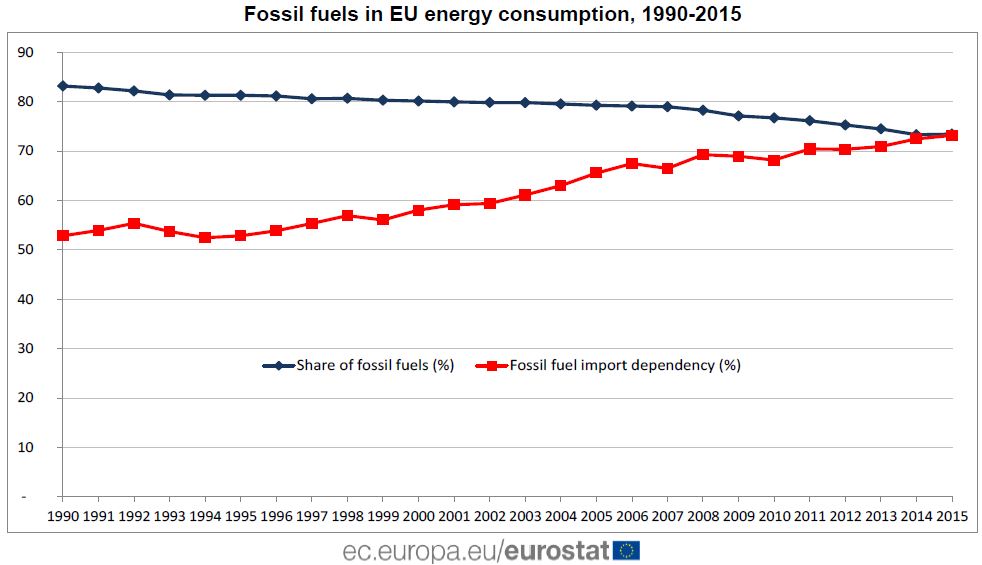
Source: eurostat.
In 2015, gross inland energy consumption, which reflects the energy quantities necessary to satisfy all inland consumption, amounted in the European Union (EU) to 1,626 million tonnes of oil equivalent (Mtoe), below its 1990 level (-2.5%) and down by 11.6% compared to its peak of almost 1,840 Mtoe in 2006.
Accounting for nearly three-quarters of EU consumption of energy in 2015, fossil fuels continued to represent by far the main source of energy, although their weight has constantly decreased over the past decades, from 83% in 1990 to 73% in 2015. However, over this period, EU dependency on imports of fossils fuels has increased, with 73% imported in 2015 compared with just over half (53%) in 1990.
In other words, while in 1990 one tonne of fossil fuels was imported for each tonne produced in the EU, by 2015 three tonnes were imported for each tonne produced.
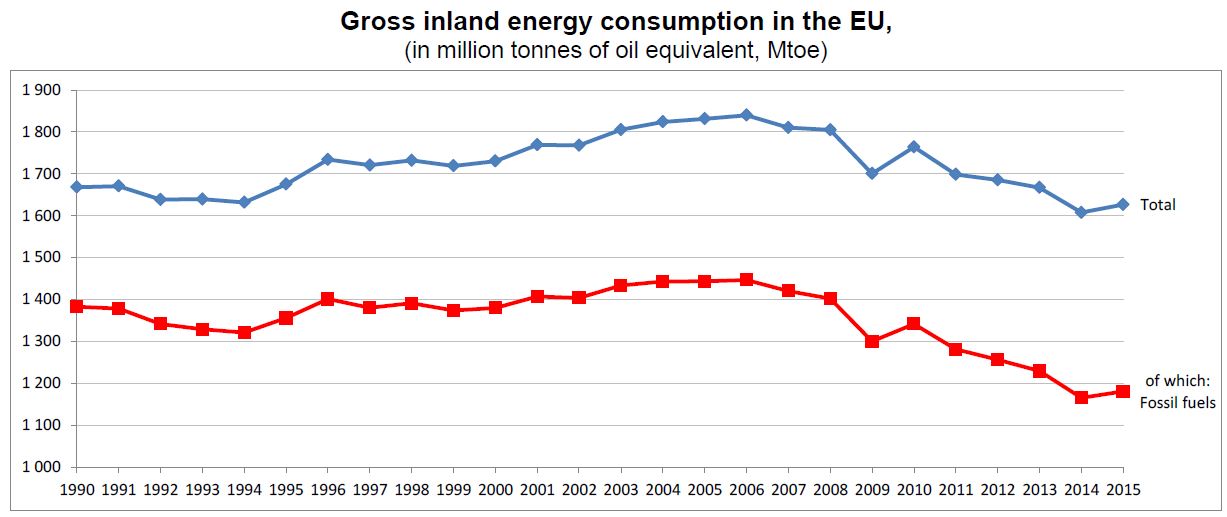
Source: eurostat.
Based on EU 2012 directives, EU renewable energy share is supposed to be at least 27% of the electric power production 2030. And according to an EU 2014 agreement, greenhouse gas emissions is supposed to be 40 percent less, a target that climate protection activists say is too little!
Though statistics showing considerable greenhouse gas reductions since 1990, the vast majority of it happened right after the shut down of the dilapidated, communist run industries in the first years after the fall of the Iron Curtain. There has been little progress since.


The unfortunate argument is that the euros spent PREVENTED a growth – hurray! We’re on the right track, just need to spend more!
Like the Precautionary Principle for future benefit, potentially created past benefit justifies prior actions without the necessity of proof
Trying to find Australia’s percentage fossil fuel usage.
Seems to be around 95% 🙂
How come it is never mentioned about what happens over the next 5-15 years when their green behemoths reach the end of their useful(less)life? That event would seem to be even more costly.
Neville seems to have it.
http://joannenova.com.au/2017/02/solar-homes-use-more-grid-electricity-than-non-solar-homes/#comment-1893608
Thanks. 🙂
From the chart here
http://www.iea.org/stats/WebGraphs/AUSTRALI4.pdf
I make it 93.3% from coal, oil, gas.
A HUGH 1.3% from intermittent wind and solar.
Nice point, thanks for bringing this up.
But please look at the graph first:
https://i.guim.co.uk/img/media/6e28357773e0fff6a59d2fa8bf72373ace51f8f3/0_0_976_586/master/976.jpg?w=620&q=20&auto=format&usm=12&fit=max&dpr=2&s=9f19b3ad093a87edd5cfc43073ae07ed
The graph shows a dramatic decrease in use of electricity (from 7000 or even 7500 to about 6000 kWh).
Two important informations are missing:
1. are those with solar using their own electricity or are they exporting it to the grid (and did this behaviour change during this time frame?)
2. How did the type of people change, who use solar during the time frame. (and what type of households does use solar, most likely single homes with a higher demand anyway)
The explanation given (solar PV users are wasting electricity) does not make any sense, as it would mean that they are having more additional use than the solar PV systems produce (they use more, even subtracting the output of the solar PV system).
the best explanation for that weird curve is a simple one: high penetration of solar PV in queensland (about 25%?) means, that all households with a big use (single homes) now have adapted to solar PV, leaving those with little use without solar.
The graph is massively misleading. I am pretty sure that a similar study will show, that households who grow their own vegetables in their garden still buy more vegetables in the supermarket than households who do not grow their own veggies. (they simply eat more of the green stuff).
MAKE IT UP as you go along, sob
Ignore the facts.
Its what you do.
Please explain the curves to me. Why did the electricity use of people with no solar drop from 7500 to 6000kWh?
https://i.guim.co.uk/img/media/6e28357773e0fff6a59d2fa8bf72373ace51f8f3/0_0_976_586/master/976.jpg?w=620&q=20&auto=format&usm=12&fit=max&dpr=2&s=9f19b3ad093a87edd5cfc43073ae07ed
Just keep making up nonsense answers, sob.
It will be very entertaining 🙂
But you will actually have to think rationally to come up with the correct one.
Good luck with that 😉
“Just keep making up nonsense answers, sob.”
you are making up stuff. You did not answer at all.
Nothing but insults and a cowardly silence on all things of substance.
“Why did the electricity use of people with no solar drop from 7500 to 6000kWh? – See more at: https://notrickszone.com/2017/02/24/eu-sees-almost-no-fossil-fuel-consumption-progress-despite-hundreds-of-billions-of-euros-invested/#sthash.KvhJYv7I.hwYwoSYX.dpuf”
maybe economising due to rising costs and no solar buffer? maybe over time more efficient lighting and appliances. In my case I have solar but never registered it so my house just looks like consumption has dropped, and whatever is left over they can have.
If sob doesn’t understand that there have been appliance and usage efficiency gains..
…. I can’t help the poor little twerp.
“maybe economising due to rising costs and no solar buffer?”
If this is the case, and such huge reductions are possible (7500 to 6000 kWh is a 20% drop!), rising costs are a tiny problem.
” maybe over time more efficient lighting and appliances.”
this would also have a effect on solar PV households.
” In my case I have solar but never registered it so my house just looks like consumption has dropped”
In this case,. your household would be in the wrong category. Then the point of the article is wrong.
“If sob doesn’t understand that there have been appliance and usage efficiency gains..”
these would have an effect on both groups.
Why are you ignoring the most simple explanation?
people are switching from the “high use, no solar” group to the “high use with solar” group.
This allows the “no solar” group to shrink its use (because big users are leaving this group) and keeps the solar group stable (as people with high use, even with use of solar join).
comparing two groups over time, when the switch between those groups is one way (people joining the solar group) is an utterly unscientific approach, the result is total garbage.
Let us look at facts again.
I found an old paper from 1998 for germany.
https://www.dbresearch.de/PROD/DBR_INTERNET_DE-PROD/PROD0000000000017130/Energiewirtschaft_im_Umbruch.PDF
It shows a small drop between 1997 and 2020 from 494 to 485 mio t (numbers differ a little, because they use other stuff)
your paper shows a drop from 356 (1990) to 342 (2005) to 314 (2015)
The real drop in energy use was much higher than what people thought it would be in 1998.
2020.. ?
oh real data , then. !! 😉
“2020.. ?
oh real data , then. !! ”
you are simply stupid.
This was a forecast-.
what i did demonstrate is, that reality is beating that forecast badly.
We have massively more renewables now, that people thought we would have in 2020 just 10 years ago.
The facts, they hurt you every time.
… forecasts are NOT facts, little child !!!
“… forecasts are NOT facts, little child !!!”
nothing but insults….
I did use a forecast by Deutsche Bank. They thought that renewables would expand much slower that they did in the real world.
You folks were wrong back then, and you are wrong now again.
The simple trick (using all fossil fuel use, when reduction is mostly in the field of electricity) will also start to fall apart soon, with the approach of electric cars.
When you can compare like periods and like sources, get back to us.
It seems the economic downturn might be taking effect, though.. just as planned.
A 1% drop in percentage use of fossil fuels in 10 years, with all that MASSIVE amount WASTED on renewables.
It really does make renewables look like a “WHY BOTHER” option, doesn’t it. 🙂
Why did you delete me comment? Did I miss something?
Comments sometimes appear to vanish into thin air.
Be patient, usually they will appear later, when the boss fishes them out of wherever they go to.
Towers, solar panels, and wood chips do nothing regarding global warming while destroying the natural environment.
Where has all that money gone? Because most of it is gone.
“Where has all that money gone?”
Green scammer pockets, of course. !
[…] would think that for all that effort, the CJWs would be able to point to countless benefits. They can’t. Their efforts are the epitome of misallocation or resources, inefficiency, ineffectiveness, pure […]