Scientists Exclude Water Vapour & Clouds
As Contributors To Recent Climate Change
The IPCC has long acknowledged that water vapour is the Earth’s most influential greenhouse gas.
“Water vapour is the primary greenhouse gas in the Earth’s atmosphere. The contribution of water vapour to the natural greenhouse effect relative to that of carbon dioxide (CO2) depends on the accounting method, but can be considered to be approximately two to three times greater.”
— IPCC AR5 Chapter 8, page 666
In the 2007 report, the IPCC reported an increasing water vapour trend during the 1980s to 2000s.
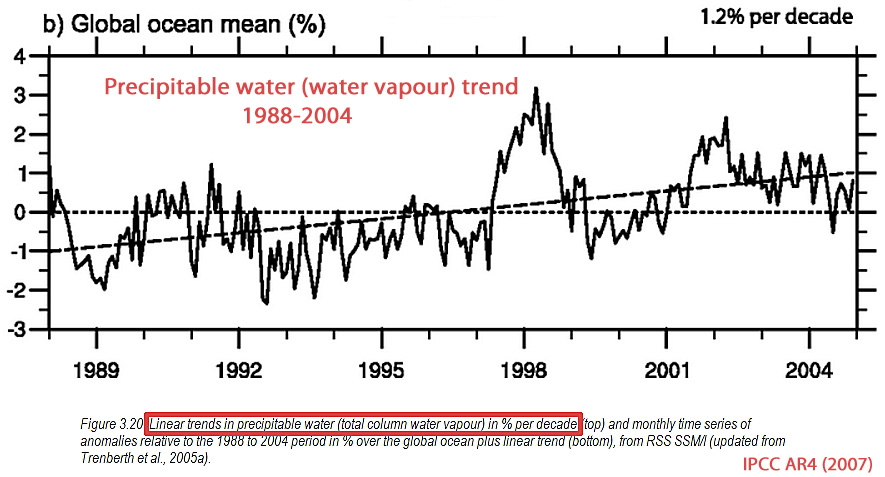
Utilizing the IPCC’s own figures and models (from the 4th report), water vapour’s proportional contribution to the total planetary greenhouse effect reaches a dominating 96%.
In contrast, CO2’s proportional radiative forcing contribution to the greenhouse effect is just 2.7% regardless of the CO2 concentration level.
“Calculation of Radiative Forcing (Warming Effect)
of Carbon Dioxide At Any Concentration”
Lightfoot and Mamer, 2014
“Figure 7 is FAQ 1.1 Figure 1 from page 96 of AR4 [IPCC, 2007]. It shows the radiation balance for the earth and that the back radiation of all of the greenhouse gases is 324 W m-2. This is the value used to calculate the RF [radiative forcing] of CO2 at 378 ppmv as (8.67/324)/100 = 2.7% back radiation of the total of all of the greenhouse gases. … From Table 1, CO2 accounts for 2.7% of the global warming while all of the other gases [i.e., methane] account for approximately 0.7% for a total of approximately 3.4%. It becomes evident that, on average, water vapour accounts for approximately 96% of the current global [greenhouse effect] warming. This is an important finding because it leads to the conclusion that the factors controlling the average level of water vapour in the atmosphere also control atmospheric temperature.”
“[O]n average, each molecule of CO2 is surrounded by approximately 23 molecules of water vapour at ground level [i.e., water vapour is 23 times more abundant in the atmosphere than CO2]. … If the warming effect of water molecules and CO2 molecules were the same, then the contribution of CO2 would be (1/22.7) = 4.4% of that of water vapour. But from the previous section, water molecules are 1.6 times more effective at warming than CO2 molecules. Using this value and the ratio of 22.7:1, the contribution of CO2 to warming of the atmosphere is approximately (1/22.7)/1.6 = 2.8% of that of water vapour. As water vapour is approximately 96% of the total RF of all of the GHG, the contribution of CO2 is approximately 4% less than this, i.e., 2.69%. If the average RH were 60%, the contribution of CO2 would be ((1/27.4)/1.32) x 0.96 = 2.65%. For practical purposes, these values are the same as the 2.7% obtained by the quadratic model.”
Cloud Radiative Forcing
In a seminal paper (currently 1,440 citations) published in the journal Science entitled “Cloud-radiative forcing and climate…”, Ramanathan et al. (1989) conclude that the cloud contribution to radiative forcing (both shortwave and longwave) is ten times greater than doubled CO2.
Ramanathan et al., 1989 “The size of the observed net cloud forcing is about four times as large as the expected value of radiative forcing from a doubling of CO2. The shortwave and longwave components of cloud forcing are about ten times as large as those for a CO2 doubling.”
Cloud cover changes are significant determinants of the Earth’s top-of-atmosphere (TOA) radiation imbalance, or how much solar radiative forcing is absorbed by the Earth’s surface (oceans).
Wielicki et al., 2002 “It is widely assumed that variations in Earth’s radiative energy budget at large time and space scales are small. We present new evidence from a compilation of over two decades of accurate satellite data that the top-of-atmosphere (TOA) tropical radiative energy budget is much more dynamic and variable than previously thought. Results indicate that the radiation budget changes are caused by changes in tropical mean cloudiness.”
More cloud cover on a net global scale means less solar radiation penetrates the surface, which leads to a net cooling, and less cloud cover means more solar radiation penetrates into the (ocean) surface, which ultimately leads to net warming trend. In other words, clouds significantly determine global warming (or cooling) trends.
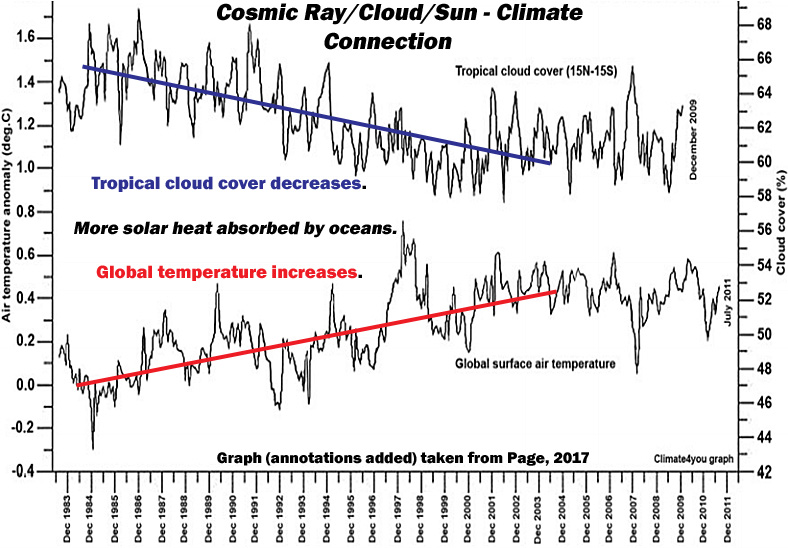
Graph from Page, 2017
McLean, 2014 “The reduction in total cloud cover of 6.8% [between 1984 – 2009] means that 5.4 Wm−2 (6.8% of 79) is no longer being reflected but acts instead as an extra forcing into the atmosphere… To put this [5.4 Wm-2 of solar radiative forcing via cloud cover reduction between 1984-2009] into context, the IPCC Fifth Assessment Report…states that the total anthropogenic radiative forcing for 2011 relative to 1750 is 2.29 Wm−2 for all greenhouse gases and for carbon dioxide alone is 1.68 Wm−2. The increase in radiative forcing caused by the reduction in total cloud cover over 10 years is therefore more than double the IPCC’s estimated radiative forcing for all greenhouse gases and more than three times greater than the forcing by carbon dioxide alone [from 1750 to present].”
Goode and Palle, 2007 “The decrease in Earth’s reflectance from 1984 to 2000 … translates into a Bond albedo decrease of 0.02 (out of the nominal value of about 0.30) or an additional global shortwave forcing of 6.8 Wm2. To put that in perspective, the latest IPCC report (IPCC, 2001) argues for a 2.4 Wm2 increase in CO2 longwave forcing since 1850. The temporal variations in the albedo are closely associated with changes in the cloud cover.”
New Paper Excludes Water Vapour, Clouds As Climate Contributors
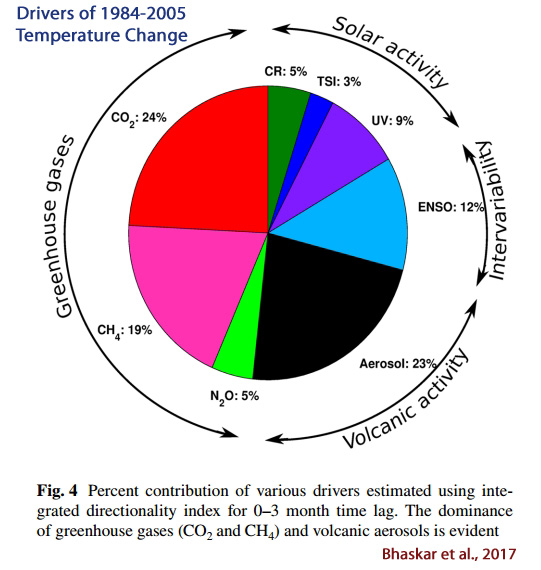
Despite the widely recognized prominence of water vapour and clouds in models of greenhouse forcing, a new paper published in Climate Dynamics fails to even identify either factor as a contributor to global temperature changes during the 1984-2005 period.
Instead, the 5 authors have decided that carbon dioxide (24%) and methane (19%) are the dominant greenhouse drivers of recent temperature variations, and water vapour and clouds apparently no longer assume any role. Meanwhile, the authors do recognize natural solar forcing factors (17% combined), natural ENSO variability (12%), and volcanic aerosols (23%) as assuming slightly more than half of the responsibility for temperature changes combined since the mid-1980s.
“Quantitative Assessment of Drivers of
Recent Global Temperature Variability”
Bhaskar et al., 2017
“Quantitative assessment of drivers of recent [1984-2005] global temperature variability … Measurements of greenhouse gases: CO2, CH4 and N2O; volcanic aerosols; solar activity: UV radiation, total solar irradiance (TSI) and cosmic ray flux (CR); El Niño Southern Oscillation (ENSO) and Global Mean Temperature Anomaly (GMTA) made during 1984–2005 are utilized to distinguish driving and responding signals of global temperature variability.”
“Estimates of their relative contributions reveal that CO2 (∼24%), CH4 (∼19%) and volcanic aerosols (∼23%) are the primary contributors to the observed variations in GMTA [Global Mean Temperature Anomaly]. While UV (∼9%) and ENSO (∼12%) act as secondary drivers of variations in the GMTA, the remaining play a marginal role in the observed recent global temperature variability. Interestingly, ENSO and GMTA mutually drive each other at varied time lags. … [A]ll the constituents of natural forcings together seem to make contributions equal to the greenhouse gases in the context of recent global temperature variability.”
Methane: A Primary Driver Of Recent Temperature Change?
It would appear rather odd that Bhaskar et al. (2017) would wish to claim, for example, that methane gas has been a significant driver of warming, but at the same time reject water vapour and cloud cover changes as factors affecting global temperatures.
It is likely, though, that the main reason why these authors chose to aggrandize the influence of methane emissions on climate is because it is not currently acceptable to claim that human activity plays only a small role (<25%) in temperature variations. Therefore, adding methane emissions to the list of anthropogenic dangerous “greenhouse gases” could bolster the perceived human influence percentage to within “acceptable” ranges (near 50%).
However, recently published scientific papers contravene this approach and indicate that (a) we just don’t have substantial observational evidence yet to attribute cause to a the rise in methane, (b) methane emissions may not have increased recently after all, and (c) human activity (fossil fuel consumption) has not been the “dominant factor” driving the (assumed) increase in methane.
Turner et al., 2017 [press release] ” We conclude that the current surface observing system does not allow unambiguous attribution of the decadal trends in methane without robust constraints on OH variability, which currently rely purely on methyl chloroform data and its uncertain emissions estimates. … [M]ethane emissions might not have increased dramatically in 2007 after all. … When atmospheric concentrations of methane increase, it may not be correct to chalk it up solely to an increase in methane emissions”
Ruppel and Kessler, 2017 “[T]here is no conclusive proof that the released methane is entering the atmosphere at a level that is detectable against the [natural] background of ~555 Tg yr−1 CH4 emissions. The IPCC estimates are not based on direct measurements of methane fluxes from dissociating gas hydrates, and many numerical models adopt simplifications that do not fully account for sinks, the actual distribution of gas hydrates, or other factors, resulting in probable overestimation of emissions to the ocean-atmosphere system.”
Nisbet et al., 2016 “The isotopic evidence presented here suggests that the methane rise was dominated by significant increases in [naturally occurring] biogenic methane emissions … [T]he sustained shift to more 13C-depleted values and its significant interannual variability, and the tropical and Southern Hemisphere loci of post-2007 growth, both indicate that fossil fuel emissions have not been the dominant factor driving the increase.”
A Skeptical Conclusion
CO2’s alleged 24% contribution to temperature changes since the 1980s (Bhaskar et al., 2017) is substantially smaller than most estimates. NASA’s Dr. Gavin Schmidt, for example, claims that the human contribution to climate changes since the mid-20th century is 110%.
As suggested above, the dubious inclusion of methane as a driver of planetary temperatures may have been added to expand the (perceived) anthropogenic contribution to climate change.
Likewise, Bhaskar et al. (2017) may be tendentiously excluding variations in natural factors like clouds and water vapour in their attribution analysis because they wish to avoid having to explain why the contribution from human activity is modest to negligible for recent decades.
When the results don’t fit the narrative, change the results.


In 1967 van der Hulst devised a modified Mie calculation to reduce the number of Lagrangian terms when solving for back-reflection from large droplets. This was needed to reduce the calculation time. In 1969 Hansen found that predicted ‘reflectivity’ was the same as a full calculation. Unfortunately both workers failed to understand that the second and subsequent scattering processes were very different from a plane wave (30,000 times more for 500 microns radius).
Hansen concluded that the 2nd AIE offset CO2-AGW. However, his and van der Hulst’s mistake reversed the sign: much if not all recent AGW was from the effect of manmade aerosols reducing cloud albedo.
So, the climate scam has for 50 years been based on a fundamental mistake in aerosol optical physics. As for CO2-AGW, the water cycle completely offsets it. The reason appears to be thermodynamic in origin; near constant radiation entropy generation in the lower atmosphere.
The 2nd AIE and changes in the thermohaline circulation explain Milankovitch amplification. As for Arctic melt freeze cycle and Antarctic freezing, both are the result of the response of the planet to the 1980s – 1990s heat accumulation. Because this heating has been assumed to be from CO2, the GCMs are wrong, particularly the positive feedback, which is an artefact. We are now entering the new LIA so expect 30 to 50 years cooling.
Declaration: I am not a climate alchemists because no-one would employ an heretic. However, many new papers are being published from heretics now the alchemists are accepting they have made very fundamental mistakes.
The alchemists made a fundamental aerosol optical physics error in 1969 (Hansen). In 1976 R D Cess got the radiative physics wrong. GISS backed this up using negative convection, which does not exist. The late husband of Julia Slingo, who became UKMO’s Chief Scientist, devised an incorrect Kirchhoff’s Radiation Law replacement based on the incorrect optical physics.
That incorrect physics is being dumped by the UKMO to prevent the UK taxpayer from understanding that they were duped for political reasons – the positive feedback is a modelling artefact. Real CO2-AGW does exist but mostly offset by the water cycle: the cause is thermodynamic, minimisation of radiation entropy change from the stable level for a given THC. The increase of Antarctic pack ice is the main result of the planet’s stabilisation process.
Has anyone bothered to analyse the impact the ever increasing amount of pastoral irrigation going on and how spraying vast volumes of water into the sky might just correlate with an increase in temperature?
@Bulaman
Water vapor appears to give negative, not positive, feedback.
https://m.youtube.com/watch?v=Y2K1uHvfaek
Of course the situation is much more complicated, but it is important to start with correct basic principles.
That’s not what the climate models say. The models claim that the 1.2 C warming from doubled CO2 (560 ppm) will reach 3.0 C and up due primarily to positive feedbacks with water vapor. In other words, the models say that water vapor feedback will cause more warming than CO2 itself.
The science is settled on this. For example:
http://www.sciencedaily.com/releases/2014/02/140202111055.htm
“The satellite observations have shown that warming of the tropical Indian Ocean and tropical Western Pacific Ocean — with resulting increased precipitation and water vapor there — causes the opposite effect of cooling in the TTL region above the warming sea surface. Once the TTL cools, less water vapor is present in the TTL and also above in the stratosphere. Since water vapor is a very strong greenhouse gas, this effect leads to a negative feedback on climate change. That is, the increase in water vapor due to enhanced evaporation from the warming oceans is confined to the near- surface area, while the stratosphere becomes drier. Hence, this effect may actually slightly weaken the more dire forecasted aspects of an increasing warming of our climate, the scientists say.”
I am always amazed that the physics of clouds have never been adequately researched. There is no complete and coherent theory and observations of how they work. Thus surely our understanding of climate (and weather) without proper recognition for this major player is very incomplete.
So ‘climate science’ is just a work in progress and should not be relied on to produce credible outcomes.
Much of the physics is well-known and well-understood. The problem can be with applying the knowledge. Clouds block radiation and the more dense the cloud is the more radiation is blocked (e.g. cummulonimbus clouds block a lot, cirrus clouds block very little) so you need to know the cloud density before you can work out how much is blocked.
The next problem is the radiation, or more correctly which way it is going. Clouds during the day cause lower temperatures (assuming no wind) and clouds at night cause warmer than normal temperatures because heat isn’t radiating into space. A cloudy night after a bright sunny day can mean quite warm overnight temperatures. But … in high latitudes (eg. northern Scandinavia) cloudy days in November and December are typically warmer than cloud-free days because the Earth’s surface has a net radiation loss at the time (i.e. outgoing heat loss exceeds radiation received from the sun).
The influence of clouds is a complex issue and very difficult to include in climate models.
I’ve lived and worked many years in desert regions and often noted the extreme temperature drop at night when seeing was good for my astronomy habit. When seeing was not so good, higher humidity, temperature did not drop as much. Was this a warming? At night? NO! It was a delay in cooling and still not a cloud in sight.
Have observed this same effect here in the UK when after a warm sunny day with very light wind, temperature starts to drop quite rapidly after sunset. All normal. Now if an extensive cloud bank arrives overhead temperature can rise! Again, is this warming? NO! It is normal surface radiation reducing under radiation from cloud overhead. The rise in temperature was the heat capacity of the ground.
Never has there heard so loud,
The silent UN’s modeled cloud.
Nor bright sun could melt the fright,
And debunk CO2’s feigned might.
I want give credit here where credit is due. A write-up of my paper by Dr Roy Spencer indicated that I over-stated the increase in insolation due to a reduction in cloud cover I didn’t take certain factors into account. Judith Curry made a similar but less detailed statement on her blog. I accept both statements but at the same time point out that my aim was to show the change was in the ball-park regards IPCC estimates of warming, not factors of ten away from from it.
As for this new paper, it sounds like nonsense. My paper showed the very strong link between the ENSO and the global average temperature anomaly a few months later over the period from 1950 to 1987 and other papers have made similar findings. The two graph lines coincided very well, except for periods of volcanic eruptions in the tropical Pacific, and there was no sign of the gradual divergence that one would expect if CO2 had anything above a negligible influence.
If there’s no sign of CO2-driven warming from 1950 to 1987 then it’s illogical to expect CO2-driven warming to suddenly become significant after that period. Data for cloud cover is admittedly limited but the data we do have indicates a reduction in total cloud cover and a shift from low level cloud to mid and upper level cloud. From what’s known about clouds and the Earth’s energy balance these changes would lead to higher temperatures.
Your RF values for cloud cover reduction seemed to be similar to several other analyses. For example:
http://onlinelibrary.wiley.com/doi/10.1029/2008JD011290/abstract
Global solar irradiance showed a significant fluctuation during the last 90 years. It increased from 1920 to 1940s/1950s, thereafter it decreased toward late 1980s. In early 1990s 75% of the globe indicated the increasing trend of solar irradiance, while the remaining area continued to lose solar radiation. The magnitudes of the variation are estimated at +12 W m 2 [1920-1940s/1950s], – 8 W m 2 [1950s-1980s], and +8 Wm2 [early 1990s-2005], for the first brightening, for the dimming, and the recent brightening periods, respectively.
ftp://bbso.njit.edu/pub/staff/pgoode/website/publications/Palle_etal_2005a_GRL.pdf
Traditionally the Earth’s reflectance has been assumed to be roughly constant, but large decadal variability, not reproduced by current climate models, has been reported lately from a variety of sources. There is a consistent picture among all data sets by which the Earth’s albedo has decreased over the 1985-2000 interval. The amplitude of this decrease ranges from 2-3 W/m2 to 6-7 W/m2 but any value inside these ranges is highly climatologically significant and implies major changes in the Earth’s radiation budget.
http://nml.yonsei.ac.kr/front/bbs/paper/rad/RAD_2005-3_Wild_et_al.pdf
A similar reversal to brightening in the 1990s has been found on a global scale in a recent study that estimates surface solar radiation from satellite data. This indicates that the surface measurements may indeed pick up a largescale signal. The changes in both satellite derived and measured surface insolation data are also in line with changes in global cloudiness provided by the International Satellite Cloud Climatology Project (ISCCP), which show an increase until the late 1980s and a decrease thereafter, on the order of 5% from the late 1980s to 2002. A recent reconstruction of planetary albedo based on the earthshine method, which also depends on ISCCP cloud data, reports a similar decrease during the 1990s. Over the period covered so far by BSRN (1992 to 2001), the decrease in earth reflectance corresponds to an increase of 6 W m-2 in absorbed solar radiation by the globe. The overall change observed at the BSRN sites, estimated as an average of the slopes at the sites in Fig. 2A, is 0.66 W m-2 per year (6.6 W m-2 over the entire BSRN period).
[…] Ho trovato un articolo molto ben fatto che ci aiuta a tenere traccia del modo in cui la Scienza scienza ufficiale si sta muovendo rispetto alla solita narrativa: gli scienziati escludono Vapore Acqueo e Nuvole come elementi che contribuisco al recente cambiament…. […]
[…] Willy-nilly the results speak for themselves, and it’s no wonder the Director General was fretful. Jasper Kirkby of CERN and his 62 co-authors, from 17 institutes in Europe and the USA, announce big effects of pions from an accelerator, which simulate the cosmic rays and ionize the air in the experimental chamber. A breach of etiquette Enlightening chemistry The experiment’s logo. New Paper Attributes 24% Of Temperature Changes To CO2 … Ignores Dominance Of Water Vapour, Clouds. […]