Sea Levels Meters Higher While
CO2 Levels Were Below 300 ppm
Image Yoon et al., 2017
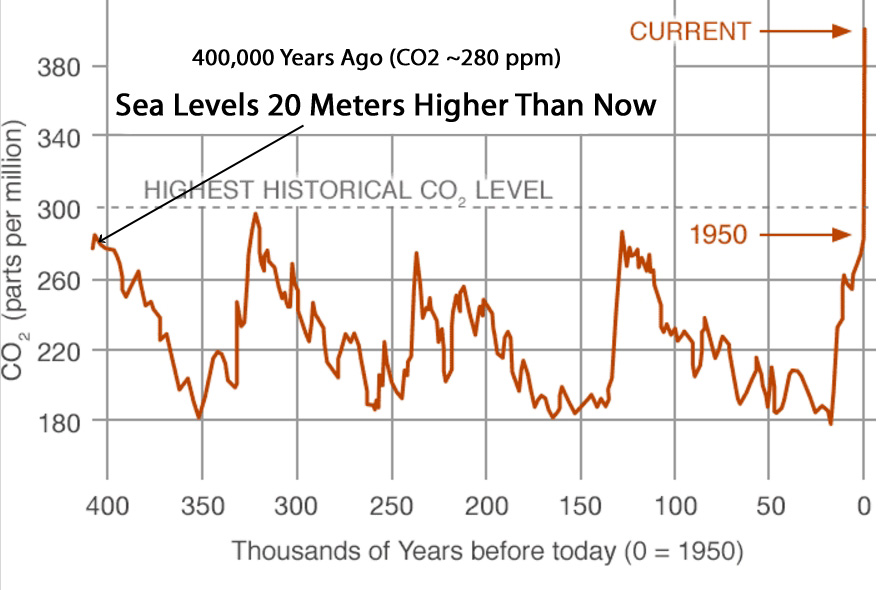
Before the advent of the industrial revolution in the late 18th to early 19th centuries, carbon dioxide (CO2) concentrations hovered around 280 parts per million (ppm).
Within the last century, atmospheric CO2 concentrations have risen dramatically. Just recently they eclipsed 400 ppm.
Scientists like Dr. James Hansen have concluded that pre-industrial CO2 levels were climatically ideal. Though less optimal, atmospheric CO2 concentrations up to 350 ppm have been characterized as climatically “safe”. However, CO2 concentrations above 350 ppm are thought to be dangerous to the Earth system. It is believed that such “high” concentrations could lead to rapid warming, glacier and ice sheet melt, and especially catastrophic sea level rise of 10 feet within 50 years.
It is interesting to note these prognostications of impending deluge are predicated on the assumption that CO2 concentrations are a driver of sea level fluctuations.
Scientists have determined that during the interglacial 400,000 years ago (MIS 11), CO2 peaked at a very safe 280 parts per million (ppm). Despite such a low and “ideal” CO2 concentration, scientists have determined that sea levels during that interglacial were 20 meters higher than than they are now.
“The upper 250 meter-long sediment core of Site U1391 (1085 m water depth) retrieved from the Portuguese margin in the Northeast Atlantic Ocean was adopted for the benthic foraminiferal analyses to disclose the variations in Mediterranean Outflow Water (MOW) intensity over the last ~ 0.9 Ma [900,000 years]. The strongest MOW [Mediterranean Outflow Water] intensity during MIS 11 [400,000 years ago] confirms the climatic influence of waving sea level on the MOW current by its +20 m high-stand above the present sea level.”
CO2 graph courtesy of NASA.gov
Sea Levels 6-8 Meters Higher 6-9 Thousand Years Ago (~260 ppm CO2)
Although most scientists have found that the Holocene’s (~11,700 years ago to present) sea level peaks (highstands) were between 1 and 4 meters higher than present, there are some who have found that Early Holocene sea levels reached as high as 6 to 8 meters above mean sea level today.
“Analysis of the RSL [relative sea level] database revealed that the RSL [relative sea level] rose to reach the present level at or before c. 7000 cal yr BP, with the peak of the sea-level highstand c. +4 m [above present] between c. 6000 and 5500 cal yr BP [calendar years before present] … This RSL [relative sea level] curve was re-plotted by Gyllencreutz et al. (2010) using the same index points and qualitative approach but using the calibrated ages. It shows rising sea-levels following the Last Glacial Termination (LGT), reaching a RSL [relative sea level] maximum of +6.5 m above present at c. 6500 cal yr BP [calendar years before present], followed by a stepped regressive trend towards the present.”

“Rapid early Holocene sea-level rise in Prydz Bay, East Antarctica … The field data show rapid increases in rates of relative sea level rise of 12–48 mm/yr [+1.2 to 4.8 meters per century] between 10,473 (or 9678) and 9411 cal yr BP in the Vestfold Hills and of 8.8 mm/yr between 8882 and 8563 cal yr BP in the Larsemann Hills. … The geological data imply a regional RSL [relative sea level] high stand of c. 8 m [above present levels], which persisted between 9411 cal yr BP and 7564 cal yr BP [calendar years before present], and was followed by a period when deglacial sea-level rise was almost exactly cancelled out by local rebound.”

Recent Sea Level Rise Undetectable When Viewed In Its Long-Term Context
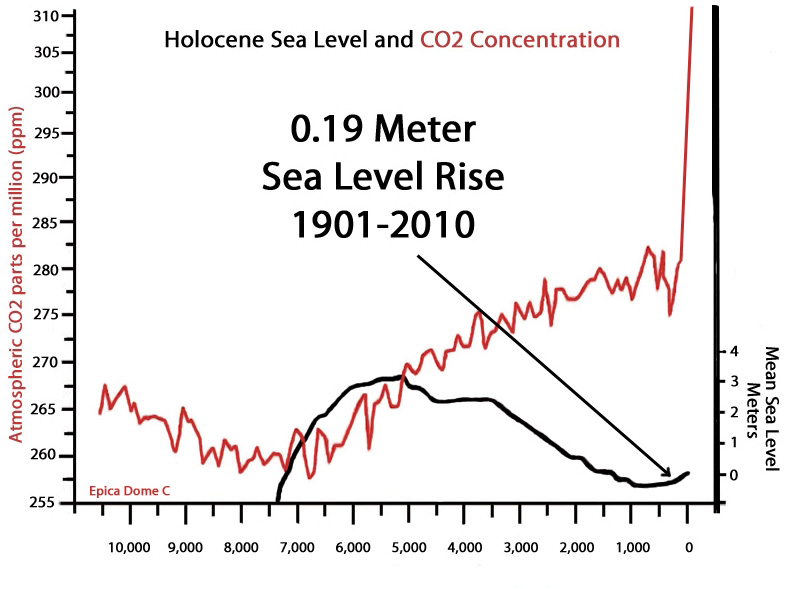
Despite the surge in anthropogenic CO2 emissions and atmospheric CO2 since the 20th century began, the UN’s Intergovernmental Panel on Climate Change (IPCC) has concluded that global sea levels only rose by an average of 1.7 mm/yr during the entire 1901-2010 period, which is a rate of less than 7 inches (17 cm) per century and an overall rise of just 0.19 of a meter in 110 years.
According to Wenzel and Schröter (2014), the acceleration rate for the sea level rise trend since 1900 has been just +0.0042 mm/yr, which is acknowledged by the authors to be “not significant” and well within the larger range of uncertainty (+ or – 0.0092 mm/yr), effectively putting the overall 20th/21st century sea level rise acceleration rate at nearly zero.
As mentioned, most scientists have found that sea levels were about 1 – 4 meters higher than they are now between 4,000 and 6,000 years ago (when CO2 concentrations were about 260 to 265 ppm). It may therefore be enlightening to visualize the overall nineteen hundredths of a meter (0.19) rise in sea levels since 1901 in its long-term (Holocene) context. Assuming a sea level highstand of about 2.5 meters above present during the Mid-Holocene, notice how modest the recent rise appears.
10 More New Papers Affirm Sea Levels Were Much Higher 4-6 Thousand Years Ago
In the last few years alone (2014 to 2016), there were at least 35 papers published in the peer-reviewed scientific literature indicating that sea levels were substantially higher than they are now just a few thousand years ago…when CO2 concentrations are thought to have been “safe”.
In 2017, there have already been another 10 scientific papers published that can be added to this growing list.
It is becoming more and more apparent that sea levels rise and fall without any obvious connection to CO2 concentrations. And if an anthropogenic signal cannot be conspicuously connected to sea level rise (as scientists have increasingly noted), then the greatest perceived threat (rising sea levels) promulgated by advocates of dangerous anthropogenic global warming will have lost its impact.
1. Das et al., 2017 (India)
“In the absence of any evidence of land-level changes, the study suggests that at around 6 ka to 3 ka [6,000 to 3,000 years ago], the sea was approximately 2 m higher than present.”
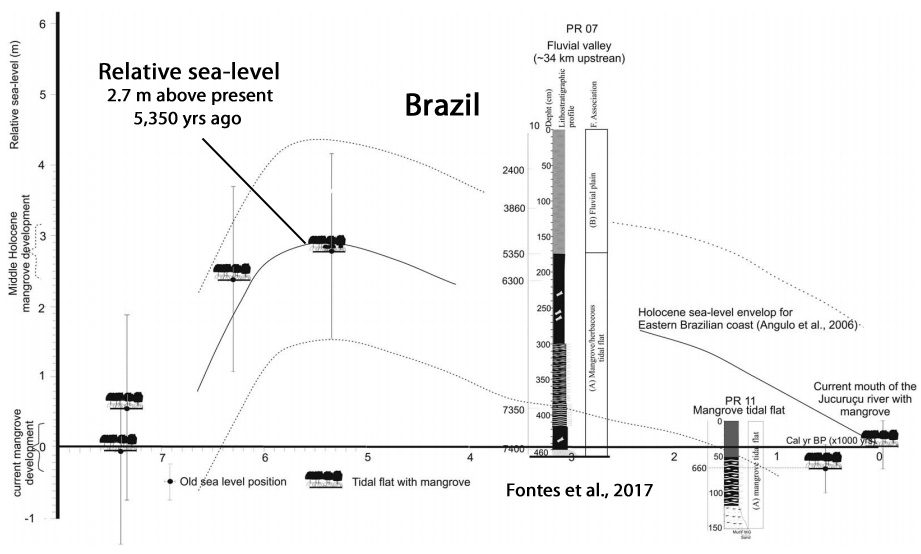
2. Fontes et al., 2017 (Brazil)
“During the early-middle Holocene there was a rise in RSL [relative sea level] with a highstand at about 5350 cal yr BP [calendar years before present] of 2.7 ± 1.35 m [higher than present], which caused a marine incursion along the fluvial valley.”
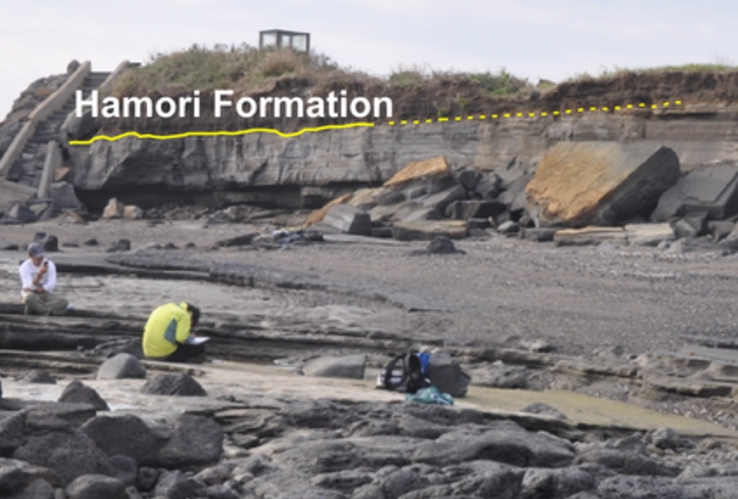
3. Yoon et al., 2017 (Korea)
“Songaksan is the youngest eruptive centre on Jeju Island, Korea, and was produced by a phreatomagmatic eruption in a coastal setting c. 3.7 ka BP [3,700 years before present]. The 1 m thick basal portion of the tuff ring shows an unusually well-preserved transition of facies from intertidal to supratidal, from which palaeo-high-tide level and a total of 13 high-tide events were inferred. Another set of erosion surfaces and reworked deposits in the middle of the tuff ring, as high as 6 m above present mean sea level, is interpreted to be the product of wave reworking during a storm-surge event that lasted approximately three tidal cycles. … The reworked deposits alternate three or four times with the primary tuff beds of Units B and C and occur as high as 6 m above present mean sea level or 4 m above high-tide level (based on land-based Lidar terrain mapping of the outcrop surface).”
4. Marwick et al., 2017 (full pdf) (Thailand)
“Sinsakul (1992) has summarised 56 radiocarbon dates of shell and peat from beach and tidal locations to estimate a Holocene sea level curve for peninsula Thailand that starts with a steady rise in sea level until about 6 k BP, reaching a height of +4 m amsl (above [present] mean sea level). Sea levels then regressed until 4.7 k BP, then rising again to 2.5 m amsl at about 4 k BP. From 3.7 k to 2.7 k BP there was a regressive phase, with transgression starting again at 2.7 k BP to a maximum of 2 m amsl at 2.5 k BP. Regression continued from that time until the present sea levels were reached at 1.5 k BP. … Tjia (1996) collected over 130 radiocarbon ages from geological deposits of shell in abrasion platforms, sea-level notches and oyster beds and identified a +5 m [above present] highstand at ca. 5 k BP in the Thai-Malay Peninsula. … Sathiamurthy and Voris (2006) summarise the evidence described above as indicating that between 6 and 4.2 k BP, the sea level rose from 0 m to +5 m [above present] along the Sunda Shelf [+2.8 mm/yr], marking the regional mid-Holocene highstand. Following this highstand, the sea level fell gradually and reached the modern level at about 1 k BP [1,000 years ago].”
5. May et al., 2017 (W. Australia)
“[T]he mid-Holocene sea-level highstand of Western Australia [was] at least 1–2 m above present mean sea level. … Between approximately 7000 and 6000 years BP, post-glacial RSL [relative sea level] reached a highstand of 1-2 m above the present one, followed by a phase of marine regression (Lambeck and Nakada, 1990; Lewis et al., 2013).”
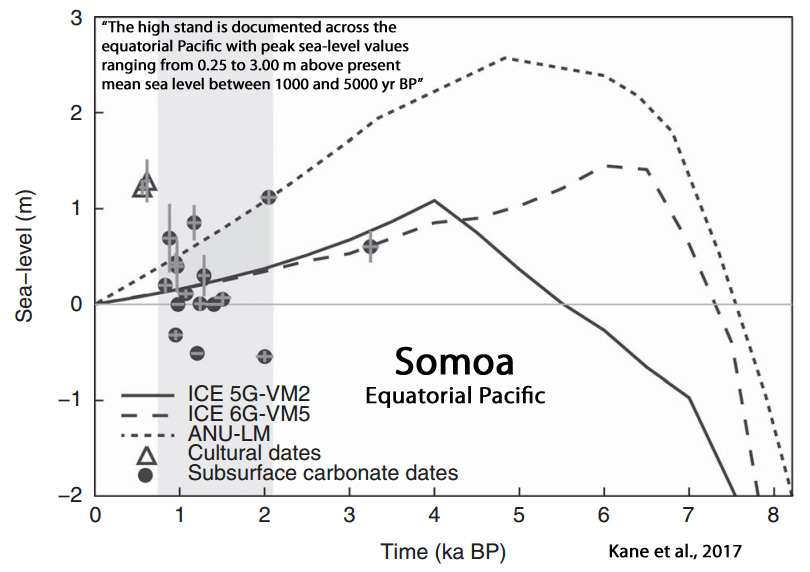
6. Kane et al., 2017 (Equatorial Pacific)
“The high stand is documented across the equatorial Pacific with peak sea-level values ranging from 0.25 to 3.00 m above present mean sea level (MSL) between 1000 and 5000 yr BP (Fletcher and Jones, 1996; Grossman et al., 1998; Dickinson, 2003; Woodroffe et al., 2012). Woodroffe et al. (2012) argues that Holocene sea-level oscillations of a meter or greater are likely to have been produced by local rather than global processes.”
7. Khan et al., 2017 (Caribbean)
“Only Suriname and Guyana [Caribbean] exhibited higher RSL [relative sea level] than present (82% probability), reaching a maximum height of ∼1 m [above present] at 5.2 ka [5,200 years ago]. … Because of meltwater input, the rates of RSL change were highest during the early Holocene, with a maximum of 10.9 ± 0.6 m/ka [1.9 meters per century] in Suriname and Guyana and minimum of 7.4 ± 0.7 m/ka [0.74 meters per century] in south Florida from 12 to 8 ka [12,000 to 8,000 years ago].”
8. Meltzner et al., 2017 (Southeast Asia)
“Half-metre sea-level fluctuations on centennial timescales from mid-Holocene corals of Southeast Asia … RSL [relative sea level] history between 6850 and 6500 cal years BP that includes two 0.6 m fluctuations, with rates of RSL [relative sea level] change reaching 13±4 mm per year. … Here RSL [relative sea level] rose to an initial peak of +1.9 m [above present] at 6,720 cal years BP, then fell rapidly to a lowstand of +1.3 m, remaining at about that level for ∼100 years, before rising to a second peak at +1.7 m shortly after 6,550 cal years BP. Around 6,480 cal years BP, RSL appears to have fallen again to +1.3 m before rising to a third peak at +1.6 m or higher. … The peak rate of RSL rise, averaged over a 20-year running time window over the period of study (∼6,850–6,500 cal years BP), is +9.6±4.2 mm per year (2σ); the peak rate of RSL fall is −12.6±4.2 mm per year. … To put the ∼0.6 m mid-Holocene fluctuations in context, annual mean sea level in some modern tide-gauge records is seen to change by as much as 0.2–0.3 m on interannual timescales, and the interannual s.d. of sea surface height between 1979 and 2013 approached 0.1 m in some portions of the western Pacific. The central dome of each microatoll grew during a period when RSL was high; RSL then fell rapidly, killing the upper portions of the corals; RSL then stabilized at a lower elevation, forming a series of low concentric annuli ∼0.6 m higher than present-day analogues; RSL [relative sea level] then rose ∼0.6 m in less than a century, allowing the coral to grow upward to 1.2 m higher than modern living corals.”
9. Leonard, 2017 (Great Barrier Reef)
“The resultant palaeo-sea-level reconstruction revealed a rapid lowering of RSL of at least 0.4 m from 5500 to 5300 yBP following a RSL [relative sea level] highstand of ~0.75 m above present from ~6500 to 5500 yBP. RSL then returned to higher levels before a 2000-yr hiatus in reef flat corals after 4600 yBP. The RSL oscillations at 5500 yBP and 4600 yBP coincide with both substantial reduction in reef accretion and wide spread reef “turn-off”, respectively, thereby suggesting that oscillating sea level was the primary driver of reef shut down on the GBR.”
10. Dechnik et al., 2017 (Tropical Western Pacific)


What is the source of the sea levels for this graph? Is that global sea level or from a single location?
https://notrickszone.com/wp-content/uploads/2017/05/Holocene-Sea-Level-CO2-Concentration.jpg
As the description states, the sea level shape for that graph is based on the estimate that most scientists have found the range of sea levels for regions across the globe were between 1 and 4 meters higher than now during the Mid-Holocene. So it was designed to represent sea levels as about 2.5 meters higher than present. It is based on the this graph from Dura et al., 2016 (Vancouver):
https://notrickszone.com/wp-content/uploads/2016/12/Holocene-Cooling-Sea-Level-Vancouver-Dura-16.jpg
But to be precise, sea level rise and fall is a local/regional phenomenon more than a global phenomenon.
–
Beenstock et al., 2014
http://citeseerx.ist.psu.edu/viewdoc/download?doi=10.1.1.401.2529&rep=rep1&type=pdf
“We therefore study individual tide gauge data on sea levels from the Permanent Service for Mean Sea Level (PSMSL )during 1807–2010 without recourse to data reconstruction. Although mean sea levels are rising by 1mm/year, sea level rise is local rather than global, and is concentrated in the Baltic and Adriatic seas, South East Asia and the Atlantic coast of the United States. In these locations, covering 35 percent of tide gauges, sea levels rose on average by 3.8mm/year. Sea levels were stable in locations covered by 61 percent of tide gauges, and sea levels fell in locations covered by 4 percent of tide gauges. In these locations sea levels fell on average by almost 6mm/year.”
Thanks. The Dura et al 2016 paper states “But at the margins of the ice sheet (e.g., western Vancouver Island Canada), the rate of eustatic sea-level rise outpaced glacio-isostatic uplift until ∼7 ka, after which glacio-isostatic uplift became the dominant control on RSL, resulting in a mid-Holocene
highstand.”
So the sea level rise 6000 years ago came from the raising land mass not the raising sea level from glacial melt. You have convinced me that post-glacial rebound is not a response to CO2 levels.
Considering sea levels rose by about 60 meters between the Younger Dryas and 8,000 years ago due primarily to the recession of the ice sheets, it’s likely that the ice sheet recession was still having some residual effect on sea levels during the period between 7,000 and 5,000 years ago too — especially since the oceans were about 2.0 C warmer then (0-700 m) according to Rosenthal et al., 2013.
Since I have limited the scientific paper record to 2014 and newer, necessarily excluded are several dozens more earlier papers that indicate sea levels were, for example, 3 to 7 meters higher than now ~7000 years ago.
http://geology.gsapubs.org/content/35/10/891/F2.large.jpg
Yu et al., 2007
http://geology.gsapubs.org/content/35/10/891.abstract?sid=79cad7a2-2f6d-492e-b3c1-e829130781a7
“Superimposed upon a smooth pattern of local sea-level rise, acceleration occurred ca. 7600 calibrated (cal) yr B.P., evidenced as a nearly synchronous flooding in six elevated basins ranging from 3.0 to 7.2 m above present sea level. We ascribe this rapid local sea-level rise of ∼4.5 m to a sudden increase in ocean mass, most likely caused by the final decay of the Labrador sector of the Laurentide Ice Sheet. The subsequent monotonic fall of local sea level from ca. 6500 cal yr B.P. to the present is mainly an expression of the slow isostatic adjustment of the mantle.”
but the Dura paper also had sea level change data for the southwestern Washington coast and central Oregon coast. Both show a gradual RSL rise and both 6000 years ago had coastlines 8 meters below current levels. Vancouver is the odd one out, being covered by the Cordilleran ice sheet during the Last Glacial Maximum. Why use the only one of the three with sea level falling in the last 10,000 years?
Notice the Oct 2007 Geology paper says “Superimposed upon a smooth pattern of local sea-level rise…”? The abstract clearly states that unlike typical coastlines the Labrador coast sea level has fallen in the last 6500 years and attributes it to “isostatic adjustment of the mantle.”
Craig, once again, there was no “gradual sea level rise” prior to the highstands recorded from across the world (7,000-5,000 years ago). We are talking METERS PER CENTURY in many cases. Rates like that don’t occur due predominantly to land uplift. It was the rapid melting of the great ice sheets due to higher insolation and degrees-warmer ocean waters that caused the abrupt sea level rise predominantly.
—
Donoghue, 2011
“The regional tide gauge record reveals that sea level has been rising at about 2 mm/year for the past century, while the average rate of rise since the LGM has been 6 mm/year, with some periods of abrupt rise exceeding 40 mm/year” [4 meters per century]
—
Zecchin et al., 2015 “[M]elt-water pulses have punctuated the post-glacial relative sea-level rise with rates up to 60 mm/yr. [6 meters per century] for a few centuries.”
—
And again, the shape of the curve for the Holocene relative sea level depicted in the graph you asked about in your original question was intended to only be a representation of what the widely-accepted time periods for sea level highstands and abrupt (not gradual) post-glacial rise during the Early Holocene (~11,000-7,500 years ago). I only chose to point you to the Dura paper as a point of reference so you’d have an idea about a sample shape upon which the curve might be based. I could have chosen any number of several other papers. For example, here are 8 others I could have chosen from…
–
Clement et al., 2016 – New Zealand (2.75 m higher than present Mid-Holocene)
https://notrickszone.com/wp-content/uploads/2016/12/Holocene-Cooling-Sea-Level-New-Zealand-Clement-16.jpg
–
Bradley et al., 2016 – China (4+ m higher than present Mid-Holocene)
https://notrickszone.com/wp-content/uploads/2016/12/Holocene-Cooling-Sea-Level-China-Bradley-16.jpg
–
Hansen et al., 2016 – Denmark (1.5 m higher than present during the Medieval Warm Period)
https://notrickszone.com/wp-content/uploads/2016/12/Holocene-Cooling-Sea-Level-Denmark-Hansen-16.jpg
–
Rashid et al., 2014 – French Polynesia (2.5 m higher than present Mid-Holocene)
https://notrickszone.com/wp-content/uploads/2017/02/Holocene-Cooling-Sea-Level-French-Polynesia-Rashid-14.jpg
–
Hein et al., 2014 – Brazil (1-4 m higher than present Mid-Holocene)
https://notrickszone.com/wp-content/uploads/2017/02/Holocene-Cooling-Sea-Level-Brazil-Hein-14.jpg
–
Bracco et al., 2014 – Uruguay (4 m higher than present Mid-Holocene)
https://notrickszone.com/wp-content/uploads/2017/02/Holocene-Cooling-Sea-Level-Uruguay-Bracco-14.jpg
–
Scheffers et al., 2012 – Thailand (2.5 m higher than present Mid-Holocene)
https://notrickszone.com/wp-content/uploads/2017/02/Holocene-Cooling-Sea-Level-Thailand-Scheffers-2012.jpg
–
Bird et al., 2010 – Singapore (2.5 m higher than present Mid-Holocene)
https://notrickszone.com/wp-content/uploads/2017/02/Holocene-Cooling-Sea-Level-Singapore-Bird-2010.jpg
Shoreline two miles higher than now during the Roman Warm Period (~2,000 years ago):
http://news.bbc.co.uk/2/hi/uk_news/england/kent/7648033.stm
“An archaeological dig at a Kent fort has uncovered the coastline at the time of the Roman invasion of Britain in 43 AD – two miles [inland] from today’s shore.”
The geological evidence of a 1-2m higher sea level on the NSW coast, some time in the not too distant past, is undeniable.
Again, estimated around the early-mid Holocene.
Undeniable, huh? In a heartbeat, Bill can link you to a Wikipedia quotation and shoot down your “false fabrications”.
NSW Holocene Sea Levels (Lewis et al., 2012)
https://notrickszone.com/wp-content/uploads/2017/05/Holocene-Cooling-Sea-Levels-Australia-New-South-Wales-Lewis-2012.jpg
Lewis et al., 2012 (SE Australia)
https://research.jcu.edu.au/tropwater/resources/Lewis%20et%20al.%202013%20Post%20glacial%20sea%20level%20change.pdf
Sea-level estimates based on coral microatoll evidence places relative sea level at ~1.3 to 1.5 m between 6770 and 5750 cal. yr BP (original ages provided in Chappell et al., 1983; Yu and Zhao, 2010), in good accord with that derived from oyster bed data at ~1.6 m between 6280 and 5720 cal. yr BP (Beaman et al., 1994; Higley, 2000; Lewis et al., 2008). However, beachrock data suggest water levels of up to 2-3 m above present sometime between 6450 and 3050 cal. yr BP (Hopley, 1980, 1983b, 1986b) and the highstand suggested by foraminiferal transfer function analyses is ~2.8 to 3.3 m between 4270 and 3580 cal. yr BP (Woodroffe, 2009) (Fig. 4). While a higher mid Holocene sea level (>2 m) cannot be completely ruled out, a ~1.0 to 1.5 m highstand is currently the most accepted elevation for this region (Hopley et al., 2007; Lewis et al., 2008; Perry and Smithers, 2011). The most recent assessment indicates that microatolls and encrusting organisms are more accurate sea-level indicators than beachrock or foraminifera (Perry and Smithers, 2011).
Switzer et al., 2009 (SE Australia)
https://s3.amazonaws.com/academia.edu.documents/46600996/Geomorphic_evidence_for_midlate_Holocene20160618-31258-zrp0ma.pdf
This beach sequence provides new evidence for a period of higher sea level 1–1.5 m higher than present that lasted until at least c. 2000–2500 cal BP and adds complementary geomorphic evidence for the mid to late Holocene sea-level highstand previously identified along other parts of the southeast Australian coast using other methods.
Kenneth.. your evidence shoots me down.
I am wounded !!
But I will live to fight, yet another day !! 🙂
Many papers talk about past global sea-levels, including Yu et al 2007.
Sea level and global ice volumes from the Last Glacial Maximum to the Holocene (Lambeck et al 2014) uses data from coral reefs in tectonically stable regions from around the world to find global sea level over time. They found “a progressive decrease in the rate of rise from 8.2 ka to ∼2.5 ka BP, after which ocean volumes remained nearly constant until the renewed sea-level rise at 100–150 y ago.”
Graph: http://imgbox.com/pZkGXsna
Paper: http://www.pnas.org/content/111/43/15296.full.pdf
Craig, the reason for the “progressive decrease in the rate of rise” since the Early Holocene is because it wasn’t just the polar regions that had continued large-scale glacier and ice sheet melt from the last glacial maximum (LGM) still going on — albeit far more gradually — until about 7,000 years ago. Once most of the peripheral Arctic ice melted, there wasn’t much ice left above sea level to melt. The rate of rise is still so slow (0.1 to 0.2 of a meter per 100 years) that it is not even detectable on a graph. Compare the modern rate with rates of rise that occurred in the Early Holocene: 4 to 6 meters per 100 years. What’s happening now is entirely within the range of what occurs due to natural variability.
The “renewed sea level rise” since the 1800s is a response to the recovery from the Little Ice Age glaciation — the largest ice sheet advance since the Holocene began. The recovery has coincided with very low volcanic activity as well as the Modern Grand Maximum of solar activity (which has just recently come to an end). The Little Ice Age glaciation coincided with successive solar minima periods and much higher rates of volcanic eruption.
The article’s claims:
1) “Sea Levels 1 – 6 Meters Higher 4,000 – 6,000 Years Ago”
2) “Sea Levels Meters Higher While CO2 Levels Were Below 300 ppm”
etc.
are false fabrications.
“Over this last million years . . . sea level was lower than today.”
https://en.wikipedia.org/wiki/Past_sea_level
Apparently you’re going to need to let the scientists know that they are wrong, and that you and Wikipedia are right, about sea levels being much higher than now just a few thousand years ago. Did it occur to you that Wikipedia may not be providing accurate information? Students are not even allowed to use Wikipedia as a reference due to its chronic inaccuracies.
In addition to these 10 papers (actually 11 with the paper documenting +20 meters higher than now during the interglacial 400,000 years ago), you’ll need to falsify 35 other papers that were published between 2014 and 2016:
https://notrickszone.com/2017/02/06/35-scientific-papers-global-sea-levels-were-1-2-meters-higher-than-now-for-most-of-the-last-7000-years/
@Bill Butler 8. May 2017 at 6:10 PM
Who to believe eh Bill?
The academics in this field of study as cited above or some publicly edited Web page from Wikipedia?
From Wikipedia!
Hahahahahahaha! 🙂 😆
The sea level claims in the article are fabrications. The author apparently did not even read the paper that he referenced ( Yoon et al., 2017 -http://onlinelibrary.wiley.com/doi/10.1111/ter.12248/full ) which states:
“The sea level at the time was almost identical to that at present.”
For most of the last 125,000 years sea level has been below current levels except for a brief period in the Eemian interglacial some 125,000 years ago.
“Nature”
Fig. 3
http://www.nature.com/nature/journal/v491/n7426/full/nature11593.html
Bill, the Nature paper you linked to was published in 2012. A large volume of updated geological evidence has emerged since then indicating that modern sea levels are lower than during the Mid-Holocene. And during the interglacial 400,000 years ago, sea levels were 20 meters higher according to a paper published in 2017.
Besides, that same paper says that sea levels naturally rose at rates of 12 mm/yr in the past without any significant changes in CO2, which is about 700% faster than the rate of rise since 1901 (1.7 mm/yr).
–
Grant et al., 2012
http://www.nature.com/nature/journal/v491/n7426/full/nature11593.html
“Finally, rates of sea-level rise reached at least 1.2 m per century during all major episodes of ice-volume reduction.”
Gees Bill, don’t you think that having Ice sheets 1km thick over parts of the NH would mean a lower sea level?
The article is about the mid Holocene.
Try to keep up.
During that period , Greenland Ice area was lower than current, and many glaciers had disappeared.
Trees and artefacts from the early mid Holocene have been found under many glaciers now recovering from the LIA, showing there was a much warmer period back then. Trees do NOT grow under glaciers. !!!
Of course sea levels were higher than now. !!
The Neoglaciation period starting around 3500 years ago re-newed those glaciers and increased Greenland’s surface area to the current high levels.
@Bill Butler 8. May 2017 at 9:58 PM
Bill, do you still think that Wikipedia is good place to cite for a scientific reference?
Considering some the contentious statements on that site I would say you should be more cautious about who you reference.
Heck you could do worse like quoting from science fantasy sites like skepticalscienceDOTcom.
Wikipedia cites its sources where you can mostly find what is condensed in the articles. Shit happens, but in general Wikipedia is orders of magnitude more accurate than most skeptic weblogs and especially their comment sections 😉
Fantasy is what one can read here when certain people post.
Less fantasy here: https://scholar.google.de/scholar?as_ylo=2016&q=sea+level+rise&hl=de&as_sdt=0,5 (48800 results)
Sorry, SebastianH, but when it comes to climate change, the agenda at Wikipedia is to exclude scientific information that doesn’t support the narrative. And a large portion of what’s allowed to stay on Wikipedia is overseen by activist bloggers like William Connolley, who just writes his own stuff/propaganda. That blogger alone wrote over 5,400 unique articles on climate change himself, excluding data that didn’t conform to his viewpoint.
https://notrickszone.com/2016/09/13/massive-cover-up-exposed-285-papers-from-1960s-80s-reveal-robust-global-cooling-scientific-consensus/
Beginning in 2003, software engineer William Connolley quietly removed the highly inconvenient references to the global cooling scare of the 1970s from Wikipedia, the world’s most influential and accessed informational source.
It had to be done. Too many skeptics were (correctly) pointing out that the scientific “consensus” during the 1960s and 1970s was that the Earth had been cooling for decades, and that nascent theorizing regarding the potential for a CO2-induced global warming were still questionable and uncertain.
Not only did Connolley — a co-founder (along with Michael Mann and Gavin Schmidt) of the realclimate.com blog — successfully remove (or rewrite) the history of the 1970s global cooling scare from the Wikipedia record, he also erased (or rewrote) references to the Medieval Warm Period and Little Ice Age so as to help create the impression that the paleoclimate is shaped like Mann’s hockey stick graph, with unprecedented and dangerous 20th/21st century warmth.
A 2009 investigative report from UK’s Telegraph detailed the extent of dictatorial-like powers Connolley possessed at Wikipedia, allowing him to remove inconvenient scientific information that didn’t conform to his point of view.
http://www.informationliberation.com/?id=28353
“but in general Wikipedia is orders of magnitude more accurate than most skeptic ”
If you think that, then no wonder you have such an unsupportable AGW bias.. borderlining on manic denial of most real data. !!
And no wonder you are so full of ANTI-knowledge.
seb,
“Wikipedia is orders of magnitude more accurate than most skeptic weblogs and especially their comment sections”
A nearly interesting but irrelevant distraction.
See Kenneth Richard 9. May 2017 at 2:57 PM about the veracity of Wikipedia and climate information.
“Less fantasy here: ”
Then STOP POSTING, seb !!!
Gosh Bill, you used a link to Wikipedia, that showed a grossly different time frame than the one you objected too.Your Wiki link doesn’t mention CO2 either.
YOU even quoted the article:
1) “Sea Levels 1 – 6 Meters Higher 4,000 – 6,000 Years Ago”
2) “Sea Levels Meters Higher While CO2 Levels Were Below 300 ppm”
etc.”
Notice a specific time frame? “4,000 – 6,000 Years Ago”
Then you wrote after that:
“are false fabrications.”
Then you go to a Wikipedia link that doesn’t address the EARLY Holocene at all.
You even quoted from there:
““Over this last million years . . . sea level was lower than today.”
Your comment was dead on arrival……..
What were you drinking when you wrote your mess of a comment?
Bill, it’s a distortion not a fabrication.
There are two major reasons for sea levels rising after the last ice age. The obvious is the runoff from the melting ice. But land under the glacier had been depressed by the glacier’s weight. With that weight lifted those areas slowly rose to their former height. Places like Vancouver Island rose above the ocean then later rising sea levels caught up.
Wikipedia is a good place to start but never use it as a references. Use the links at the bottom of the page. You’ll learn a lot.
Craig, the land lift is a very minor factor in the sea level rise relative to the collapse of the great ice sheets. Sea levels rose at rates of up to 6 meters per century during the Early Holocene, a rate which would have necessarily had very little to do with uplift.
Zecchin et al., 2015
http://www.sciencedirect.com/science/article/pii/S0025322715300281
“Episodic, rapid sea-level rises on the central Mediterranean shelves after the Last Glacial Maximum: A review … The evidence presented here confirms drowned shorelines documented elsewhere at similar water depths and shows that melt-water pulses have punctuated the post-glacial relative sea-level rise with rates up to 60 mm/yr. [6 meters per century] for a few centuries.”
Donoghue, 2011
The regional tide gauge record reveals that sea level has been rising at about 2 mm/year for the past century, while the average rate of rise since the LGM has been 6 mm/year, with some periods of abrupt rise exceeding 40 mm/year [4 meters per century].
–
Here’s a paper that says the seas around the Antarctic peninsula were 15.5 meters higher than now between 8000 and 7000 years ago. Of that 15.5 meter highstand, only about 2 meters had to do with tectonics.
–
Watcham et al., 2011
https://www.researchgate.net/profile/Peter_Fretwell/publication/233811316_A_new_Holocene_relative_sea_level_curve_for_the_South_Shetland_Islands_Antarctica/links/0fcfd50bc77373dfba000000.pdf
“The curve shows a mid-Holocene RSL highstand on Fildes Peninsula at 15.5 m above mean sea level between 8000 and 7000 cal a BP. Subsequently RSL gradually fell as a consequence of isostatic uplift in response to regional deglaciation. We propose that isostatic uplift occurred at a non-steady rate, with a temporary pause in ice retreat ca. 7200 cal a BP, leading to a short-lived RSL rise of 1 m and forming a second peak to the mid-Holocene highstand. Two independent approaches were taken to constrain the long-term tectonic uplift rate of the SSIs at 0.22-0.48 m/ka, placing the tectonic contribution to the reconstructed RSL highstand between 1.4 and 2.9 m.”
Besides land subsidence what would cause sea levels to rise except the melting of ice and that melt water draining into the oceans? Also thermal expansion, I guess.(layman here)
Dave Andrews:
Here’s what we get for the most recent decades from scientists’ estimates of each contributor:
Thermal expansion: +0.64 mm/yr
Antarctica + Greenland: +0.59 mm/yr
Mountain Glaciers/Ice Sheets: +0.41 mm/yr
Water storage: -0.35 mm/yr
Put together (using the linked sources below), the glaciers and ice sheets contributed 1 mm/yr (Jacob et al., 2012, Shepherd et al., 2012) to thermal expansion’s 0.64 mm/yr (Llovel et al., 2014). The reduction in sea level from terrestrial water storage (-0.35 mm/yr per Cabanes et al., 2001) means that sea levels have been rising at a rate of about 1.3 mm/yr in recent decades, which is in line with estimates from tide gauges (sans the artificial adjustments).
–
McAneney et al., 2017
http://onlinelibrary.wiley.com/doi/10.1002/joc.4989/full
“Global averaged sea-level rise is estimated at about 1.7 ± 0.2 mm year−1 (Rhein et al. 2013), however, this global average rise ignores any local land movements. Church et al. (2006) and J. A. Church (2016; personal communication) suggest a long-term average rate of relative (ocean relative to land) sea-level rise of ∼1.3 mm year.”
—
Llovel et al., 2014
http://www.nature.com/nclimate/journal/v4/n11/full/nclimate2387.html
“Over the entire water column, independent estimates of ocean warming yield a contribution of 0.77 ± 0.28 mm yr−1 in sea-level rise … the deep ocean (below 2,000 m) contributes −0.13 ± 0.72 mm yr−1 to global sea-level rise [0.64 mm/yr total].”
—
Shepherd et al., 2012
http://science.sciencemag.org/content/338/6111/1183
“Since 1992, the polar ice sheets [Antarctica and Greenland] have contributed, on average, 0.59 ± 0.20 millimeter year−1 to the rate of global sea-level rise.”
—
Jacob et al., 2012
http://www.nature.com/nature/journal/v482/n7386/abs/nature10847.html
“Here we show that GICs [glaciers and ice caps], excluding the Greenland and Antarctic peripheral GICs, lost mass at a rate of 148 ± 30 Gt yr−1 from January 2003 to December 2010, contributing 0.41 ± 0.08 mm yr−1 to sea level rise.”
—
Cabanes et al., 2001
http://science.sciencemag.org/content/294/5543/840.full
“terrestrial water storage … is in the range of –1.1 to + 0.4 mm/year with a median value of −0.35 mm/year”
Dave google “glacial isostatic adjustment”.
Not forgetting the time when the whole earth was under water, for approximately one year.
Noah “Lawd! What’sa cubit?”
Tom, I’d forgotten about Bill Cosby’s Noah routine.
@Craig T
Glad someone got it.
As disreputable as his later life was shown to be, back then he was a very good comedian.
Is it too difficult to standardise the directionality of time scales in the various graphs ?
Not strictly on topic but offering evidence that the past was considerably warmer than today and we may simply be on a cycle to approach that warmth again – or not ?
http://juneauempire.com/outdoors/2013-09-13/ancient-trees-emerge-frozen-forest-tomb
“The Mendenhall Glacier’s recession is unveiling the remains of ancient forests that have remained frozen beneath the ice for up to 2,350 years.
UAS Professor of Geology and Environmental Science Program Coordinator Cathy Connor said she and others have been tracking the emergence of the forests’ remains. Some stumps and logs can be found in the moraines around the west side of the glacier. Some remain vertical, frozen to the ground in ice caves. Some are scoured smooth; some still have their bark. All are packed with silt in the outer layers.
As the glacier advanced, it snapped off the tops of the trees in its path, Connor said. The stumps were buried — and protected — in gravel.
Now, as the glacier melts, the melt water carves out paths in that gravel, revealing the remains of the trees.
The most recent stumps she’s dated emerging from the Mendenhall are between 1,400 and 1,200 years old. The oldest she’s tested are around 2,350 years old. She’s also dated some at around 1,870 to 2,000 years old.
“We’re seeing the Mendenhall wax and wane through time a little bit,” Connor said.
She anticipates the trees are spruce, although that hasn’t yet been scientifically verified.
At the end of the last glacial maximum, (the time at which glaciers were at their largest and most extended, about 20,000 years ago) before Southeast Alaska became the verdant place it is today, vegetation would have been more tundra-like, Connor said. The trees currently beneath the Mendenhall, however, shouldn’t differ significantly from those that grow around the glacier today.”
Proof enough for me that the mid holocene warmth and the higher sea levels shown in all the article are at least a reasonable hypothesis.
The trees didn’t grow out of a glacier so it obviously formed later.
“Lamb also touches on the question of sea level, suggesting that sea level was likely at its highest around 2000 BC, when “ it may have stood a metre or two higher than today” (page 116).”
https://notalotofpeopleknowthat.wordpress.com/2014/07/20/hh-lamb-the-early-holocene/
Yes, we have voluminous scientific evidence dating back decades indicating that (a) sea levels were much higher (~1-2 meters) than now for most of the last 7,000 years, and (b) that modern rates of sea level rise (1-2 mm/yr) are so paltry they are not detectable relative to Holocene rates (40 to 60 mm/yr). And again, both (a) and (b) do not support the narrative that says CO2 is a driver of sea level fluctuations.
The connection between the Yorkshire pendant and its similarly aged Danish parallels are very real – because, back in the Mesolithic period the North Sea area was still dry land and groups would have been able to easily move between the two areas.
http://www.independent.co.uk/news/science/archaeology/stone-age-britons-may-have-had-prehistoric-secret-code-a6896596.html
Yup… can see this at Rotnest Island off Perth where Recent coral reefs are in growth position and 1.2m above sea level (Playford’s Geological Survey of Western Australia paper). I personally noted similar on the other side of the Indian Ocean on Inhaca Island (off Maputo) when mapping coral reefs in Mocambique in 1973 for my geology degree.
[…] Link: https://notrickszone.com/2017/05/08/10-new-papers-sea-levels-1-6-meters-higher-4000-6000-years-ago/ […]