Heat Flux From Below Melts Ice Sheets,
Drives Temperatures & CO2 Variations
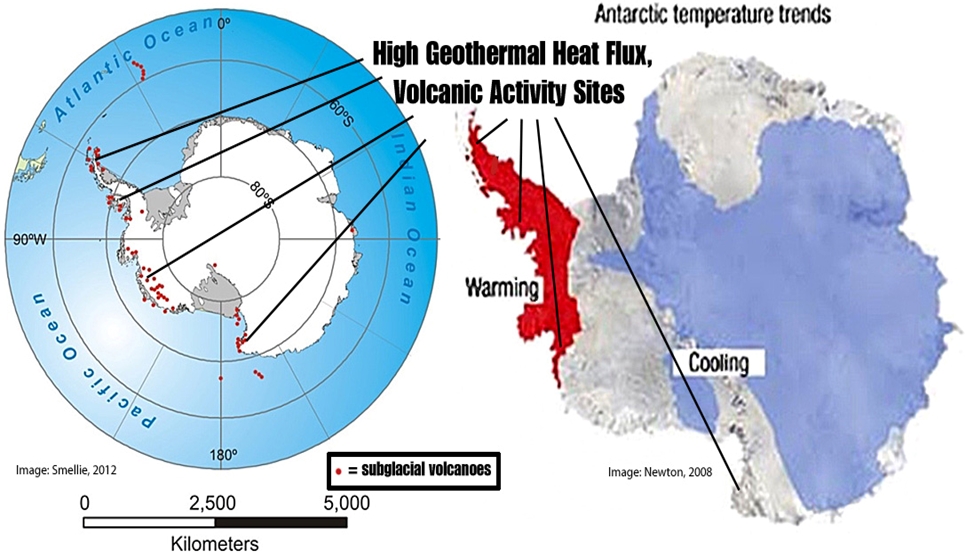
Image: Smellie, 2012 Image: Newton, 2008
It has long been established in the peer-reviewed scientific literature that naturally-driven fluctuations in the Earth’s surface temperature preceded the rise and fall of carbon dioxide (CO2) concentrations for at least the last 800,000 years.
As oceans warm, they release more of their vast stores of CO2; as oceans cool, they retain more CO2. During cold glacial periods, when ice sheets covered much of the Earth, atmospheric CO2 concentrations only hovered around 200 parts per million (ppm). After surface temperatures naturally warmed up by multiple degrees C during interglacials, it took at least several hundred years before atmospheric CO2 concentrations began rising in response to the temperature rise.
This lag supports the conclusion that glacial-to-interglacial variations in CO2 concentrations may be driven by temperature changes, as the temperature change occurred well before the CO2 change did.
IPCC AR4 (2007): “Atmospheric CO2 follows temperature changes in Antarctica with a lag of some hundreds of years.”
Caillon et al., 2003 “The sequence of events during Termination III suggests that the CO2 increase lagged Antarctic deglacial warming by 800 ± 200 years and preceded the Northern Hemisphere deglaciation.”
Fischer et al., 1999 “High-resolution records from Antarctic ice cores show that carbon dioxide concentrations increased by 80 to 100 parts per million by volume 600 ± 400 years after the warming of the last three deglaciations.”
Monnin et al., 2001 “The start of the CO2 increase thus lagged the start of the [temperature] increase by 800 ± 600 years.”
Kawamura et al., 2007 “Our chronology also indirectly gives the timing of the CO2 rise at [glacial] terminations, which occurs within 1 kyr of the increase in Antarctic temperature.”
Indermuhle et al., 2000 “The [CO2] lag was calculated for which the correlation coefficient of the CO2 record and the corresponding temperatures values reached a maximum. The simulation yields a [CO2] lag of (1200 ± 700) yr.
Landais et al., 2013 “[F]rom 130.5 to 129,000 years ago, the rise in atmospheric CO2 concentrations lagged that of Antarctic temperature unequivocally….At mid-slope, there is an unequivocal lead of δ15N [temperature] over CO2 of 900 ± 325 yr”.
Schneider et al., 2013 “Furthermore, a 5,000 yr lag in the CO2 decline relative to EDC [East Antarctica] temperatures is confirmed during the glacial inception at the end of MIS5.5 (120,000 yrs before present).”
Stott et al., 2007 “Deep-sea temperatures warmed by ∼2°C between 19 and 17 thousand years before the present (ky B.P.), leading the rise in atmospheric CO2 and tropical–surface-ocean warming by ∼1000 years.”
The occurrence of temperature change leading the CO2 concentration growth rate change may also occur in the modern era.
Flohn, 1982 “Comparative investigations (Keeling and Bacastow 1977, Newll et al. 1978, Angell 1981) found a positive correlation between the rate of increase of atmospheric CO2 and the fluctuations of sea surface temperature (SST) in the equatorial Pacific, which are caused by rather abrupt changes between upwelling cool water and downwelling warm water (“El Niño“) in the eastern equatorial Pacific. … A crude estimate of these differences is demonstrated by the fact that during the period 1958-1974, the average CO2-increase within five selective years with prevailing cool water only 0.57 ppm/a [per year], while during five years with prevailing warm water it was 1.11 ppm/a. Thus in a a warm water year, more than one Gt (1015 g) carbon is additionally injected into the atmosphere, in comparison to a cold water year.”
Jones and Cox, 2005 “There is clear similarity between Figures 1b and 1c, with the positive CO2 growth rate anomalies corresponding to El Niño [warming] events, and the negative growth rate anomalies corresponding to La Niña [cooling] events. … It is unlikely that these anomalies can be explained by an abrupt increase in anthropogenic emissions, as the anomalies are much larger than annual increases in fossil fuel emissions. Most interannual variability in the CO2 growth rate is attributable to variations in land-atmosphere CO2 exchange with climate (e.g., associated with ENSO or volcanic perturbations)”
Geothermal Heat Flux Leads Temperature, CO2 Rise By 1000s Of Years
It has recently been suggested that there is a “detection of Milankovitch [millennial-scale climate changes linked to the Earth’s orbit] frequencies in global volcanic activity” (Kutterolf et al., 2012), or that variations in geothermal or volcanic activity are not random, but function within short- and long-term cycles and periodicities that could be linked to the Sun-Earth connection itself.
Tolstoy, 2015 “Pulsing of seafloor volcanic activity may feed back into climate cycles, possibly contributing to glacial/interglacial cycles, the abrupt end of ice ages, and dominance of the 100 kyr cycle.”
With this in mind, it should not be particularly surprising that Russian geophysicists Demezhko and Gomostaeva (2015) recently found the geothermal heat flux from below the Earth’s surface may have risen 2 to 3 thousand years before the surface temperatures and CO2 concentrations began rising.
Demezhko and Gornostaeva, 2015 “Despite the substantial dispersion of CO2 estimations, a character and a chronology of CO2 concentration changes are much closer to temperature changes rather than to heat flux variations. It may mean no significant contribution of CO2 forcing to climatically caused heat flux and thus to the temperature increase during Pleistocene–Holocene warming.”
“[T]he increase of carbon dioxide may be a consequence of temperature increasing. Comparing the chronology of surface flux, temperature and carbon dioxide concentration changes, we can draw some conclusions about the causes of climate change. … The increase of carbon dioxide concentrations occurred 2–3 thousands of years later than the heat flux increase and synchronously with temperature response.”
Therefore, the order for net heat energy changes in the Earth system may be this: First, there is (a) a change (increase) in the heat flux from beneath the Earth’s surface (with an ostensible connection to solar-orbital changes), (b) the Earth’s surface temperature rises, and (c) CO2 concentrations rise.
New Paper: Geothermal Data Affirms Heat Flux Leads Surface Temperature
A new paper from Demezhko, Gornostaeva, and two other colleagues again provides further evidence that heat flux leads surface temperature change by about 1000 to 2000 years, and that this sequencing therefore “does not depend on climate change”.
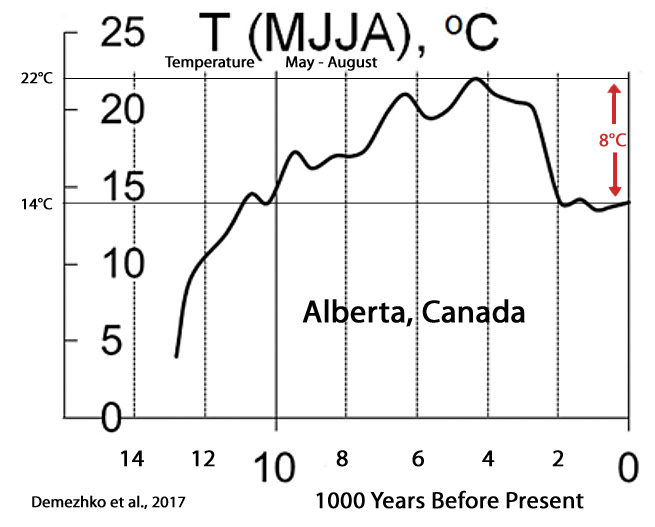
Temperature and heat flux changes at the base of
Laurentide ice sheet inferred from geothermal data
Demezhko et al., 2017
“Recently, geothermal data have been used to estimate transient climatically caused surface heat flux (SHF) changes (Beltrami et al. 2000, 2002; Beltrami 2001; Demezhko et al. 2013; Volobuev 2013; Demezhko and Gornostaeva 2015). This heat flux has been introduced as a useful new paleoclimate characteristic. It should be distinguished from the steady-state background heat flow. The latter is attributed to the Earth’s internal heat sources and does not depend on climate change. Both these fluxes are independent components of the ground surface heat balance. … GST [ground surface temperature] and SHF [surface heat flux] histories differ substantially in shape and chronology. [Subsurface] Heat flux changes ahead of temperature changes by 500–1000 years.”
“Geothermal reconstructions spanning tens of thousands of years are of special importance for understanding the climate history of the Earth. During this period (15–10-ka BP) the last glacial period of pleistocene (Wisconsinan in central North America, Weichselian or Vistulian in Northern Europe, Valdai in Eastern Europe, Zyryanka and Sartan in Siberia) ended and the current Holocene interglacial began.”
“More recently, Demezhko et al. (2013) and Demezhko and Gornostaeva (2015) reconstructed long-term surface heat flux histories near Lake Onega in Karelia and in the Middle Urals, respectively. It was noted that the long-term heat flux changes differ considerably from the temperature changes. The temperature curve reveals a sharp rise in the early Holocene (12−10-ka BP) and a relatively stable warm climate of interglacial, while the heat flux began to increase about 2 ka [2000 years] earlier [13000 years ago vs. 11000 years ago for surface temperature], reached a maximum at the beginning of the Holocene, and then decreased.”
Figure 4d from the paper shows the trajectory of the reconstructed temperature changes from the site (Alberta, Canada) as determined by geothermal data. Notice that modern temperatures are ~8°C cooler than they were about 4,500 years ago.
“These results (Fig. 4d) indicate an abrupt increase of summer (from May to August) temperatures between 12 and 10 ka BP, relative stabilization 10–7 ka BP, another increase after 7 ka BP, and rapid decline to modern values after 3 ka BP.”
Greenland Warms, Melts Significantly Due To Heat Flux From Below
Considering the magnitude of heat energy required to melt polar ice sheets from below, and that central Antarctica’s air temperatures average about -55°C year-round, it should not be surprising that a significant portion of the meltwater flow from both polar ice sheets (Greenland and Antarctica) is derived from “heat flow from the deep Earth”.
Rogozhina et al., 2016 “Ice-penetrating radar and ice core drilling have shown that large parts of the north-central Greenland ice sheet are melting from below. It has been argued that basal ice melt is due to the anomalously high geothermal flux that has also influenced the development of the longest ice stream in Greenland. Here we estimate the geothermal flux beneath the Greenland ice sheet and identify a 1,200-km-long and 400-km-wide geothermal anomaly beneath the thick ice cover. We suggest that this anomaly explains the observed melting of the ice sheet’s base, which drives the vigorous subglacial hydrology and controls the position of the head of the enigmatic 750-km-long northeastern Greenland ice stream.”
Petrunin et al., 2013 “Here we use a coupled ice–lithosphere model driven by climate and show that the oldest and thickest part of the Greenland Ice Sheet is strongly influenced by heat flow from the deep Earth. … Complex interactions between geothermal heat flow and glaciation-induced thermal perturbations in the upper crust over glacial cycles lead to strong regional variations in basal ice conditions, with areas of rapid basal melting adjoining areas of extremely cold basal ice.”
Fahnestock et al., 2001 High Geothermal Heat Flow, Basal Melt, and the Origin of Rapid Ice Flow in Central Greenland … “Age-depth relations from internal layering reveal a large region of rapid basal melting in Greenland. Melt is localized at the onset of rapid ice flow in the large ice stream that drains north off the summit dome and other areas in the northeast quadrant of the ice sheet. Locally, high melt rates indicate geothermal fluxes 15 to 30 times continental background. The southern limit of melt coincides with magnetic anomalies and topography that suggest a volcanic origin.”
van der Veen et al., 2007 “[T]here is a growing body of evidence suggesting more extensive basal melting in the central region of northern Greenland. … The basal melt rate at NGRIP reaches 7.5 mm ice per year, and the modeled geothermal heat flux is between 90 and 160 mW/m2 along the flow line originating 50 km upstream of the drill site (Dahl-Jensen et al., 2003). Again, the origin of the large geothermal heat flux remains unidentified. Ice-penetrating radar profiles show bright bed reflections in many locations in northern Greenland, indicating the presence of lubricating meltwater at the glacier base.”
Lilja Buchardt and Dahl-Jensen, 2007 “From radio-echo sounding (RES) surveys and ice core data it can be seen that the ice sheet is melting at the base in a large area in Northern Greenland. The RES images reveal internal layers in the ice. The layers are former deposition surfaces and are thus isochrones. Undulations of the isochrones in regions where the base is smooth suggest that the basal melt rate changes over short distances. This indicates that the geothermal heat flux is very high and has large spatial variability in Northern Greenland. Combining the estimated basal melt rates with the observed borehole temperatures allows us to convert the basal melt rates to geothermal heat flow values. From the two-dimensional model we find the basal melt rate and geothermal heat flux at NorthGRIP to be 6.1 mm a−1 and 129 mW m−2, respectively.”
Dahl-Jensen et al., 2003 “From temperature measurements down through the 3001 m deep borehole at the North Greenland Icecore Project (NorthGRIP) drill site, it is now clear that the ice at the base, 3080 m below the surface, is at the pressure-melting point. This is supported by the measurements on the ice core where the annual-layer thicknesses show there is bottom melting at the site and upstream from the borehole. … The results show the geothermal heat flow varies from 50 to 200 mW m-2 along the 100 km section of the modeled flowline. The melt rate at the NorthGRIP site is 0.75 cm a-1, but the deep ice in the NorthGRIP core originated 50 km upstream and has experienced melt rates as high as 1.1 cm a-1.”
Antarctic Warms, Melts Significantly Due To Heat Flux From Below
Fisher et al., 2015 “We report the first direct measurement of geothermal heat flux into the base of the West Antarctic Ice Sheet (WAIS), below Subglacial Lake Whillans, determined from the thermal gradient and the thermal conductivity of sediment under the lake. The heat flux at this site is 285 ± 80 mW/m2, significantly higher than the continental and regional averages estimated for this site using regional geophysical and glaciological models. Independent temperature measurements in the ice indicate an upward heat flux through the WAIS of 105 ± 13 mW/m2. The difference between these heat flux values could contribute to basal melting and/or be advected from Subglacial Lake Whillans by flowing water. The high geothermal heat flux may help to explain why ice streams and subglacial lakes are so abundant and dynamic in this region.“
Maule et al., 2005 “The geothermal heat flux is an important factor in the dynamics of ice sheets; it affects the occurrence of subglacial lakes, the onset of ice streams, and mass losses from the ice sheet base. Because direct heat flux measurements in ice-covered regions are difficult to obtain, we developed a method that uses satellite magnetic data to estimate the heat flux underneath the Antarctic ice sheet. We found that the heat flux underneath the [Antarctic] ice sheet varies from 40 to 185 megawatts per square meter and that areas of high heat flux coincide with known current volcanism and some areas known to have ice streams.”
Schroeder et al., 2014 “Heterogeneous geothermal flux and subglacial volcanism have the potential to modulate ice sheet behavior and stability by providing a large, variable supply of meltwater to the subglacial water system, lubricating and accelerating the overlying ice. … Thwaites Glacier is one of the largest, most rapidly changing glaciers on Earth, and its landward sloping bed reaches into the deep interior of the WAIS [West Antarctic Ice Sheet], making it a leading component in scenarios for rapid deglaciation. … [H]eterogeneous geothermal flux beneath Thwaites Glacier is likely a significant factor in local, regional, and continental-scale ice sheet stability.”
Corr and Vaughan, 2008 A recent volcanic eruption beneath the West Antarctic ice sheet … “Indirect evidence suggests that volcanic activity occurring beneath the West Antarctic ice sheet influences ice flow and sheet stability. … Ongoing volcanic heat production may have implications for contemporary ice dynamics in this glacial system.”
Vogel and Tulaczyk, 2006 “Subglacial volcanism in West Antarctica may play a crucial role in the dynamics and stability of the West Antarctic Ice Sheet (WAIS). Evidence supporting the existence of an individual subglacial volcanic center (Mt. Casertz) in the upper catchments of Whillans and Kamb Ice Stream (WIS and KIS), comes from a comparison of ice sheet modeling results with measured ice velocities. Lubrication [melting ice] of an area, which otherwise should be frozen to its bed, is best explained by basal melt water generated in the vicinity of Mt. Casertz.”
Blankenship et al., 1993 “Here we present aerogeophysical evidence for active volcanism and associated elevated heat flow beneath the West Antarctic Ice Sheet near the critical region where ice streaming begins. If this heat flow is indeed controlling ice-stream formation, then penetration of ocean waters inland of the thin hot crust of the active portion of the West Antarctic rift system could lead to the disappearance of ice streams, and possibly trigger a collapse of the inland ice reservoir.”
Damiani et al., 2014 “One major contributor to fast glacial flow is the presence of subglacial water, the production of which is a result of both glaciological shear heating and geothermal heat flux. A zone of thinner crust is also identified near the area’s subaerial volcanoes lending support to a recent interpretation predicting that this part of Marie Byrd Land is a major volcanic dome, likely within the West Antarctic Rift System itself. [W]e prefer the hypothesis that Marie Byrd Land volcanoes are thermally-supported by warmer upper mantle. The presence of such inferred warm upper mantle also suggests regionally elevated geothermal heat flux in this sector of the West Antarctic Rift System and consequently the potential for enhanced meltwater production beneath parts of Thwaites Glacier itself.”
Significance Of Geothermal Influence On Climate System ‘Unknown’
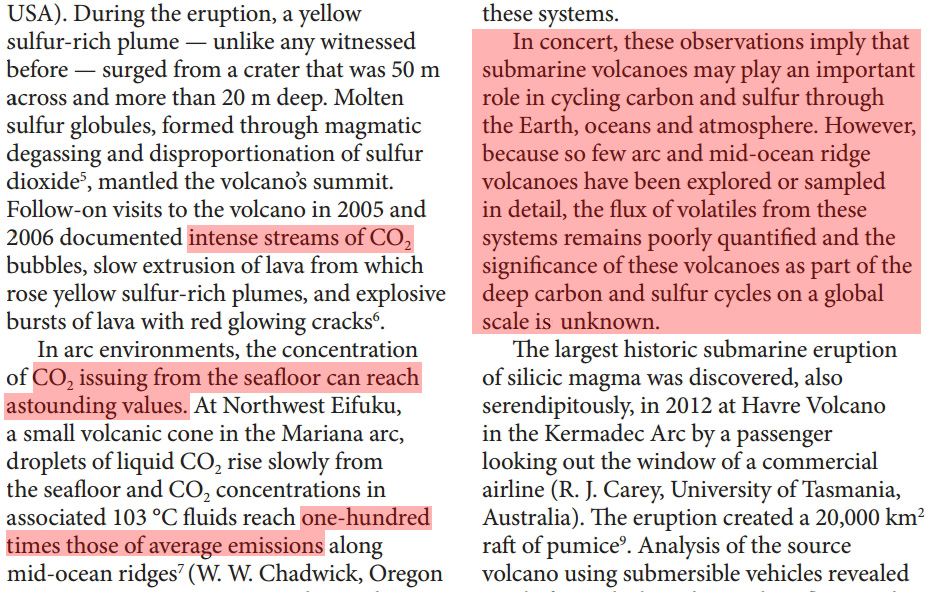
There is still much to learn about geothermal factors and their relation to the Earth’s climate system. More than 70% the Earth’s volcanism occurs under the sea floor, unobserved, and there are more than 100,000 extinct and active locations beneath the ocean depths.
Considering how influential fluctuations heat flow from beneath the Earth may be in leading/determining surface temperatures, subglacial volcanism and ice sheet melt, carbon cycling, and climate change in general, it would probably be wise to continuing studying geothermal heat flux effects on the Earth system rather than declaring climate science already “settled“.
Kelley, 2017 Volcanology: Vulcan rule beneath the sea … “Over 70% of the volcanism on Earth occurs beneath an ocean veil. … Satellite data reveal more than 100,000 extinct and active seamounts that mark sites of past and present volcanic activity. [O]bservations imply that submarine volcanoes may play an important role in cycling carbon and sulfur through the Earth, oceans and atmosphere.”
“[T]he flux of volatiles from these systems remains poorly quantified and the significance of these volcanoes as part of the deep carbon and sulfur cycles on a global scale is unknown.”
On the other hand, it’s been recently discovered that seismic activity has been highly correlated (~0.80) with global temperatures in recent decades.


Also relevant are Humlum (2013) and Harde (2017),who show the same connection between temperature and carbon dioxide.
Correct. Many papers were excluded for the sake of brevity.
Humlum et al., 2013
http://www.climometrics.org/12hustso.pdf
“There exist a clear phase relationship between changes of atmospheric CO2 and the different global temperature records, whether representing sea surface temperature, surface air temperature, or lower troposphere temperature, with changes in the amount of atmospheric CO2 always lagging behind corresponding changes in temperature.”
—
Kovalenko, 2014
http://link.springer.com/article/10.1134/S1024856014060104#page-1
“Observable correlations between long-term variations in the global temperature (GT) and CO2 content do not mean that the CO2 increase causes an increase in the global temperature. Actually observable temperature rise in the ocean also results in the increased content of CO2 in the atmosphere; therefore, such changes can be a consequence, but not a cause of global heating.”
—
Quirk, 2009
http://journals.sagepub.com/doi/abs/10.1260/095830509787689123
“The results suggest that El Nino and the Southern Oscillation events produce major changes in the carbon isotope ratio in the atmosphere. This does not favour the continuous increase of CO2 from the use of fossil fuels as the source of isotope ratio changes. The constancy of seasonal variations in CO2 and the lack of time delays between the hemispheres suggest that fossil fuel derived CO2 is almost totally absorbed locally in the year it is emitted. This implies that natural variability of the climate is the prime cause of increasing CO2, not the emissions of CO2 from the use of fossil fuels.”
no.
YES.. but do try not to cry about it, sob-sob. !!
Or did sod mean nooooooooooooooo!!!!!!!!
More like, OH NO!
LOL, the compulsive science-denier troll collapses.
Sod, you misspelled it.
What are you trying to say with this list of papers?
1) That it’s geothermal energy that is causing glacier/ice melt? Whatabout calving and high pressure at the bottom? Any percentages what is currently the driving ice loss?
2) Or that the current CO2 increase is a lagged response from some warming/heat flux change in the past? What if the current heat flux change results in further CO2 increase in the future then?
3) That volcanoes cause the current CO2 increase?
I do agree, but we know fairly well how much energy the surface receives from the core … it’s very little compared to what the surface receives from the Sun, correct?
1. Calving is natural. a glacier is a river of ice.
1. Maybe there is some pressure melt. fact is we have a lot to learn
1. It certainly has NOTHING to do with CO2 causing warming.
2. Current CO2 is highly beneficial to all life on the planet, further increase would also be beneficial.
3. “but we know fairly well how much energy the surface receives from the core”
Of course you “believe” you do , petal !!
“Any percentages what is currently the driving ice loss?”
What current ice loss !
Hallucinating, yet again, hey seb.. (wrong medication, no doubt) ?
Greenland has massive ice gains this year.
Arctic sea ice is gradually jumping up over other years , with the slowest May melt this century.
Internal heat obviously has only a local and very minor part to play, since it has not kept mile-thick ice from remaining on Greenland, even on the portion south of the Arctic circle, at 66.5°N (the southern tip of Greenland is at 60°N). It has no global effect whatsoever.
Yes, probably minor, but still unknown.
There is much of the sea bed that we still have very limited knowledge of.
The West Antarctic Peninsula is pretty obviously affected by geothermal heat, which may or may not affect further afield.
Harry, there is a significant amount of speculation that the North Pacific “warm blob” that went along with the 2015/16 El Nino was at least partly due to geothermal activity.
That blob did have a significant effect on the weather for quite a while.
What I’m saying is that we don’t know enough to make statements of certainty about how much geothermal activity affects the climate.
Yes, the heating effects are necessarily quite local, but because of the ramifications with regard to glacier melt for the remaining ice sheets currently, and the melting of the great ice sheets that covered much of the Earth 18,000 years ago, I don’t know that I’d agree that geothermal heat flux is a negligible player in the Earth’s climate system. After all, the authors of the featured paper (Demezhko et al., 2017) conclude:
“The amount of heat accumulated by the Earth in the last glacial cycle is a small fraction (<1%) of the heat released due to insolation changes. At the same time, the amount of heat spent on glacier melting is comparable with heat coming due to insolation.”
Viterito, 2017
https://www.omicsonline.org/open-access/the-correlation-of-seismic-activity-and-recent-global-warming-2016update.pdf
The Correlation of Seismic Activity and Recent Global Warming (CSARGW) demonstrated that increasing seismic activity in the globe’s high geothermal flux areas (HGFA) is strongly correlated with global temperatures (r=0.785) from 1979-2015. The mechanism driving this correlation is amply documented and well understood by oceanographers and seismologists. Namely, increased seismic activity in the HGFA (i.e., the mid-ocean’s spreading zones) serves as a proxy indicator of higher geothermal flux in these regions. The HGFA include the Mid-Atlantic Ridge, the East Pacific Rise, the West Chile Rise, the Ridges of the Indian Ocean, and the Ridges of the Antarctic/Southern Ocean. This additional mid-ocean heating causes an acceleration of oceanic overturning and thermobaric convection, resulting in higher ocean temperatures and greater heat transport into the Arctic. This manifests itself as an anomaly known as the “Arctic Amplification,” where the Arctic warms to a much greater degree than the rest of the globe. Applying the same methodology employed in CSARGW, an updated analysis through 2016 adds new knowledge of this important relationship while strengthening support for that study’s conclusions. The correlation between HGFA seismic frequency and global temperatures moved higher with the addition of the 2016 data: the revised correlation now reads 0.814, up from 0.785 for the analysis through 2015. This yields a coefficient of determination of .662, indicating that HGFA [high geothermal flux area] seismicity accounts for roughly two-thirds of the variation in global temperatures since 1979.
Day 141. Arctic sea ice
MASIE extent now above 2006, 2007, 2008, 2009, 2010, 2011, 2014, 2015, 2016
For last 18 days has had the slowest “melt from maximum” in over 10 year.
NSIDC extent now above 2004, 2006, 2011, 2015, 2016
For last 17 days has had the slowest melt from maximum this century. (that’s as far back as I have bothered with calculating)
[…] precisely. News flash to all Climate Alarmists, CO2 doesn’t cause volcanic eruptions. Volcanos are melting the Antarctic ice, not CO2. BTW, unlike CO2, volcanos can also warm water and melt glaciers from […]
OT
In one MORONIC video, Josh Willis totally destroys any possible credibility of ARGO sea data.
He should be IMMEDIATELY removed from anything to do with real science and measurements related to ARGO.
https://notalotofpeopleknowthat.wordpress.com/2017/05/22/nasas-josh-willis-destroys-whatever-credibility-he-had-left/
I frequently raise this. It has completely debased the validity of ARGO data; yet another data set to throw on the scrap heap due to interference by the gate keepers.
It demonstrates that climate science is not a science, and that there is no quality control.
There may have been good reason, or at any rate some reason, to suspect that some of the ARGO’s buoys were running warm. But if so, how should you address the problem? Further if some buoys were erroneously running warm, there must be some risk that some of the buoys would be suffering from a similar defect only going the other way, ie., running cool.
if this was a genuine science seriously concerned about quality control, one would take a random sample from the buoys suspected of reading warm and those possibly reading cool, and return these to the laboratory for testing. The equipment would have been tested to see whether there was any equipment fault, error, calibration problem etc, and if and only if there was a problem, would steps be taken to deal with the real and verified issue/problem.
Instead, without confirming whether there was any problem at all, a series of buoys were simply taken out of the data set because the data was not liked and did not fit with the a priori meme.
This bias and lack of quality control is truly startling. It tells you everything that you need to know about this science.
OT,
yet ANOTHER solar FAILURE.
This time in Australia.
http://joannenova.com.au/2017/05/another-glorious-solar-scheme-fails-ignominiously-fast-clouds-rusty-pipes-dumb-decisions/
Seriously, if you can’t make solar work in Australia, there is something massively WRONG with how it operates. !!!
The text in your linked article is full of errors, typical of this type of website. First it’s solar reflectors, then solar panels. Crek instead of Creek. The link in there to the story about the fail in the Sidney Morning Herald return a 404 error, etc … you get the point.
Projects fail and if you read the original SMH article you’ll also understand why: missmanagement.
http://www.smh.com.au/business/fastmoving-clouds-how-cs-energys-kogan-creek-solar-boost-project-failed-20170516-gw5p2u.html
no .. incompetence. it is solar, after all,
Not as though it was a large company like Solyndra 😉
“Seriously, if you can’t make solar work in Australia, there is something massively WRONG”
Like Germany’s ambitions in Spain or North Africa, two big sinkholes for Germany money.
I find all of this interesting and hope to be around long enough to see the claims resolved.
I do not claim, but sometimes wonder if ENSO is driven by tectonic plate movements.
Have a Google at “tectonic plates enso”.
nothing like idle speculation and what if statements based on possibilities instead of observations and real data. 200 years of science involved in the dolomite problem. Many brilliant minds tacked it and came up with ideas only to be totally wrong. Man always finds ways to explain why his ideas should work and chooses to ignore the obvious. Climate science is like this. People choose to believe whatever they wish and close their minds to obvious observations when ill suited for their belief. Have fun.
[…] Kenneth Richard, May 22, […]