Polar snow and ice cover rarely cooperates, no matter what side of the warming issue you may be on. It changes so fast.
When ice cover climbs, skeptics like to claim that it shows global warming isn’t what it is often hyped up to be. And when ice cover drops to satellite era record lows, the alarmists start screaming and hollering, forgetting that low ice levels were not uncommon in the past 100 years. They freaked out just some months ago when the yearly autumn Arctic sea ice recovery faltered and fell to “record” lows. Immediately they began predicting near ice-free conditions for the coming summer.
Just as the weather does, polar ice and snow cover also acts unpredictably, and now just a few months later Northern Hemisphere snow and ice cover is back within the normal range.
Winter snow and ice cover trend for the Northern Hemisphere has in fact been trending upwards since statistics started.
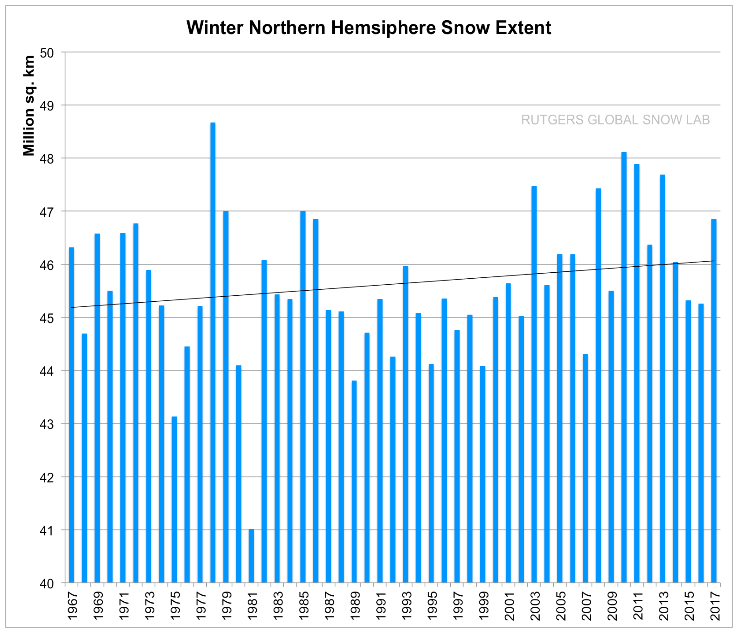
Source: Rutgers University
And when one applies the 30-year weather mean used to define climate, the winter trend since 1987 is strongly upwards. So is the autumn trend. This 2017 winter was well above average, ranking in the top 10.
The Greenland snow and ice surface mass balance is currently also near record levels:

Source: DMI.
As meteorologist Joe Bastardi, said, it’s going to take a fair amount of warmth to make the added ice go away again. The following chart shows the changes since Sept. 1, 2016.

Source: DMI. “Map of the accumulated surface mass balance (in mm water equivalent) from September 1st to now.”
The vast majority area of Greenland has seen surface snow and ice gain over the past 9 months. Moreover, Arctic temperatures for now are below normal:
Source: DMI.
The big development in recent Arctic news is the “recovery” of Arctic sea ice extent, which now is back in the normal range. Quoting in part Mark Twain, reports of its death “have been greatly exaggerated”. Just months ago, alarmists were claiming an irreversible death spiral.
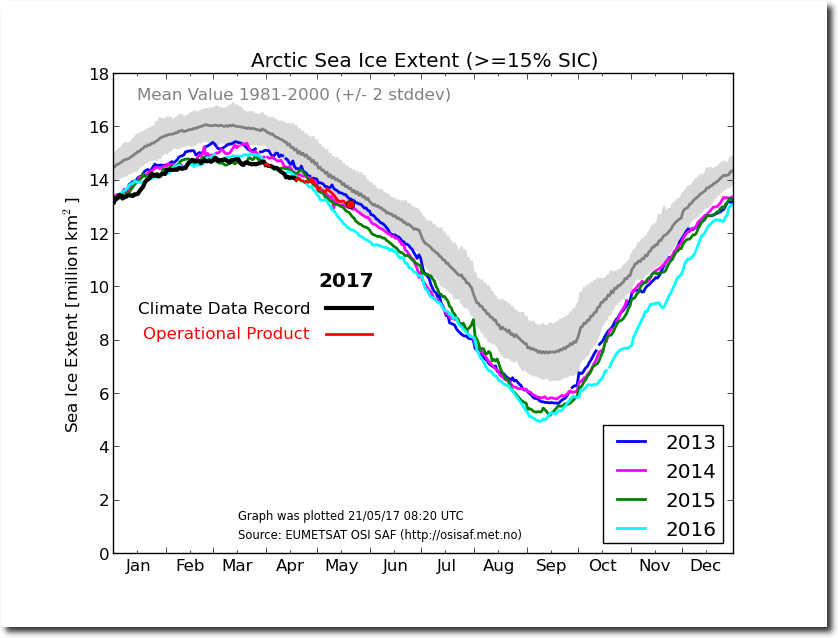
Source: DMI
Depending on Arctic weather conditions later this year, anything is possible as to what the Arctic does over the coming months. One thing is sure: Its death has long been exaggerated.


It will be interesting to see how warmists try countering this post and the charts:
https://realclimatescience.com/wp-content/uploads/2017/05/51046-1.jpg
We might start by showing the coolists another figure from “Holocene climate change in Arctic Canada and Greenland.” Yes, the Greenland ice sheet gained mass in the last 4,000 years but the Laurentide Ice Sheet continued to melt during the entire Holocene. And now the Greenland ice is loosing a few hundred gigatons of ice each year.
http://imgbox.com/SvuCgvto
http://imgbox.com/DSGYwWpm
Yes, since about 2003, the Greenland ice sheet has been losing mass (relative to the 1961-1990 mean, which was a time of GIS mass gain).. Even from 1992-2002, the Greenland ice sheet was still gaining mass…
http://icesat.gsfc.nasa.gov/icesat/publications/IGS/mass_changes_2005.pdf
The Greenland ice sheet is thinning at the margins (–42 ± 2 Gt/yr–1 below the equilibrium-line altitude (ELA)) and growing inland (+53 ± 2 Gt/yr–1 above the ELA) with a small overall mass gain (+11 ± 3 Gt/yr–1; –0.03 mm a–1SLE (sea-levelequivalent)).
—
How much ice did Greenland lose between 1920 and 1940, Craig? I ask because that period was actually just as warm, if not slightly warmer, than recent decades:
—
Box et al., 2009: “The annual whole ice sheet 1919–32 warming trend is 33% greater in magnitude than the 1994–2007 warming.”
—
https://notrickszone.com/wp-content/uploads/2016/12/Holocene-Cooling-Greenland-Southeast-Hasholt-16.jpg
—
https://notrickszone.com/wp-content/uploads/2016/10/Holocene-Cooling-Greenland-Ice-Sheet-1840-2007-Box09-copy.jpg
—
https://notrickszone.com/wp-content/uploads/2016/12/Holocene-Cooling-Greenland-Ice-Sheet-van-As-16.jpg
And what caused that 1920s to 1940s ice loss? What mechanism? And why was the glacier melt contribution to sea level rise so much higher during 1920-1950 than after…considering CO2 concentrations remained largely steady during that period?
https://notrickszone.com/wp-content/uploads/2017/04/Holocene-Cooling-Glacier-Melt-Contribution-Sea-Level-Gregory-2013.jpg
https://realclimatescience.com/wp-content/uploads/2017/05/51047-1.png
The relevant graph of course is spring:
http://climate.rutgers.edu/snowcover/chart_seasonal.php?ui_set=nhland&ui_season=2
Sod,
The WINTER Northern Hemisphere snowfall chart covers the entire time frame,yet still shows an increase over time. You trying to derail the main point of the blog post,shows your desperation for what it is,lets deflect with an irrelevant point you tried to make. Spring is included in the WINTER chart.
The IPCC SIXTEEN YEARS ago,stated that there would be LESS snow and more Rain/Freezing rain. This is another AGW based modeling predictive failure.
If the snow is melting away faster each year it doesn’t matter how much fell in the winter. More snowfall doesn’t mean colder temperatures but faster melting of snow requires warmer weather.
Can you link to the IPCC paper predicting less snowfall? They do say stupid things from time to time.
The 2001 report says:
“Milder winter temperatures will decrease heavy snowstorms but could cause an increase in freezing rain if average daily temperatures fluctuate about the freezing point.”
http://www.ipcc.ch/ipccreports/tar/wg2/index.php?idp=569
Rutgers Snow labs show a long term INCREASE in snowfall.
♦ IPCC TAR (2001): “Milder winter temperatures will decrease heavy snowstorms“
♦ Kunkel et al., 2002: “Surface conditions favorable for heavy lake-effect snow decreased in frequency by 50% and 90% for the HadCM2 and CGCM1 [models], respectively, by the late 21st Century. This reduction was due almost entirely to … an increase in average winter air temperatures.”
♦ IPCC AR4 (2007): “Snow season length and snow depth are very likely to decrease in most of North America“
♦ Kapnick and Delworth, 2013: “In response to idealized radiative forcing changes, both models produce similar global-scale responses in which global-mean temperature and total precipitation increase while snowfall decreases. … By using a simple multivariate model, temperature is shown to drive these trends by decreasing snowfall almost everywhere” (press release) “In North America, the greatest reductions in snowfall will occur along the northeast coast, in the mountainous west, and in the Pacific Northwest. Coastal regions from Virginia to Maine … will get less than half the amount of snow currently received.”
– See more at: https://notrickszone.com/2017/01/19/defying-ipcc-models-u-s-blizzard-frequency-has-nearly-quadrupled-since-1960-as-u-s-continues-cooling/#sthash.cu8sJpaU.dpuf
Defying IPCC Models, U.S. Blizzard Frequency Has Nearly Quadrupled Since 1960, As U.S. Continues Cooling
no.
this is winter:
http://climate.rutgers.edu/snowcover/chart_seasonal.php?ui_set=eurasia&ui_season=1
and this is spring:
http://climate.rutgers.edu/snowcover/chart_seasonal.php?ui_set=eurasia&ui_season=2
I chose Eurasia because the effect is even bigger there: Spring shows a real and significant trend. You can spot this with your eyes and an analysis will confirm it. Winter is at best slightly significant, a wobbling line that barely gives an upward trend.
The same trick is used by an arctic – antarctic comparison, by the way. Stop doing this please!
Sod,
is working on a stawman fallacy,since no one here dispute a decline in spring snow. Your own link shows Snowfall growth in Fall and Winter in Europe too. The ONLY decline is in the spring,which normally gets less snowfall than in Fall and Winter anyway. Most areas get most of their yearly snowfall totals in October to March time block.
What you miss as usual,is that FALL and WINTER show significant snowfall growth over the last few decades, a strong contradiction to the IPCC reports saying declining snowfall is to be expected.
Don’t continue be this dumb.
the chart is not for “snowfall”. Look again. It is “snow extent”.
Therefore, perfectly sensible in a warming world that areas once covered by snow till late spring are uncovering earlier.
Ask any skier.
The resident science-denier troll, trying to salvage his confirmation-bias. The resident trolls are becoming increasingly desperate and pathetic, and they were rather lousy when they came here…
“… the 30-year weather mean used to define climate ”
Those 30-year means [or averages, and not necessarily the best measure to use] are defined as climate normals.
The history of this is from the 1930s, before computers, when meteorologists meeting as the International Meteorological Organization (IMO) sought a reference for various comparisons.
Climate, or climates, are better described by the Köppen-Geiger system that was initially established using ecotones, a transition area between two biomes. Thus, it used plants. Being time consuming and requiring much fieldwork, instruments soon replaced the better concept. Plants “integrate” the seasonal and longer term weather and allow for maps to show the patterns — climate zones.
The last comment regarding the extent of Arctic sea-ice misses the point. The grey area is the +/- 2 sigma range, the normal is the line in the center of the grey area. This graph shows the situation more clearly:
http://nsidc.org/data/seaice_index/images/daily_images/N_stddev_timeseries.png
Neither graph represents “recovery” of the sea-ice extent. The 2012 melt season produced the lowest extent at the end of the melt season, yet at this date in 2012, the extent was greater. Watch the graph above to see what happens as the melt season begins to take hold. Of course, the minimum extent, the result of a year of freezing and melting, won’t be known until September…
“Neither graph represents “recovery” of the sea-ice extent.”
Yes it does,
Arctic sea ice has been recovering from the EXTREME levels of the late 1970’s
There is STILL way more Arctic sea ice than there has been for 90-95% of the rest of the Holocene.
The only period the extent has been higher is during the LIA and the lead -up and thaw from that COLDEST period in the last 10,000 years.
“Arctic sea ice has been recovering from the EXTREME levels of the late 1970’s”
faery tale data to compare to. Donald Trump also is much better than that evil Queen from the stories of old, or is he not?
again my simple wish: if you compare to old data, please include error ranges that show the difference in data quality.
1979, was the high point of the 20th Century.
Multiple graphs say something different:
https://nsidc.org/sites/nsidc.org/files/images//mean_anomaly_1953-2012.png
or here:
https://static.guim.co.uk/sys-images/Guardian/Pix/pictures/2013/9/19/1379557459907/WalshChapman2013_450.jpg
this graph has error bars. ouch.
https://static.skepticalscience.com/graphics/Kinnard_2011_sea_ice_med.jpg
The first graph proves the point.
Early Mid 1970’s were the highest.
Guardian and SKS.. they, and you, have ZERO credibility, sob
How about recorded data rather than alarmist fabrications.
https://s19.postimg.org/bkgbf2prn/Icelandic_sea_ice_index_2.png
Masses of evidence of low sea ice through the 1920s-1940s..
…. ignored totally by the AGW scammers, of course.
All REAL evidence points to late 1970’s extents being as high as the latter part of the LIA.
[Arctic ice DOE.gif](https://postimg.org/image/onza9b2wf/)
combined with pre-1979 satellite data proves that to be the case.
https://wattsupwiththat.files.wordpress.com/2012/03/ipcc_1_extent_anomalies_fig_7-2a.png
Add 0.5 x 10⁶ km² to the 1975 DOE, then look at the huge spike in 1979.
REAL measurements, sob-sob.. the sort you always DENY.
first link may not work, try this
https://s19.postimg.org/bwl42st4j/Arctic_ice_DOE.gif
When we combine the two MEASURED data sets, matched at 1975 we get this
https://s19.postimg.org/qpsz7xbw3/DOE_sats.jpg
When you combine anything, please take care of the scale. The black graph should be compressed in both x and y dimensions.
I took the liberty to compare those two graphs (by scale) with the NSIDC graph from above: http://imgur.com/a/oiTsl
If you still think that ice extent was abnormaly high in the 70s, then get some glasses.
P.S.: The (red) graph from Vinnikov et al can’t be the annual mean or they were off by almost a factor of 2. Could it be the summer extent? Anyway, doesn’t really matter, the anomalies for summer extent and mean extent aren’t that different to change anything in my combination above. (http://www.woodfortrees.org/plot/nsidc-seaice-n/from:1979.66/every:12/plot/nsidc-seaice-n/mean:12/offset:-5)
“The first graph proves the point.
Early Mid 1970’s were the highest.”
the graph directly CONTRADICTS your “point”.
your claim was this:
“Arctic sea ice has been recovering from the EXTREME levels of the late 1970’s””
and sunsettommy even added this nonsense:
“1979, was the high point of the 20th Century.”
my first graph has the maximum in the late 60s, not in the late 70s.
https://nsidc.org/sites/nsidc.org/files/images//mean_anomaly_1953-2012.png
the summer graph might even be a bit more early, late 50s?
https://static.guim.co.uk/sys-images/Guardian/Pix/pictures/2013/9/19/1379557459907/WalshChapman2013_450.jpg
It also shows a clear plateau for the whole rest of the last century.
occasionally factor in a fact or two between your believes.
PS: can people here really not see the obvious difference between the pure illustration of the graphs that both sides are posting here?
Sebastian, me and other are posting real data based graphs, while the typical “sceptic” visual is some garbage bad photocopy of whatever hand painted nothingness that someone once found in a book from the 80s!!!!
sob-sob remains wilfully IGNORANT.
Icelandic sea ice records clearly show the extent past Iceland in the late 1970’s to be as extreme as during the LIA.
That’s the FACTS
Greenland Ice area has be shown to be just a tiny amount down from the EXTREMES of the LIA.
You want it COLD, then move out of your inner-city ghetto basement, and go live in northern Russia.
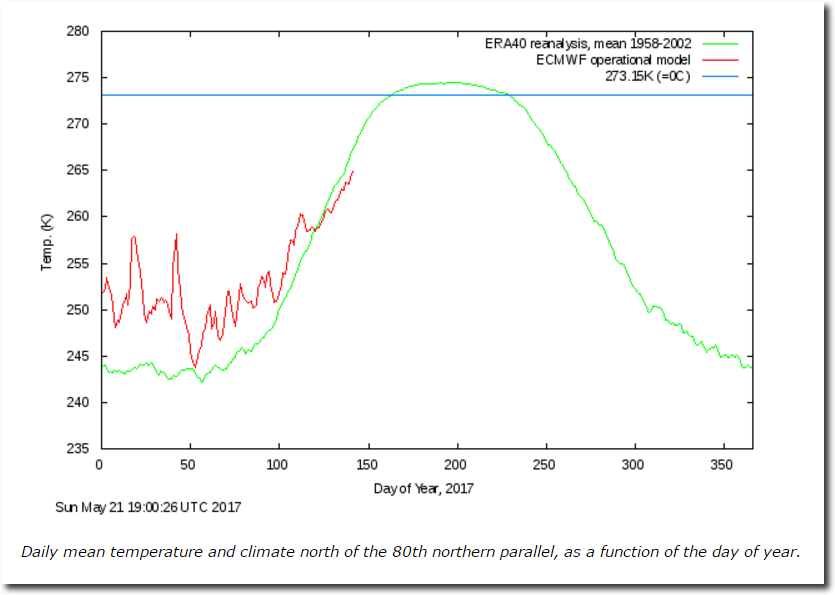
I think it is worth noting the ragged left side of the DMI chart for Sun May 21 for temps north of the 80th Parallel.
On the DMI source page, dates under Arkiv show the archived yearly charts. Have a look at the one for 1990.
Alarmists will look at the spikes up and declare a heatwave in the Arctic. Actually, these ~10 K dips and spikes are common. They are just storms or weather and not long term changes in climate.
Where we live, today – 5/23 – is expected to hit 28.9 °C (84°F) while tomorrow it is only going to get to 16.7°C (62°F).
At such a rapid rate of change, we’ll have a glacier in the backyard by next Tuesday.
“Winter snow and ice cover trend for the Northern Hemisphere has in fact been trending upwards since statistics started.”
A warming climate means more moisture in the atmosphere. It may be snowing more but the snow melts sooner. Rutgers also show the trend for spring snow extent has been falling at 3 times the rate it is growing in the winter.
http://imgbox.com/jh2P3j91
“Greenland snow and ice mass is currently also near record levels:”
https://notrickszone.com/wp-content/uploads/2017/05/Greenland-son-ice-mass.png
Don’t confuse the surface mass balance with the total mass of the ice sheet. The DMI web site says this just above the image you used:
“Note that the accumulated curve does not end at 0 at the end of the year. Over the year, it snows more than it melts, but calving of icebergs also adds to the total mass budget of the ice sheet. Satellite observations over the last decade show that the ice sheet is not in balance. The calving loss is greater than the gain from surface mass balance, and Greenland is losing mass at about 200 Gt/yr.”
A 2016 paper in Cryosphere agrees, showing that the surface mass balance of Greenland is not keeping up with the solid ice discharge into the sea. Since 2003 Greenland has lost 4,000 gigatons of ice.
http://imgbox.com/DSGYwWpm
http://www.the-cryosphere.net/10/1933/2016/tc-10-1933-2016.pdf
Here is a graph of Greenland Total Ice Mass since 1900.
https://s19.postimg.org/9iwxep7jn/Greenland_Ice_Mass.png
In fact, the current level of Greenland ice area is HIGHER than it has been for some 90% of the last 7000-8000 years.
https://s19.postimg.org/ceo16fi7n/Greenland-Ice-Sheet-Briner.jpg
Andy, where did your flat line graph for Greenland Total Ice Mass come from?
Craig, the Greenland ice sheet gained mass overall between 1940 and 2000, and during the 1901-2010 period, the entire ice sheet contributed only 1.5 centimeters to sea level rise. A “rise” of 0.015 of a meter over a 110-year period in ice melt contribution looks like a flat line.
James Hansen believes sea levels will rise by 10 feet by 2065 (“10 feet in 50 years” as of 2015 was the paper’s claim) due to Greenland and Antarctic ice sheet melting. Do you share his beliefs, or do you think the catastrophe will be less pronounced? And if you think SLR will be 10 feet or something close to it, why do you think the SLR contribution from the GIS was just 1.5 cm in the last 110 years? When will the catastrophe begin?
—
Fettweis et al., 2017
https://notrickszone.com/2017/05/01/new-paper-greenland-gained-ice-between-1940s-2000s-added-just-1-5-cm-to-sea-levels-since-1900/
“Results from all MAR simulations indicate that the period 1961–1990, commonly chosen as a stable reference period for Greenland SMB [surface mass balance] and ice dynamics, is actually a period of anomalously positive SMB (∼ +40 Gt yr−1 ) compared to 1900–2010. … [T]he ERA-20C forced simulation suggests that SMB [surface mass balance] during the 1920–1930 warm period over Greenland was comparable to the SMB of the 2000s, due to both higher melt and lower precipitation than normal.”
“The period 1961–1990 has been considered as a period when the total mass balance of the Greenland ice sheet was stable (Rignot and Kanagaratnam, 2006) and near zero. However, at the last century scale, all MAR reconstructions suggest that SMB [surface mass balance] was particularly positive during this period [1961-1990] (SMB was most positive from the 1970s to the middle of the 1990s), suggesting that mass gain may well have occurred during this period, in agreement with results from Colgan et al. (2015).”
“Finally, with respect to the 1961–1990 period, the integrated contribution of the GrIS SMB anomalies over 1900–2010 is a sea level rise of about 15 ± 5 mm [1.5 cm], with a null contribution from the 1940s to the 2000s, suggesting that the recent contribution of GrIS to sea level change (van den Broeke et al., 2016) is unprecedented in the last century.”
oh dear, poor Craig can’t even do a bit of basic research for himself.
Craig.. if you think it is wrong.. produce your own.
heck, even seb figured it out eventually !
surely you can do better than him… or not.
“Craig.. if you think it is wrong.. produce your own.”
That’s the problem Andy. I did look for data on the mass of the Greenland ice sheet and what I found said there was a 110 gigaton gain from 1992 to 2002 and a 4,000 gigaton loss from 2003 to 2015. I linked to my source. I don’t see the point of searching until I find a paper backing what you said. A graph without a source is meaningless.
So you didn’t consider data prior to 1992 relevant to understanding what happened in those 92 years? Did you realize that the GIS gained mass between 1940 and 2000? Did you realize the ice melt contribution to sea level rise was much higher during 1920-1950? Did you realize the Greenland ice sheet has only contributed 1.5 centimeters to sea levels since 1901?
notrickszone.com/2017/05/01/new-paper-greenland-gained-ice-between-1940s-2000s-added-just-1-5-cm-to-sea-levels-since-1900/
Instead of just focusing on a short-term period, why not consider the larger picture?
“A graph without a source is meaningless.”
So you admit to your continued ignorance.
The data is out, actually very easy to find.. all you have to do is have the ability to find it and use it.
I won’t hold my breath for you doing that.
As I said….
Show where the graph is incorrect or STFU !!
“why not consider the larger picture?”
Ahh.. the larger picture…
https://s19.postimg.org/ceo16fi7n/Greenland-_Ice-_Sheet-_Briner.jpg
Shows that Greenland ice area is higher than it has been for most of the last 7000-8000 years.
The ONLY time its been higher is during the COLDEST period in in the last 8000 or so years, and the area is only a tiny amount down from that extreme.
I wonder if Craig wants to go back to those bleak, cold times.. or if he lives in a warm inner-city ghetto basement.
“why not consider the larger picture?”
I have shown Craig “the larger picture” in the form of the Total Greenland Ice Mass graph.
https://s19.postimg.org/9iwxep7jn/Greenland_Ice_Mass.png
But he cannot accept the FACTS. !!
I did have a discussion recently as to where exactly the line should be positioned.
It depends on the volume estimate used, and the conversions for density.
The actual line could be positioned anywhere between about 2.4 E15 or 2.6 E15 tonnes.
But the slope of the line would still be the same..
Andy, the mentioned loss in ice mass represents 2 pixels in your first graph. Zoom in an see if it really is a straight line or if it in fact shows a decline of 2 pixels.
Still convinced that nothing changed?
Still convinced anything worthwhile even mentioning has happened?
Or are just going to continue the pointless yapping.
A closer look at just how monumental the human influence has been on the Greenland ice sheet:
https://notrickszone.com/wp-content/uploads/2016/12/Holocene-Cooling-Greenland-Ice-Sheet-Briner-16-Anthropogenic-copy.jpg
Decrease in surface area (your graph) and loss of mass are two different things. If the ice is really melting from below there is no reason the surface area should significantly decrease, but mass will. 200 Gt/year (2*10^14 l) says this website: http://beta.dmi.dk/en/groenland/maalinger/greenland-ice-sheet-surface-mass-budget/
2*10^14 l of water evenly distributed over an area of 3.619*10^14 m² (ocean surface) would increase the sealevel by 0.55 mm.
Actually, since 2013, the loss has been -128 Gt/yr on average per NOAA, which is a dramatic deceleration from the 2008-2012 period averages (-367 Gt/year). With the near record highs in mass balance for 2016-’17, and likely net gain for this year (it was only -6 Gt in 2013-’14), it’s likely the deceleration in SMB losses will be continuing, in line with the cooling trend in the North Atlantic that is making its way north.
https://notrickszone.com/wp-content/uploads/2016/12/Greenland-Ice-Sheet-Mass-Balance-Loss-Deceleration-2.jpg
“would increase the sea level by 0.55 mm.”
Holy CARP !! PANIC TIME !!!!!
GRACE.. umm.. that worked well in the Antarctic.
Trouble is , that it is gravity based, and both the Arctic and Antarctic sit over moving magna regions, making gravity based measurements dubious at best.
Did you know that GRACE once found a mountain in Indonesia that doesn’t exist
“To calculate GrIS MB using the MBM we combine SMB
components calculated with the regional atmospheric climate
model RACMO2.3 with annual estimates of D”
Yep, models and estimates.
That’s the way to produce the result you want to produce.
and it gets better
“In the absence of data, no changes in D are assumed between 1958 and1996. A seasonal cycle in ice-sheet-wide D is not considered,”
Relative to when? The Greenland ice sheet cooled and gained mass between 1940 and 2000. So a minor loss relative to a decades-long cooling/gain period just means there’s been a minor fluctuation in recent years. Why do you think the Greenland ice sheet cooled and gained mass for 60 years, Craig, just as CO2 emissions began rising explosively?
—
Even from 1992-2002, Greenland was still gaining mass…
—
http://icesat.gsfc.nasa.gov/icesat/publications/IGS/mass_changes_2005.pdf
Changes in ice mass are estimated from elevation changes derived from 10.5 years (Greenland) and 9 years (Antarctica) of satellite radar altimetry data from the European Remote-sensingSatellites ERS-1 and -2. The Greenland ice sheet is thinning at the margins (–42 ± 2 Gt/yr–1 below the equilibrium-line altitude (ELA)) and growing inland (+53 ± 2 Gt/yr–1 above the ELA) with a small overall mass gain (+11 ± 3 Gt/yr–1; –0.03 mm a–1SLE (sea-levelequivalent)).
Since 1900, the Greenland ice sheet has contributed a whopping 1.5 centimeters to sea level rise. Do you believe that is a catastrophe, Craig?
https://notrickszone.com/2017/05/01/new-paper-greenland-gained-ice-between-1940s-2000s-added-just-1-5-cm-to-sea-levels-since-1900/
“Craig T: ‘Since 2003 Greenland has lost 4,000 gigatons of ice.’
Relative to when?”
I think the better question is relative to what. I was talking about problems with Gosselin’s post “Greenland Ice Mass Near Record.” He confuses the surface mass balance with the total ice mass. The DMI source of his graph makes that clear and the Cryospheree paper shows the current ice sheet mass is several thousand gigatons below where it was in 2003.
It would be nice to just discuss the current post for once. When I show problems I wind up playing “whack-a-mole” with all sorts of topics far from the current one. Gosselin didn’t talk about Greenland throughout the Holocene, or sea level rise, or even the Greenland ice mass in 1940.
Gosselin did show that the IPCC was wrong when it said there would be less snowfall. Everything else is not backed up by his references. The current Arctic sea ice extent is no longer at the lowest in satellite record but it is still over two standard deviations below the 1981 – 2000 average. That’s not “back in the normal range” for the time frame he is talking about.
The press does get excited when a new climate record is set, but Sceptics get excited when conditions fall back afterwards. After the 2012 Arctic sea ice extent low, 2013 was called proof that the sea ice extent was in recovery.
Since 2013 the sea ice extent has fallen every year. Gosselin is pointing to the fact that after mid April the 2017 sea ice extent was no longer at record lows. In mid May it is higher than 2015 and 2016 but below the mark set in 2012. That’s a pretty slow recovery.
“That’s not “back in the normal range” for the time frame he is talking about.”
Arctic sea ice extent is currently higher than it has been for some 90-95% of the last 10,000 years.
“normal” is much less than current.
That’s because the Arctic is only a tiny bump above the coldest period in the last 10,000 years.
real data from US DOE and satellites shows that 1979 was an extreme year for sea ice.
https://s19.postimg.org/qpsz7xbw3/DOE_sats.jpg
Icelandic sea ice records show the late 1970’s spike as being up there with the EXTREMES of the Little Ice age.
https://s19.postimg.org/bkgbf2prn/Icelandic_sea_ice_index_2.png
“That’s a pretty slow recovery.”
Look at the flattish top of the last AMO, bozo.
This graph actually overlays Reykjavik temperatures over the AMO cycle
https://s19.postimg.org/yavxs1i7n/amoreyk.jpg
The AMO is only just starting to dip down after a flattish peak. North Atlantic temperature have dropped considerably.
Its going to be HILARIOUS watching the comedy antics of the Arctic sea ice worriers as the extent starts to climb again over the next several years 🙂
oh and from the AMO graph, you can see why the alarmist ice-worriers always start in 1979.
Coldest year in Reykjavik since 1880 !!!
”
oh and from the AMO graph, you can see why the alarmist ice-worriers always start in 1979.
Coldest year in Reykjavik since 1880 !!!
”
no. that is when the satellite data starts. Nobody cares about a single town.
AndyG55 … scale! When combining graphs, you have to at least get the scale right.
Here is a combination of ice extent chart with matching scales: http://imgur.com/a/oiTsl
Dumb seb
Graphing two totally different things, and probably doesn’t even know it. !! So DUMB.
Look at the DOE graph, minimum monthly average is about 5.75 Mkm² in 1960
Now let’s look at something actually graphing the same things.
http://hot-topic.co.nz/wp-content/uploads/2011/09/average-hr.png
When did it drop below 5.75 Mkm² seb?
And we know its been climbing since 2006.
So very obvious to anyone but an anti-science, mathematical inebriate, that current levels of Arctic Sea sea ice extent are very similar to the period from 1945 to 1960
MASIE has day 142 Arctic sea ice above all years (since 2006) except 2013, and has the slowest melt May in it whole record.
NSIDC also has the slowest May melt from maximum this century, and extent is above 2004, 2006, 2015, 2016
ps. It looks like the recovery back towards more normal Holocene levels has stopped, and if the AMO link in correct, will now head back up to extreme high levels again.
OT.
Just what the EU environment needs.
https://notalotofpeopleknowthat.wordpress.com/2017/05/23/eu-nations-set-to-wipe-out-forests-and-not-account-for-emissions/
Maybe they can then say they are not cutting down trees to make way for wind turbines.
So much for the green agenda.. it nothing to do with actually protecting the environment..
more like DESTOYING it.
This AGW religion has to count as one of the biggest SCAMS ever perpetrated on mankind !!
A great read on WUWT.
https://wattsupwiththat.com/2017/05/24/renounce-climate-alarmism/
Tells it how it is. !!
seb, sob-sob.. you particularly need to read it. !
I have read it and and don’t think this “tells it how it is”. It’s an essay by a delusional person with wild claims about the way thing are supposed to work (for him to be happy).
At first it reads like some creationist calling evolution a stupid idea. Then it drifts towards calling Europe and the rest of the world “occupied” and in need of “liberation”. Yeah, right 😉
I have a proposition for you: what if those that this author calls “climate alarmists” are actually the “climate realists” and he is just some conspiracy theorist who for whatever reason doesn’t like that the world is transitioning towards sustainable energy.
The essay is littered with sentences that paint the author as conspiracy theorist. He is not Galileo fighting those who reject him … it’s just a guy with a stron opinion who denies science. So the essay could have been as well about evolution vs. creation … replacing “climate change” or “climate alarmist” with evolution and evolutionist doesn’t change the meaning of this piece of c***
diddums… seb and sob didn’t like it.
Which gives it a VERY high chance of being correct.
The only nutcases are the people pushing the baseless anti-CO2, anti-science, anti-human, ANTI-LIFE, AGW scam.
That would, of course, include seb and sob.
You are correct Seb, evolution is a stupid idea.
I have rarely read similar garbage ever! and i read a lot of sceptic garbage.
The article is still interesting though and could make a good basis for discussion.
I will keep it short for now:
The problem here is burden of proof. Trump can of course “renounce” climate science. Then his bureaucracy will act, as if climate science was all false. This actions then will be challenged in court. Remember the travel ban?
Trump will do massive damage to the environment and to climate science. But there is one good aspect to it: It is a serious wake up call for every scientist. Their profession is under attack from right wing nutcases and they either defend themselves or they will suffer badly.
there is some huuuuge backlash incoming and only a person as stupid as Trump is not able to see it coming…
Trump is the start of the backlash against the far-left anti-science, anti-human, anti-life, anti-freedom, socialist totalitarian agenda.
Real scientists are not worried, only those that have helped promote the AGW scam though bad or agenda driven non-science.
Can we dismiss the climate alarmists calling for another ice age in the next 30 years?
A bit more warming would be highly beneficial, especially as it would occur in higher latitudes.
An ice age is much more of a problem for human existence
I bet you also choose to live somewhere warm, and use lots of fossil fuel to keep warm in winter.
Craig,
we are already in an ice age.
You really mean a short term cooling period?
He probably means predictions of climate alarmists like this one:
http://blog.hotwhopper.com/2013/12/denier-weirdness-crank-blog-popularity.html
In 2008 someone predicted the next ice age coming soon (2020 range).
PROVE that they were wrong… you can’t , can you seb.
And again you prove your basic mathematical ineptitude.. its not 2020 yet.
So…
Here’s a deal seb…
YOU STFU and POQ until 2020.
Then perhaps you will have something other than your unsupportable AGW religion.
At least this prediction is within our children;s lifetime.
EVERY short-term prediction of the AGW SACM alarmist has proven to be PURE FANTASY
The good news is that the so called modern warming period is now in the process of ending(now – through coming years) as solar activity is becoming very weak and will become weaker as we move forward.
I expect global mean temperatures to be at or below 30 year average means within the next 12 months.
I think it is a very low solar/increase albedo /lower overall sea surface temperature play that will result in lower global temperatures as we move forward from here.
Low solar – If solar irradiance deceases say by .15% that is a .2c reduction in global temperatures just do to that factor alone.
Increase albedo – even a 1/2 of 1% increase will result in a significant global temperature drop. Albedo should increase in response to very low solar conditions which should result in an increase in major volcanic activity , increase in global cloud coverage and sea ice/snow coverage.
Increasing galactic cosmic rays being a main factor for major volcanic activity to increase and global cloud coverage to increase while less EUV light should result in a more meridional atmospheric circulation which would also result in more clouds and also greater snow coverage.
I think at the start of global cooling the atmospheric circulation becomes more meridional only later to transition to a more zonal circulation.
Overall lower sea surface temperatures – this should happen as a result of weakening UV light which penetrates the ocean surface to significant depths which should impact the surface ocean temperatures.
My solar criteria which is now coming into play are
solar flux 90 or less
solar wind 350 km/sec or less
cosmic ray counts 6500 units or greater
euv light less then 100 units and uv light lessening just below visible light wavelengths
solar irradiance off by .15%
imf – 4.2 nt or lower
ap index – 5 or lower but isolated spikes which could contribute to an increaae in geological activity
All of this in combination with a weakening geo magnetic field which should compound given solar effects.
The test is on now that solar is finally reaching my cooling criteria and if global temperatures do not drop despite these low solar conditions I will be wrong, on the other hand if they do I think we will have to conclude that AGW theory is dead.
TO ALL AGW ENTHUSIAST YOUR THEORY WILL BE DEAD BEFORE YEAR 2020
MASIE is continuing to show the SLOWEST melt from maximum in its whole record (starts 2006)
NSIDC is continuing to show the SLOWEST melt from maximum this century.
Let’s all hope the cooling isn’t too deep or too rapid !!
The sum total of the above nitpicking takes on the aspect of
a group of theologians debating over how many angels can
simultaneously fit on the head of a pin. The warmists’
arguments, in particular, suffer from a chronic case of
myopia. With the characteristic climate data fluctuating at
the rate it normally does, it seems a dangerous enterprise
to extrapolate future climate from an opportunistic use
of tangents applied to ragged time-series curves as the basis
for predictions–that is unless the practitioners have some
ulterior purpose in mind.
HL
[…] Meanwhile Climate Depot reports: Exaggerated…Greenland Ice Mass Near Record […]
When the new scientific formula on clean energy discovered, the Paris agreement on climate change is funny because the world’s energy problem can be solved soon!
This new hydroelectric scientific formula (E>P+1at) is the near future of renewable energy in the world!
We can answer them with a new scientific formula which not only Mr President President Donald Trump will be pleased but also all the polluting industries in shock plunge and join me! The result is a 24-year-old research proves that the world’s energy problem will be solved soon!
(Ee>Ep+E1at) = (E>P+1at)
What is the most difficult scientific question of global hydroelectric that no one scientists could the answer to it?
Now the hard global question!
How can we produce clean energy in a best way by the potential of water Static head in dams & seas that this water pressure can push to the center of planet?
Answer:
This is by getting benefit of joint scientific formula (E>P+1at) with immersion turbines method inside the water of dams & seas (Immersion turbines of series and parallel in zero point of opposite forces).
Ee= High pressure clean energy that is produced by the water power plants in the depth of water via released fixed potential energy of water natural pressure (More than ten meters of water) with new method (Immersion turbines of series and parallel in zero point of opposite forces).
Ep= Released fixed potential energy of water natural pressure in water depth (More than ten meters of water).
E1at= Amount of energy that is consumed at a small pump of one atmosphere power is the ability (In the same place of the water power plant in water depth).
Many scientists believe that the discovery of the formula is unparalleled. Although many still in shock! How this formula has not be discovered by scientists in the world. Answer to a hard question that scientists are searching for hundreds of years and they can control of climate change and stop global warming soon.
My new formula and new method can change the world and start a new industrial revolution soon. Note: This new solution and this new formula invention in Iraq and Turkey to formally accepted.
This invention is patented in Department of Justice in Kurdistan of Iraq No. 952/6 on 12/6/2013.
http://rudaw.net/NewsDetails.aspx?pageid=110844
[…] Greenland Ice Mass Near Record… […]