Arctic: 12 Years Of Sea Ice
And Temperature Stability
In the last 144 months, or since 2005, there has been no decreasing trend in Arctic sea ice. In fact, there has been a slight increasing trend.
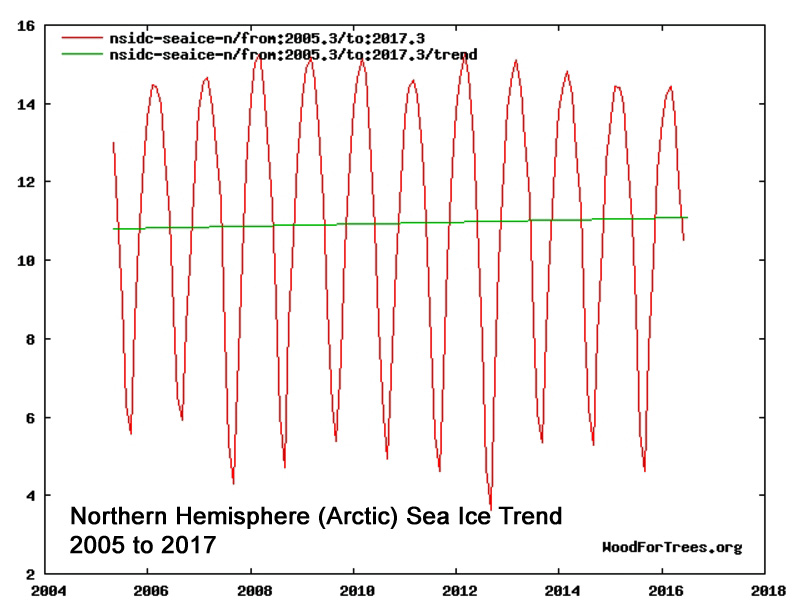
NSIDC Data – Graph Source: woodfortrees.org (2005.3-2017.3) or woodfortrees.org (Last 144 Months)
Since the 21st century began, nearly all of the increase in Arctic-wide temperatures occurred between about 2001 and 2005. Since mid-2005, the Arctic temperature trend has stabilized, with no significantly detectable warming.
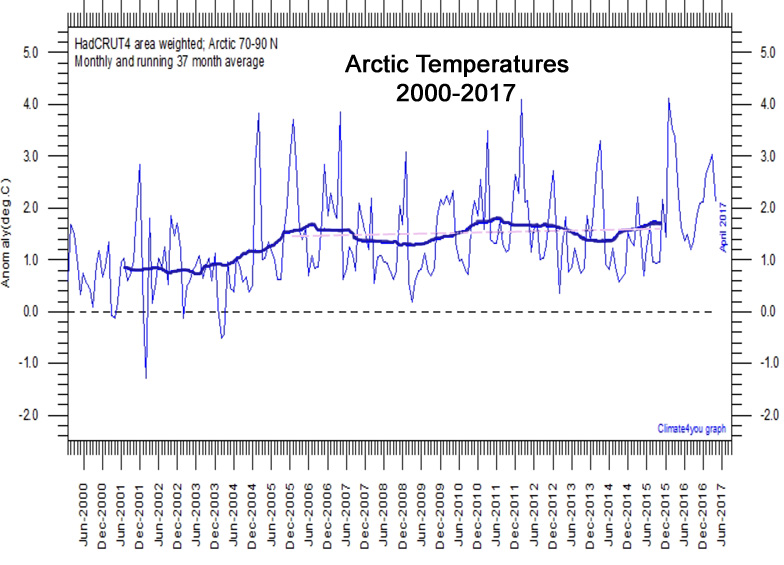
HadCRUT4 Data – Graph Source: climate4you
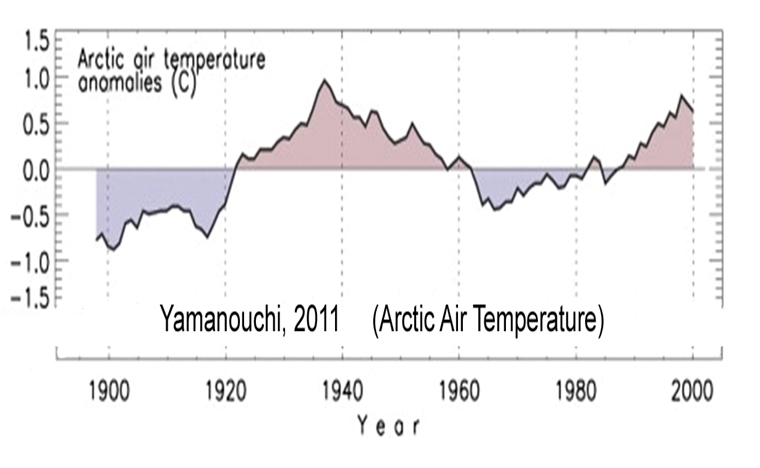
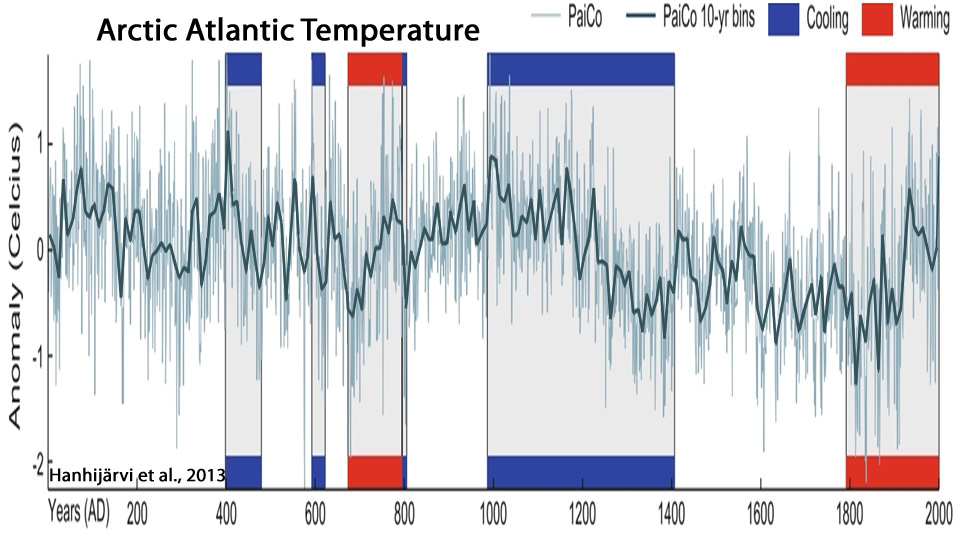
When viewed from a longer-term context, the current Arctic temperature trends are not unusual. In fact, the warmth of the last 12 years was matched during the 1920s to 1940s, with about 50 years of Arctic cooling in between.
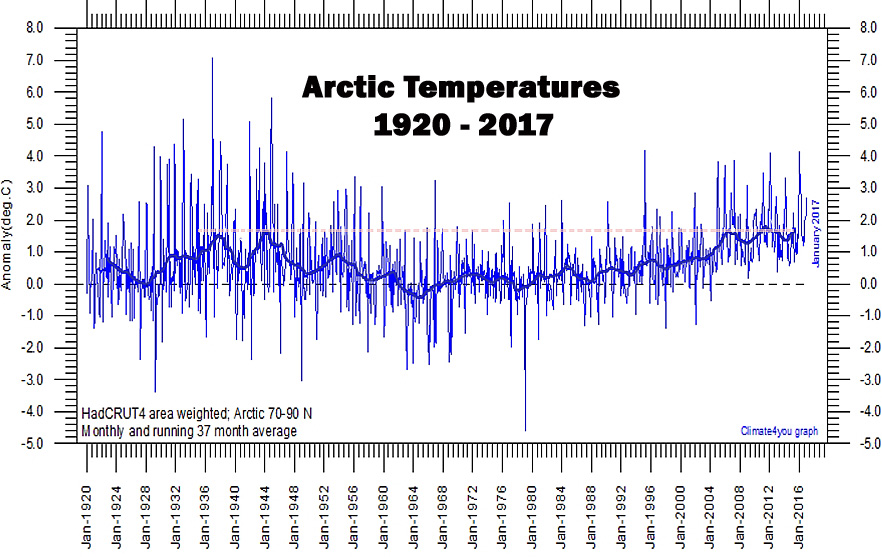
HadCRUT4 Data – Graph Source: climate4you
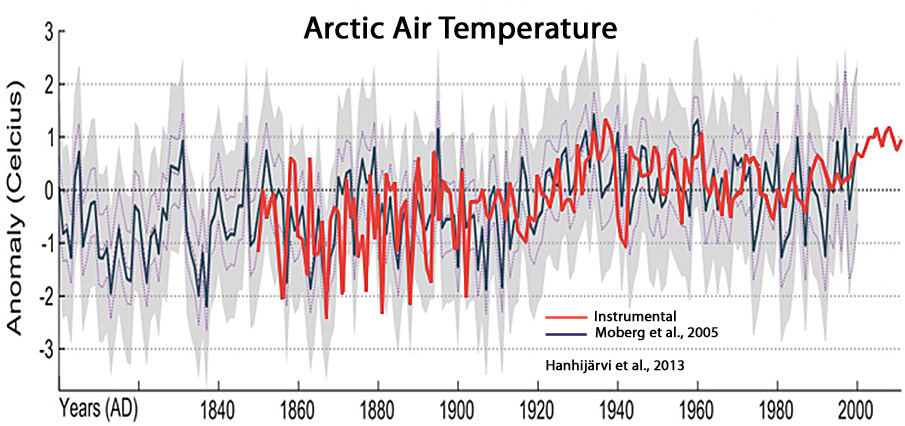
Hanhijärvi et al., 2013
Yamanouchi, 2011
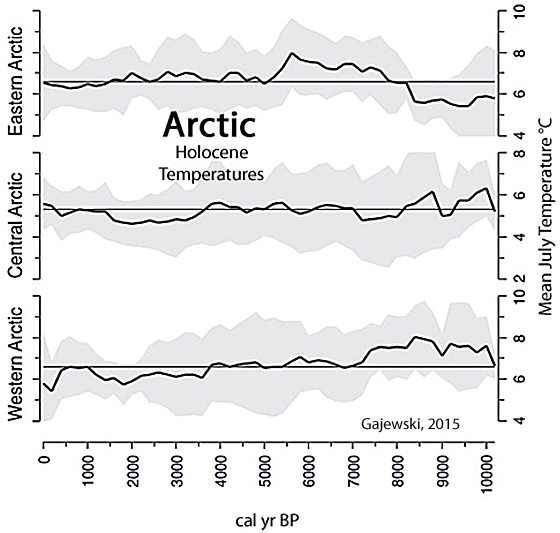
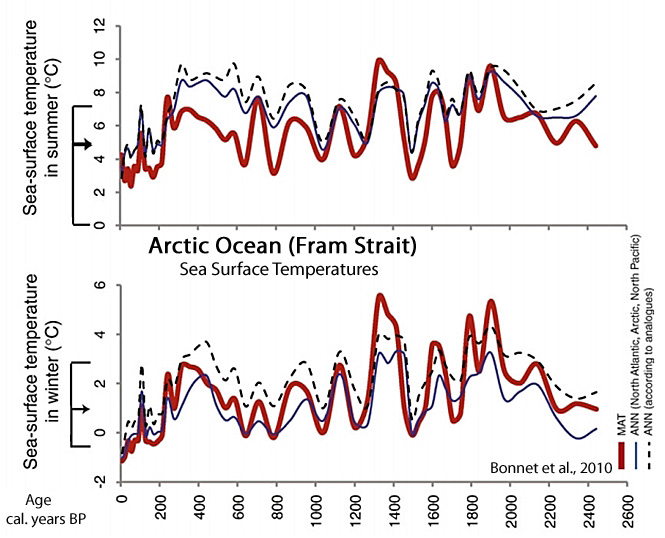
From a still longer-term perspective, not only are modern Arctic temperatures not unusual, they are still cooler than a significant portion of the last 8,000 years.
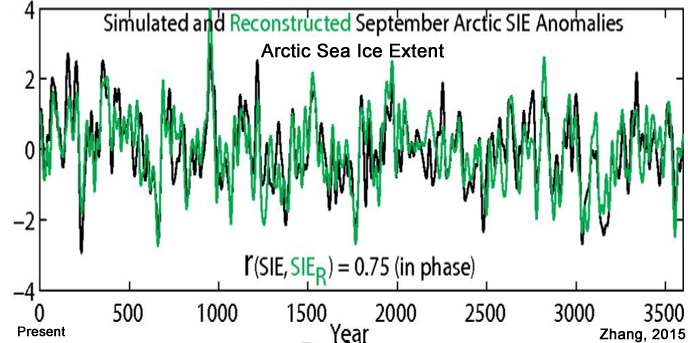
And not only is the current Arctic sea ice extent not unusual, there is still much more sea ice in modern times than there was during much of the Early Holocene, when the Arctic Ocean was sometimes ice-free during the summer months.
Spolaor et al., 2016
“Researchers have found that 8000 years ago the Arctic climate was 2 to 3 degrees warmer than now, and that there was also less summertime Arctic sea ice than today.”
Jakobsson et al., 2010
“The combined sea ice data suggest that the seasonal Arctic sea ice cover was strongly reduced during most of the early Holocene and there appear to have been periods of ice free summers in the central Arctic Ocean.”
Jakobsson et al., 2014
“Several studies suggest that the Early Holocene (∼6000–10,000 years BP) experienced less summer-sea ice than at present. …. [S]ea ice during the Early Holocene potentially could have moved over to a seasonal regime with sea ice-free summers due to the insolation maxima the Earth experienced at that time.”
Funder et al., 2011
“Arctic Sea Ice extent during the Holocene Thermal Maximum 8,000 years ago was less than half of the record low 2007 level. … Multiyear sea ice reached a minimum between ~8500 and 6000 years ago, when the limit of year-round sea ice at the coast of Greenland was located ~1000 kilometers to the north of its present position.”
Hanhijärvi et al., 2013
Zhang, 2015
Gajewski, 2015
Bonnet et al., 2010


MASIE shows a similar very slight increase.
https://s19.postimg.org/90mpuhc37/MASIE_Growth.png
Pity, because the people living up there could use sea ice levels nearer the much lower Holocene average.
A further decrease, back to the smaller extents of before the LIA, would have great benefits for travel, commerce, fishing etc etc.
I recently (early March iirc) did a pixel count of “old ice” from the Russian sea ice charts. These go back to 2008 in a constant compatible format and scale.
They show a clear increase in “old ice” since 2008.
https://s19.postimg.org/55jbrwsxf/Russian_multi-year_ice.png
2013 was low because of a large storm the year before.
Kenneth , a point to note.
You have to be really careful with linear trends on cyclic graphs.
They should really only be done from peak to peak or trough to trough, otherwise you risk introducing a trend that isn’t really there. (you can also use a horizontal mirror positioning at the ends, but that can be difficult)
The start and end points within a cycle can have a very district effect on the trend calculation.
This NSIDC trend graph is more correct, although I haven’t updated it for 2017 yet.
https://s19.postimg.org/umq1x3h4j/Arctic_ice_area_trend.png
Of course, using just the peaks is an anti-science, low-knowledge method, because the peaks and troughs are very often affected by WEATHER events, like the trough at the end of 2012 (large storm), and the peaks and troughs of 2015-2017 (very strong El Nino effects)were.
The first comment from you in a long time that actually makes sense and doesn’t use your usual language. What have you done to our AndyG55 imposter?
P.S.: You could also compute the average sea ice extent over 12 months before you compute the trendline. Or you can look at each month separately: http://imgur.com/a/fKych
ROFLMAO..
Poor seb STILL resorts to the 1979-now data.
Yes, bozo, we KNOW there has been a highly beneficial drop in Arctic sea ice since the extremes high in the late 1970’s, as part of the NATURAL AMO CYCLE.
You KNOW we are talking about the last 10 or so years..
… so why be SO DECEITFUL.
Deceit is a form of LYING, seb.. and seems to be inbuilt into your persona.
The extreme high in the late 1970s such as this? http://imgur.com/a/an666 (i adjusted the y-axis according to your suggestion of what was wrong with this graph: http://imgur.com/a/fuYbW)
Yes, I know. You two ignore take a timespan with two outliers and declare it a stable flat trend beginning in 2005 (Kenneth). Why don’t you two claim that sea ice extent is increasing since 2007? Or since 2012? And Kenneth’s first graph is still not showing what he likes to show … like you’ve written, trendlines with cyclical graphs are not an easy thing: http://www.woodfortrees.org/plot/nsidc-seaice-n/last:144/to:2016.42/mean:12/plot/nsidc-seaice-n/last:144/to:2016.42/mean:12/trend/plot/nsidc-seaice-n/last:144/to:2016.42/trend/plot/nsidc-seaice-n/last:144/to:2015.83/trend
Poor propaganda parrot, every time you try some puerile stunt, you eat more sock.
Current levels of Arctic sea ice are higher than they have been for 90-95% of the Holocene.
Your continued DELIBERATE and WILFUL IGNORANCE of natural ocean cycles is becoming a very low end comedy act.. even a stunned monkey would be more appealing and intelligent.
Arctic sea ice as been essentially level with a slight increase over the last decade at least, totally in line with the natural AMO cycle, which peaked in about 2006/7.
Your first graph shows , yet again, that you have absolutely NO IDEA what you are doing or what the data is. Your IGNORANCE increases exponentially day by day.
I wonder just how much cherry-picking you had to do to fabricate the WFT graph.
LAUGHABLE, yet again.
You really should stay away from things you know NOTHING about.. it degrades even the least intelligent AGW suckophant.
“trendlines with cyclical graphs are not an easy thing: ”
And , from your pathetic attempt on WFT, basically IMPOSSIBLE for someone with your low-end junior high maths non-skills.
I do have to wonder if you have a 3 year old child who produced that load of garage, because it does not come from a rational or intelligent mind.
You are LYING , yet again, seb
I purposely never told you what you are doing wrong, and I’m not telling you now.
You will just have to keep muddling along like a stunned numbat, making more and more of a fool of yourself.
Please tell us… Why do you LIE INCESSANTLY.????
Is that all you got? Going back full ranting clown mode from your reasonable comment above and claiming I would be wrong. Hmm …
Artic sea ice hasn’t been level. And when 2006/2007 was the “turning point” … what was the 2012 decrease then? An outlier? Using just the last 10 years to show that the average didn’t decrease in a graph like this (http://www.woodfortrees.org/plot/nsidc-seaice-n/last:1000/to:2016.42/compress:12) is just wrong for obivous reasons.
I greated this graph (http://imgur.com/a/an666) from your claim that the DOE data shows an extent of 6-7 million sq. km while current extent is 11-12 sq. km. So combining both charts with that in mind results in what you see… is that not your claim?
Or is it indeed correct to combine area charts in the way it has been done here: http://imgur.com/a/fuYbW
If not, tell me exactly how these would combine otherwise and I’ll correct it (again). I am waiting …
AndyG55, are you sure? And why not tell? Do you fear it could be wrong? Or this because you almost never come up with any hard facts? 🙂
You wrote:
And yes seb .. we know that REAL numbers are of no relevance to you.
DOE shows 6-7 million km²
Current average is around 9-11 million km²
Please explain.. because my sides are hurting from laughing at you.
You did know that the current Arctic sea ice extent is GREATER than what it has been for some 90-95% of the last 10,000 years didn’t you.
The current extent is ANOMALOUSLY HIGH.
—————
I was under the impression you meant that a graph of the current extent should be on the same scale as the DOE graph (http://imgur.com/a/an666), not as I previously did: combining the graphs viewing them as anomalies (http://imgur.com/a/fuYbW)
So both versions are wrong now? 😉 How do the red and the black graph then combine?
roflmao.
I can’t help it if you are WAY TOO DUMB to see your mistake.
You are not here to learn, but to disrupt.
I am not here to teach you.
You will remain .. FOREVER IGNORANT
and we can all enjoy your comedy act.
And yes seb.. Both versions of your graph are still MORONICALLY WRONG and indicate you haven’t got the slightest clue what you are actually graphing.
One day, I may enlighten you, but its too much fun watching you flapping around like a STUNNED MULLET with ZERO CLUE. 🙂
The mid-late 1970’s EXTREME Arctic sea ice shows up clearly on the Icelandic sea ice charts.
https://s19.postimg.org/bkgbf2prn/Icelandic_sea_ice_index_2.png
The huge increase in Arctic sea ice from the 1940’s to the late 1970’s is also clearly indicated in newspaper reports
https://youtu.be/dC_fVuJWZoY
Temperatures in Iceland and the Arctic region were also at their minimum in the late 1970’s after their peak in the 1940’s
https://s19.postimg.org/5ffms4j1v/iceland_8.jpg
https://s19.postimg.org/vws4z68s3/arctic_temp.png
The current temperature in the region is very close to those 1940’s temperatures.. and the current basically flat last 10 years of sea ice level is actually about in the middle of the range of the DOE graph 😉
In line with UNADJUSTED NH temperatures (we have very little real temperature info from the SH before the satellite era), the late 1940’s were about the SAME TEMPERATURE as now.
That means that there has been NO WARMING WHAT SO EVER from the highly beneficial increase in atmospheric CO2.
As seb has shown many times, there is NO warming of oceans or in a convective atmosphere from increased atmospheric CO2
That means that the climate sensitivity to CO2, must be zero or close thereto.
All this waste of money on “unreliables” and the massive destruction of developed countries’ electricity systems has been FOR NOTHING, based on LIES and MISINFORMATION.
The Climate AGENDA is one of the biggest SCAMS ever perpetrated on mankind.
An excellent post Kenneth Richard.
Hopefully this post will help ‘those who will not see’ get a better sense of both perception of natural variation, and an improved perspective of what nature does over the long term. Hopefully they will see how foolish is their belief that human CO2 generation can control the climate, as this small list of Arctic observations and modeled possibilities show such an idea is both banal and illogical.
I dare say this will not fully convince them, as their rationality is overwhelmed by a banal pseudo-religious belief that human generated CO2 in the atmosphere is significant driver of the climate despite an absence of proof, and their illogical belief that correlations are as meaningful as causation within the quasi-stable periods of our chaotic climate system.
Perhaps I will again be accused by ‘those who will not see’, of believing in a “big conspiracy” in order to dismiss my comments and to protect their demented thinking from being tainted by either reality or rationality.
Jun 15, 2017 HAHA!!! GLOBAL WARMING STUDY CANCELED, THE REASON WILL HAVE YOU ROLLING ON THE FLOOR LAUGHING!!!
American Lookout reports, In a perfect example of irony, a scientific research study that intended to study global warming was cancelled after encountering large amounts of ice. Breitbart reported, A global warming research study in Canada has been cancelled because of “unprecedented” thick summer ice. Naturally, the scientist in charge has blamed it on ‘climate change.’
https://youtu.be/MNn7lkO_dkM
They max out on stupid when it comes to the Antarctic, as well.
https://realclimatescience.com/2017/06/capital-weather-gang-taking-climate-stupid-to-entirely-new-levels/
https://www.iceagenow.info/sun-might-change-climate/
OT but maybe of interest —
Forest are affected by forests and forests affect the clouds —
From http://rsta.royalsocietypublishing.org/content/366/1885/4613
Thanks for fixing the blockquote error…
If only I could get that second line correct —
“Forest are affected by forests and forests affect the clouds —”
should be
Clouds are affected by forests and forests affect the clouds —
I wonder, have any of you seen the television program about the ice airport up there?
They fly in with a Russian built wing blowing jet. They ferry a lot of people to the north pole by various means of transport.
Fascinating stuff. Seems to be no shortage of ice!!
I tried html code a couple of times here , but it never seems to work for me.
Is there a page where I can get further instructions as to how this particular forum works?
Cheers.
I just now tried to send instructions for quotes, bolds, and italics, but each time the code was hidden and the function quoted, emboldened, and italicized.
So I’ll try again now. Before and after each word, there is a less-than symbol (first) and a greater-than symbol (end), substituted visually with a * here. I can’t insert the real symbol because it’ll function when posted no matter how I try to kill it.
quotes: *blockquote* text */blockquote*
bold: *strong* text */strong*
italics: *em* text */em*
Oh, …thanks?
So it is different from WordPress use were < b > is bold, del is used instead of ‘strike’ to cross out a remark.
Ho-humm lots more to try and learn.
Try again
So it is different from WordPress use were < b > is bold, del is used instead of ‘strike’ to cross out a remark.
Ho-humm lots more to try and learn.
This is WordPress, so it should support all HTML tags, that regular WordPress supports:
Links (The a tag)
SST abbreviations (abbr or accronym tag)
Strong/bold text (strong or b tag)
(blockquote tag)
Citations (cite tag)
Code with fixed width characters(code tag)This should also be fixed width text (pre tag)
Deleted stuff(del or strike tag)Italic text (em or i tag)
(q tag)
Do inserts also work? (ins tag)
See: https://wpbtips.wordpress.com/2010/05/10/html-allowed-in-comments-1/
Looks like everything except the pre and the ins tag works. The shortform quote tag (q) doesn’t seem to have a speciel formatting in this theme and appears as normal text. The source of a citation is also not displayed.
seb,
On this site not all the WordPress style tags work.
All of that sentence was given in bold as per WordPress (< b > text < /b >),
however < strong > text < /strong > like this works
Similarly for italics, etc.
The blockquote does work normally.
I’d like to know how Kenneth R gets BOLD. What works for me elsewhere doesn’t work here.
From the little I’ve found —
quotes: < blockquote > text < /blockquote >
bold: < strong > text < /strong >
italics: < em > text < /em >
Darn! Retry —
From the little I’ve found —
quotes: < blockquote > text < /blockquote >
bold: < strong > text < /strong >
italics: < em > text < /em >
~~~~~~~~~~~~~~
Notes
Bold and italics are different from WordPress usage.
I’ve now found that joannenova.com.au comment box has buttons of pre-made
text modifiers that insert the correct codes around highlighted text. Useful for making a comment, any chance of doing the same here Pierre? (Or maybe I just make-up the comment there and cut and paste it to here).
P.S. Kenneth —
< with a ; on the end gets the <
> with a ; on the end gets the >
looks good.
In the last ice age when glaciers covers asia and the US, Arctic ice was about the same as today with seasonal melting.
Something strange goes on in the Arctic-
http://www.nature.com/nature/journal/v453/n7199/full/nature07075.html
It will be interesting to see the next few data points on climate4you North Atlantic plots.
http://climate4you.com/images/ArgoTimeSeriesTemp59N.GIF
http://climate4you.com/images/OceanTemp0-800mDepthAt59Nand30-0W.gif
All under ‘Oceans’ here:-
http://climate4you.com/
Yep, The North Atlantic is cooling,
The AMO is turning downwards.
NH temps should start to drop and, unfortunately, the NH sea ice levels will probably start to increase, much to the detriment of the people living up there.
[…] Fonte: notrickszone […]
… [Trackback]
[…] Read More here: notrickszone.com/2017/06/26/since-2005-arctic-sea-ice-has-pivoted-to-a-slightly-increasing-trend-with-no-detectable-arctic-warming/ […]
[…] the reality of humankind’s impact on the climate to pounce. “ARCTIC SEA ICE BOUNCES BACK,” shouted one headline (on a blog that bills itself as being dedicated to “common sense on climate change”). Well, […]
[…] the reality of humankind’s impact on the climate to pounce. “ARCTIC SEA ICE BOUNCES BACK,” shouted one headline (on a blog that bills itself as being dedicated to “common sense on climate change”). Well, […]
[…] the reality of humankind’s impact on the climate to pounce. “ARCTIC SEA ICE BOUNCES BACK,” shouted one headline (on a blog that bills itself as being dedicated to “common sense on climate change”). Well, […]
[…] the reality of humankind’s impact on the climate to pounce. “ARCTIC SEA ICE BOUNCES BACK,” shouted one headline (on a blog that bills itself as being dedicated to “common sense on climate change”). Well, […]
[…] the reality of humankind’s impact on the climate to pounce. “ARCTIC SEA ICE BOUNCES BACK,” shouted one headline (on a blog that bills itself as being dedicated to “common sense on climate change”). Well, […]