German physicists: “CO2 plays only minor role for global climate”
In a just published study in The Open Atmospheric Science Journal here, German scientists Horst-Joachim Lüdecke and Carl-Otto Weiss have used a large number of temperature proxies worldwide to construct a global temperature mean over the last 2000 years, dubbed G7, in order to find out more about the sun’s role on climate change.
Their results drop a huge surprise on the laps of scientists who have long believed the earth is warming due to human-emitted CO2.
The analysis by the German scientists shows the strongest climate cycle components as 1000, 460, and 190-year periods. The G7 global temperature extrema coincide with the Roman, Medieval, and present optima, as well as the well-known minimum of AD 1450 during the Little Ice Age.
Correlation 0.84
Using further complex analyses, they constructed a representation of G7, which shows a remarkable Pearson correlation of 0.84 with the 31-year running average of G7.
The authors used extensive local temperature proxy data [2 – 6] together with Britain’s Hadley CRU temperature records since 1870 and the recent satellite measurements, and combined them to make up the global temperature time series G7 for the last 2000 years.
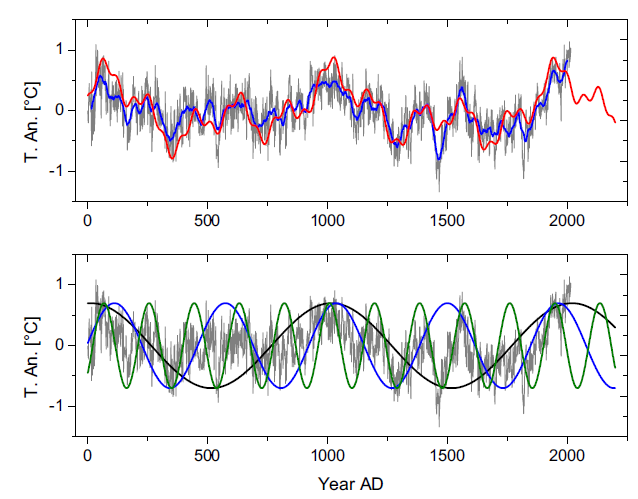
In accordance to the definition of climate, the blue curve in the paper’s Fig. 3, shown above, depicts the climate history as the 30-year running average of the grey curve. Noteworthy, the historically known temperature extrema are well reproduced by the blue climate curve: The Roman Optimum (~0 AD), the Medieval Optimum (~1000 AD), the Present Optimum, as well as the Little Ice Age (~1500 AD),
Also the pronounced minimum of 1450 AD, when the vines in southern France were killed by cold. Also clearly shown by the climate curve is the warming from 1850 to 1995.
The detailed analysis of the local records show in general a multitude of peaks, the authors say, and the G7 however shows only 3 dominant peaks, which correspond to cycles known from local studies, of approx. 1000, 500, 200-year periods. The combination of local records to a global record apparently averages out local cycles and emphasizes global cycles.
The sum of these three dominant cycles (red curve in Fig. 3) reproduces the measured climate (blue curve in Fig. 3) with a remarkable correlation of 0.84.
In particular the sum of the three cycles shows the temperature increase from 1850 to 1995 as a result of the three natural cycles, the German researchers say, adding: “Thus one can conclude that CO2 plays only a minor role (if any) for the global climate.”
Lüdecke and Weiss note that the present maximum of the cycle sum corresponds well with the world temperature stagnation since 1995 AD, the stagnation unexplained by current climate models. As the dominant cycles have persisted for an extended time, one can assume that they will persist for the near future. They write: “This allows to predict cooling until 2070 AD.”
The authors provide the following references:
[1] https://benthamopen.com/FULLTEXT/TOASCJ-11-44
[2] Christiansen and Ljungqvist, Clim Past, 8, 765-786, 2012
[3] Büntgen et al., Science, 331, 578-582, 2011
[4] McKay and Kaufman, Sci Data, 1: 140026, 2014
[5] Villalba et al., Nat Geosci, 5, 793-798, 2012
[6] Petit et al., Nature, 399, 429-436, 1999


Hockey stick meets wood chipper.
It is interesting that you skeptics dismiss the Hockey stick graphs on grounds of multiple data sources being stitched together and yet you have no problem when some of your pals do it.
Its how BADLY they were stitched together, seb, and the FACT that they were meticulous cherry-picked first, turned upside down if needed.
Whatever it took, to FAKE the disappearance of the MWP.
We skeptics have problems when the data is put through software (as in the famous temperature hockey stick graph) that would make a hockeystick shape out of random numbers or the numbers from a grocery receipt.
It’s the CO2 hockeystick graph that fuses ice core data with volcano data from half a world a way, dishonestly moving ice core data forward 83 years to fuse them. These two data sets do not overlap and fusing them was fraudulent.
When data sets from all over the world show the same patterns, it is not bad to do an average. Also, the researchers took known periodicities and used them to show that their interference patterns replicate quite nicely the running average of the averaged temperature data. Claims that there is a double standard here is the same as comparing apples and aardvarks.
It’s all BS because CO2 levels taken from ice cores are inaccurate.
http://www.biomind.de/realCO2/papers.htm
Historically, CO2 levels are actually very low.
Everything else means nothing until this issue is dealt with.
Of course, if that were to happen, the models might actually match the observed data and climate fear porn would vanish.
“hide the decline”.
Cough.
Dear me.
Dear you,
please elaborate what decline was meant by this phrase? Be exact!
Or just read this: http://rationalwiki.org/wiki/Climategate
The hockey stick graphs displayed incontrovertibly false data, using temp proxies (tree rings) that had little correlation with temperatures. They rejected (denied) solid, reliable temp data over a previous epoch.
I wonder if these two authors weigh the same as a duck. As we are all well aware, if one weighs the same as a duck, then one is made of wood and therefore one is a witch – and only witches can make such climate predictions.
https://www.youtube.com/watch?v=zrzMhU_4m-g
Rik is ignorant of the ideas of simple Fourier analysis … no fraud here, just analysing accepted time-series data and showing that all is explained in very simple terms as periodicities (almost certainly) in the sun’s natural cycles (which are not well understood, beyond the knowledge that they exist).
There are no theoretical assumptions involved here … just a straightforward analysis of data. I we apply Occam’s Razor, then there can be only one honest conclusion …
They should have included the 60-year cycle. https://notrickszone.com/2015/05/14/natural-cycles-in-a-random-world-are-unmistakable-future-holds-nothing-to-fear/#sthash.XtGNMjAg.dpbs
I’m a little surprised. Surely these cannot be the first people to do a Fourier analysis of averaged climate data? With so many people working on climate, isn’t this one of the first things anybody would do (assuming at least some of them want to do honest investigation of the known facts)?
The obvious follow-up question is – if they are real, what is the mechanism causing these 3 cycles? Identify these and it would be really convincing.
Since it has been evident for several years that many of them don’t understand statistics or dendrochronology or pataeontology or in some cases basic physics why should we assume that they even know what a Fourier analysis is?
Newminster you’ll be telling me that dendrochronology is another settled science.
Maybe you should look here and see that things are not as settled as one first suspects.
http://onlinelibrary.wiley.com/doi/10.1029/JC081i036p06377/abstract
Leona Libby’s chronology avoids the dubious ‘Settled Science’ deployed by most other dendrochronologists i.e. matching, aggregating, bridging and other spurious statistical techniques.
Newminster
For your further education of what is wrong with our dating system I would suggest you watch this https://youtu.be/c876lPZ-UZU (sorry that it’s 222MB big but it is well worth the effort)
and consider that even our dating system is not all that settled.
Have you read Little Ice Age? There is a significant elliptical orbit followed by the earth. And then there is the variation of sunspot activity. Neither are absolute constants.
They aren’t the first. A paper that tries to explain temperature variations by adding multiple periodic functions appears every few months.
This is basically using measured data, perform a FTT and reconstruct the measured data from that. Of course it matches, it would be a big surprise if it wouldn’t 😉
Yet again, you show your mathematical ignorance. !
So funny.. and you probably think you actually comprehend.
Since you apparently comprehend the topic, feel free to educate us non-comprehending underlings. Or will you use your default excuse that you tried and this would be beneath you? 😉
Many people have tried educating you, seb.
All have failed.
As expected … no substance from Mr. I-write-in-all-caps
Poor seb, it must hurt you very much, still an UNMITIGATED FAILURE at supporting even the very basis of your beloved, anti-CO2, anti-science, AGW scam religion.
You need education, rather than brain-washed “BELIEF”
Take the Fourier transform of a signal of finite duration and you’ll get an infinite spectrum. For an FFT, we have a finite number of samples, so we get a finite spectrum (a truncated and discrete subset of the continuous true spectrum). Take that discrete, truncated spectrum, apply a threshold to get the strongest components, and generate the IFFT of that, and you should get something resembling the original data. But there are some issues. Some of the frequency components you find may be artifacts of the FFT window. And your underlying assumption that the original data was taken from a series that really is periodic could be wrong, meaning you can’t extrapolate your findings without independently validating that assumption.
Noise? Both amplitudes and peiodicity of planetary change way exceed these periods and amplitudes. Just saying 🙂 Catch me on agma and gravitation as the real cause of climate change, with CO2 and albedo as positive feedback…..
Can’t see my longer response with round number quantification on how Milankovitch can work through gravitational variation and vocanic activity under the oceans. Is it here/did you see it?
This is simple: the answer lies in the sun’s natural cycles, and to understand these will require a comprehensive understaning of solar physics … this is lacking; but we have known for a very long time that solar cycles exist and are real (sun spots, known from Galileo’s time).
Having red what scientist of different opinions have written, and listened to what they have said in many videosnuts on youtube since many years, it’s been astonishing few who has shown interest in Milutin Milankovic and his cycles. He ment they are the result of forces between the sun and the planets, and between planets being what causes the complex outcome of variation.
May be its time for all good men to start digging into Milankvic?
I have! Start with the picture collation. Where are we now? What is most likely to happen next? On what cycle? That’s not a cycle. THIS is a cycle.
https://www.dropbox.com/s/tky3tvw81ou4meb/Global%20Temperature%20Collation.jpg?dl=0
I accuse the climate science community of insolation obsession. I may be wrong, but I like the simplicity of the very obvious and substantial effect of variable gravity due to Milankovitch cycles. No “forcing” required. Just a little gentle shaking, officer. Forget the atmosphere and insolation, at least while considering primary causes. This effect is probably a more powerful, Milankovitch related, but no precision needed, effect.
My suggestion is not new butIS quantified this time, and is an obvious smoking gun if you study other planets and moons as part of being a joined up and numerate physicist. Yet barely recognised by the atmospheric insolation obsessed climate so called scientists. Not understood, no data, not supported by UN climate change grants, so not studied – and dismissed whenever raised by the mainstream climate change believers as as irrelevant. The climate change priesthood are also deniers of all other beliefs, and real science, as heresy. CO2 is guilty! Hang CO2! REWARD for evidence leading to the conviction of CO2 (and DEFINITELY not anything else that might be guilty, etc)
But the effects of magma on the ocean temperatures must be significant, relentless, variable, and could vary substantially at Milankovitch extremes, through the primary mechanism of gravity, not insolation.
By comparison , the effects on the atmosphere of a Milankovitch extreme are tiny and need lots of arbitrary “forcig” in the “scientific” models. Google this – “The upshot seems to be this: in a naive model without any amplifying effects, changes in the eccentricity of the Earth’s orbit would cause temperature changes of just 0.12 °C!”
But, in spite of the fact that they are clearly looking in the wrong place, with their heads performing impossible acts in between being stuck in the clouds, climate scientists look for an atmospheric cause for climate change. I suggest it’s behind you! , or, rather, beneath, you! At least take alook, rather tha deny the obvious, as you did with plants.
My hypothesis is fundamentally driven by heat capacities and heat sources. Proven basic physics. No statistical model make-believe forcing. The oceans control climate, the atmosphere does not heat the oceans. It provides some insulation from the freezing vacuum outside, yes. But, with 0.001 of the heat capacity of the oceans, the atmosphere is a consequence and not a cause of climate change. It causes short term weather, doesn’t and cannot warm the massive heat sink that is the oceans – which control long term climate change. Obs.
Cause and effect have been reversed in the attempt to frame CO2 to enable other old style snake oil cure money making agendas, that deny energy science fact. But the fact highly subsidised renewables make net grid emissions of CO2 expensively much worse than preferring gas replacing coal and nuclear replacing both , unsubsidised, is another paper. But science fact, easy to prove.
Note that:
1. CO2 content probably correlates with temperature because it must, it is emitted by warming oceans and thus closely follows warming – but lagging, not leading, temperature chage. Not a cause but an effect.
2. Climate models don’t prove cause or effect, just correlation. So CO2 correlateing with temperature doesn’t prove which is the cause. Ocean emissions don’t cover the production of anthropogenic CO2, whose delay in release to the carbon cycle is several 100 Million years, but the plant response that got natural CO2 down from 95% volcanic to an optimum <0.2% for plant and animal life, and kept it there through multiple extreme events for 1 Billion years, doesn't know the difference – and can probably handle a relatively tiny 100ppm more in short , not long, order, IMO. Easy, as the natural response has already shown.
But, of course, that real effect was deliberately attributed a low "forcing" from modellers out to prove CO2 guilty of catastrophic hockey schtick change, not prove there are natural controls.
http://www.noaa.gov/news/study-global-plant-growth-surging-alongside-carbon-dioxide
http://www.pnas.org/content/113/36/10019.full
So climate "scientists" denial of this well known natural science as a significant effect in their models has already been proven wrong by the reality of the NOAA data showing more, and more absorbent, plants – that the models didn't allow for the much greater and natural effect of. They still claim the plants will be "overwhelmed", as they already did, incorrectly, with no provable basis for that assertion. How do these latter day priests know? Answer is "They don't". It s aguess, probaly bad given their record. Obs again.
nb: The problem arises because these are s over specialised extrapolating statisticians trying to prove a hypothesis, not test it. Not true scientists who seek truths they can test and prove with deterministic cause and effect science.
Climate scientists have prefered circumstantial evidence of statistical correlation using guessed forcings to amplify small effects they "fancy"over more likely ones, even if that denies the reality of data from the natural record and proven science of deterministic cause and effect laws – scientific laws are something their approach can never deliver, and the difference is unclear to them.
Feynman's pseudo science is writ large in climate science, but hey, follow the money, they get accredited because that's where the UN grant money and PC politics for profit are. Must have the right Mannerisms to claim the most money and fame.
Back to hard science.
If not CO2, then what, I hear you ask? Dunno, but Mr Milankovitch and our Sun are the only things energetic enough to be the smoking gun…..plus the 30TW radioactive furnace just under our feet that is continuously recyling the whole ocean floor every 200 Million Years, as the thin crust slides across the mainly soft and hot interior driven by internal, and external, forces. (nb: Where the Thorium and Uranium that make some beaches radioactive comes from, at a level greater than 10 times the evacuation level – with no epidemiological health problems – but that's another pseudo science story on radiobiology).
I look particularly at our current Milankovitch 12 degree K hockey stick interglacial, that we are now leaving for the next ice age. Doubt that? If you looked at the actual cyclic ice age data, and interglacial so far record, I suggest what comes next is clear, and the atmosphere is a puny consequence of forces more powerful than simple climate modellers could possibly imagine.
70×10^24 Joules are required to heat the oceans by 12 degrees into an interglacial in 1,000 years or so. This is synced with maximum orbital eccentricity. The atmospheric effect of 30% variation in solar energy affecting the Earth at a Milankovitch maximum is supposed to net out. So that's not it, probably.
So what about the gravitational effect, 200 times the Moons at 3.6X10^22N, varying 30% pa. At this point take a look at Io for a gravitational stress primer.
https://www.space.com/16419-io-facts-about-jupiters-volcanic-moon.html
"The volcanic activity is a result of Io being stretched and squeezed as it orbits Jupiter. Io's rock surface bulges up and down by as much as 100 meters (328 feet) during the process. This affects Io’s volcanic activity in a similar way to which Earth’s oceans react to the moon. Io’s irregularly elliptical orbit also heightens the tidal activity."
Impressed yet? You will be………
Catt's hypothesis © is the increased tectonic and volcanic activity induced by the 30% Milankovitch variation in gravitational stress on Earths very thin tectonic crust is enough to trigger a significant increase in oceanic magma release, that can deliver a large enough energy impulse to warm the oceans 12 degrees over a fairly short period, assumed to be 1,000 years for calculations, and sustain this state for a short 20,000 years interglacial, as the record shows, insulated by the Solar warmed atmospheric insulation blanket.
Once volcanic activity reduces to its long term stable state, in a more circular orbit as now, the Earth will then cool to a temperature set by a slower more stable magma infusion, plus solar radiation absorption, until the next Milankovitch extreme.
This would explain the cyclic regularity and the sawtooth waveform, and the repeatable temperature band of the last five ice ages – again, see opening data. Verify it to death if you like. Incompatible with the overtly fraudulent hockey stick approach of Mann, concatenated and adjusted from multiple incompatible data sets, as it is.
BUT…. I would expect the melting ice to provide a real hockey stick positive feedback as albedo reduces, so less energy is needed from the radiation heated molten rock than the "all magma" calculations below. That albedo significance calculation is beyond me in round number Joules pa even, , can anyone help? Needs a real scientist interested in a broad skeptical approach to all possible causes, versus proving the UN politicians scapegoat guilty – not a climate scientist witha job. We have to watch out for the elites and the unknowing and manipulated mobs. They crucified Bwian, not Bawabus.
Rough numbers? These are my numbers, comment/review – with data and method – welcome. An interglacial can all happen in a short 1,000 years with 7×10^16 tonnes of magma at a delta T of 1,000 Degrees, SH 1KJ/Kg = 7×10^25 Joules. Job done. Easy sum, do the maths, as Sir David MacKay FRS kept saying – to the renewable energy delusionals and the fraudsters in government who denied energy science fact to make evry measure of policy worse in fact, including CO2, for easy subsidy money.
Can the volcanoes step up to this level of energy input?
The current crop of volcanoes can deliver possibly 4×10^15 Tonnes in 1,000 years, on my published maths. That much, in our mostly circular low eccentricity orbit of today, is enough to keep the ice age bearable.
QUESTION: Would a MIlankovitch extreme rattle the thin oceanic crust enough (7 Km skin on a 12,000 km diam hot rock pudding remember) to add the magma impulse required for an interglacial? It only takes 20 fold increase on today. Less if decreasing albedo and other "forcings"provide positive feedback, such as CO2 from warming oceans? . A interglacial sure does look like a latch effect, someone else's point.
But no one is looking at substantive effects, because their heads are "up in atmosphere, where all the cheques will clear" , where they can get paid to prove 100ppm we added to the natural CO2 in the atmosphere did it – not test that hypothesis while also testing other more likely causes with serious energy directly applied. No forcing necessary. Magma, anyone? etc.
nb: CO2 forcing may or may not be real, the system is not closed in a bell jar, like the experiment that is used to justify an unproven greenhouse effect in a wholly different and far more complex, open and dynamic multi-variable non-linear system.
Real scientists can agree, but only that there is short term warming, perhaps noise, maybe even a magma shuffle? – not on what causes the warming or the long term trend – because there is no provable deterministic science possible that proves either.
But there is the dominant ice age cycle we are sure of. I am nearly sure that Al Gore was a total ass jumping on a dodgy bandwagon and CO2 has NOTHING to do with initiating interglacial events. Of course the release of CO2 trapped in the cold oceans may be another positive feedback response to magma warming, as well as albedo reduction. There you go!
Peta tonnes of magma heating the ocean are real. No forcing assumptions or Mannish hockey stick deceit is required with its dodgy data manipulation of tenths of degrees and millmetres of sea level.
All will look very daft when the shoreline is 100 metres lower and its 12 degrees colder, UK, Scandinavia, Russia, Canada all scraped of the face of the Earth within 20,000 years. Pr: 0.999. Great Barrier reef is 100 metre novelty cliff a short drive from Cairns, etc.
Back to reaity. The most likely massive energy source to continually heat the oceans are the Million active volcanoes underneath our thin oceanic basalt crust, including 75,000 over 1Km high. Their flow rate may be 10 times that of similar continental volcanoes, as the ocean floor is paper thin at 7Km, 1/10 the already thin continental crusts. BTW The divergent rifts are not significant in terms of magma volume to "bridge that gap" at 2cm pa along 40,000 km, unless there is a LOT of scabbing.
This a abstract of a published artcle. © Brian RL Catt 2017, free to replicate here and elsewhere if not for profit. Replies welcome, preferably facts, as a scientist I don't care what you believe.
Unfortunately this good news is actually bad news because while the climate alarmists claim that higher temperatures are bad, most of human history and the current greening of the planet show that warmer temperatures leavened with a bit more CO2 is a good thing.
Lower temperatures will mean lower crop yields and shrinking habitat etc etc. Kind of like a repeat of the last time this happened 300-200 years ago.
True, that is why the global warming alarmists should start using their brains and come to their senses.
{Planet will do what is was going to anyway. Forces far geater than anything we can manage, CO2 so obviously NOT a problem, plants deal with it, not overwhelemed, or bothered. Maged to get it down from 95% and hod it as <0.2% for 1 Billion yrs at least, etc.
Trouble is, it then went down to 180ppm at times.
That is a threat to all life on Earth.
Then mankind came along, and started releasing accidentally sequestered carbon back where it belongs, in the carbon cycle,
Mankind’s use of fossil fuels has probably saved the Earth from a continued slow death through CO2 deficiency.
[…] Read more at No Tricks Zone […]
I predict raw data to cool and homogenized data to get warmer.
That’s not a prediction, it is an expectation with the crowd manipulating the data now.
[…] Fonte: No Trick Zone […]
I am quite surprised. I did read the article (and even contacted the author).
The article is about the last 2000 years and is about solar influence. But the whole article (just read through it by yourself) isn’t even mentioning CO2!
So for sure the sun has got influence on the climate (I doubt if some-one is denying this), but it is not supporting the quote: “German physicists: “CO2 plays only minor role for global climate””.
And secondly in the last 50 years is the solar flux reduced and earths temperature raising. As you can see in the first figure the raising temperatures after 2000.
But my main point is that the article is not about the relation between CO2 and climate change.
“And secondly in the last 50 years is the solar flux reduced and earths temperature raising”
Last 40 years (as far back as we have untampered temperature data) the only warming has been from El Nino and ocean events.
These are solar.
If solar is the MAJOR cause of warming, which it certainly appears to be, (although the mechanisms and lags etc are yet to be fully defined) then the statement
OOPs…… stuffed up my blockquotes again ! Try again
….is perfectly justified.
The fact that, after all this time, there is not one single paper empirically proving that CO2 warming of the atmosphere even exists, would also come to the same conclusion.
CO2 is probably not even on the playing field.
“… only warming has been from el Niño and ocean events…” Um, those are all cyclic, and consequently cannot produce a linear trend. If you subtract out the linear trend (0.14 Kelvin per decade) then those cycles explain the residual signal.
Earth’s atmosphere is not a closed system, it’s open to the ocean and to the outer space. Therefore, the effect of CO2 does not have to accumulate in the atmosphere like in a green house, any heating can be captured by the ocean and/or disappear into space through long-wave heat radiation. In addition, CO2 does not accumulate in the atmosphere to cause huge heat, it finds its way into the water masses.
Personally, I think the climate is controlled by the sun’s spots and activity levels, of Milankovic’s cykles, cosmic radiation that comes in when sun activity is low, that affects clouds, shadow and thus lower temperatures. It’s all a very complex system, hard to understand for many of us …
We have seen in recent years that science has been replaced by politics at the science arena normally held by climate cientists, not politicians. This is not good and we are currently experiencing the official correction of opinions and attitudes based on politics alone, in many enlightened societies. Strange, very strange …
Pol Knops wrote:
The authors ascribed temperature changes of the last 2000 years, including the increase during the 20th century, to solar activity, saying the temperature changes are of a “pure multiperiodic nature”. In so doing, they predicted a “temperature drop” from now until 2050. Of course, it is common knowledge that those who believe that CO2 is predominantly responsible for climate changes are not predicting a temperature drop in the next several decades. They are predicting the opposite: a rapid temperature increase…precisely because of the CO2 increase. There is an assumption that changes in surface solar radiation absorption has little to nothing to do with temperature changes. These scientists disagree; hence their expectation that temperatures will drop.
With regard to your contention that solar forcing has not had a role in climate for the “last 50 years”, there is a great deal of evidence to suggest that the Earth has undergone a Grand Maximum of solar activity since the 1950s. Reconstructions of solar activity and temperature changes actually match up rather well, even for recent decades, especially when using temperature datasets that have not been dramatically adjusted by the temperature data manipulators. Here are some examples.
https://notrickszone.com/wp-content/uploads/2017/04/Solar-Activity-8000-Years-Modern-Grand-Maximum-Usoskin-2017.jpg
–
https://notrickszone.com/wp-content/uploads/2017/06/Solar-Activity-1600-2010-TSI-Blaauw-2017.jpg
–
https://notrickszone.com/wp-content/uploads/2017/04/Soon-Connolly-2015-NH-Temps-and-TSI.jpg
–
https://notrickszone.com/wp-content/uploads/2017/04/Modern-Grand-Maximum-Chen-2015.jpg
–
https://notrickszone.com/wp-content/uploads/2017/04/Modern-Grand-Maximum-UVR-Chen-2015.jpg
–
https://notrickszone.com/wp-content/uploads/2017/04/Cooling-Forecast-Solar-Steinhilber-and-Beer-2013.jpg
–
https://notrickszone.com/wp-content/uploads/2017/04/Modern-Grand-Maximum-To-2100-Herrera-2015.jpg
–
https://notrickszone.com/wp-content/uploads/2017/04/Modern-Grand-Maximum-Russell-2010.jpg
–
https://notrickszone.com/wp-content/uploads/2017/05/Total-Solar-Irradiance-1700-2013-Yndestad-and-Solheim-2017.jpg
—
Yndestad and Solheim, 2017
https://www.researchgate.net/profile/Harald_Yndestad/publication/307894966_The_Influence_of_Solar_System_Oscillation_on_the_Variability_of_the_Total_Solar_Irradiance/links/57d2bd7508ae6399a38d9449.pdf
“Deterministic models based on the stationary periods confirm the results through a close relation to known long solar minima since 1000 A.D. and suggest a modern maximum period from 1940 to 2015. The model computes a new Dalton-type sunspot minimum from approximately 2025 to 2050 and a new Dalton-type period TSI minimum from approximately 2040 to 2065. … Periods with few sunspots are associated with low solar activity and cold climate periods. Periods with many sunspots are associated with high solar activity and warm climate periods.”
—
http://www.nature.com/articles/srep15689
“The longest direct ervation of solar activity is the 400-year sunspot-number series, which depicts a dramatic contrast between the almost spotless Maunder and Dalton minima, and the period of very high activity in the most recent 5 cycles [1950s – 2000s], prior to cycle 24. … The records show that solar activity in the current cycle 24 is much lower than in the previous three cycles 21–23 revealing more than a two-year minimum period between cycles 23 and 24. This reduced activity in cycle 24 was very surprising because the previous five cycles were extremely active and sunspot productive forming the Modern Maximum.”
—
http://link.springer.com/article/10.1007/s11434-010-4177-1#page-1
“It is seen that a very active period that began in 1920, the so-called ‘current grand solar maximum’, will probably end during 2011-2027, since a variety of indices related to solar activity have significantly shifted since 1987. … The current grand solar maximum started in 1920 and lasted for eight 11-year solar cycles.”
—
http://www.aanda.org/articles/aa/pdf/2014/02/aa23391-14.pdf
“[T]he modern Grand maximum (which occurred during solar cycles 19–23, i.e., 1950–2009) was a rare or even unique event, in both magnitude and duration, in the past three millennia. Except for these extreme cases, our reconstruction otherwise reveals that solar activity is well confined within a relatively narrow range.”
So we’ll see who is right in the next 20 to 40 years? Maybe both are and the lower Sun activity gets compensated by anthropogenic warming? I hope you’ll be around then, so we can tell each other “told you so” 😉
The way your side works, if/when the temperatures drop, it’ll be said that well, it would have dropped more had it not been for anthropogenic CO2 emissions. It’s an unfalsifiable hypothesis. Even when wrong, your side (which I used to count myself as being on until I actually started investigating the evidence) still insists they were right all along…and that anyone who disagrees is a “climate denier” (whatever that is).
That’s the nature of a constant forcing that gets added to the rest. It doesn’t disappear when other variables change and cause temperature changes.
And how would the hypothesis be wrong if the temperature decreases from a change in one of those variables? That makes no sense at all.
Yes, of course you agree. If/when the temperatures drop, you’ll say they would have dropped more had it not been for anthropogenic CO2 emissions. As I’ve said, it’s the unfalsifiable hypothesis.
Not only that, but the data will (continue to) be manipulated to show warming when none exists. In the 1970s, the Northern Hemisphere had cooled by -0.5 or -0.6 degrees since the 1940s. Today shows there’s essentially no cooling at all. When the data don’t fit the unfalsifiable hypothesis, the data must be changed to make it fit.
That’s the way your side works.
Sebastian, you are the same dude who keeps ignoring the evidence that the IPCC’s per decade warming prediction/projection, based on the AGW conjecture is a colossal failure.
IPCC per decade since 1990 report, .3C warming per decade.
Reality using the damaged RSS data set shows less than HALF that rate.
http://www.woodfortrees.org/graph/rss/from:1990/mean:12/plot/rss/from:1990/trend
about .30 C TOTAL in 26 years.
AGW conjecture fails badly.
As long as skeptics have to resort to calling adjusted data fake, they can’t be taken seriously. Sorry.
For most people concerned about accuracy and honesty, it would be a problem and a significant concern that half the interested population assume that temperature data has been improperly and perhaps fraudulently adjusted…as the adjustments are massive and always go in one tendentious direction (cool the past and warm the present), the direction that makes the data fit the models. Of course, it should be no surprise at all that you have no problem that so many of us are dubious that 0.5 C of warming was removed from the early 20th century warming after 1987, or -0.3 C of cooling was removed from the global temperatures during 1940-1970, or that +0.3 C has been artificially added to post-2000 temperatures. To you, we are the problem because we don’t just blindly accept manipulated data.
Trust is critical in science. We don’t trust people like Gavin Schmidt or Michael Mann or Phil Jones or John Cook or Al Gore. That’s a problem. Not for you, of course. But for people who actually care about honesty and integrity, the lack of trust is problematic.
“That’s the nature of a constant forcing”
A constant forcing of ZERO makes no difference. !!
As you have consistently shown, there is ZERO proof of any CO2 warming in a convective atmosphere or of oceans.
Kenneth, what dodge will you employ when temperatures rise contrary to your expectations?
I do agree with you that “Today shows there’s essentially no cooling at all.”
If they rise, there will be quite natural explanations that don’t involve CO2…just as there have been for recent decades.
What’s your explanation for the lack of any temperature rise for the 80 years between 1850 and 1930 (according to the heavily adjusted data) despite dramatic increases in anthropogenic CO2 emissions during this period?
http://www.woodfortrees.org/plot/hadcrut4gl/from:1850/to:1930/plot/hadcrut4gl/from:1850/to:1930/trend
What do you think caused global temperatures to plummet by about 2 degrees C between the Medieval Warm Period (900-1250 C.E.) and Little Ice Age (1450-1900 C.E.)…since CO2 levels rose during this period? What was the cooling mechanism?
As long as AGW cultists think that massively adjusted data is in any way relevant to ANYTHING,
… they will be treated as the brain-washed child-minds they are.
Nothing to dodge..
Why do you ALWAYS dodge the facts, seb ??
Its as though you are SCARED of them because they injure your unsupportable brain-washed AGW cult belief.
1. There has been NO CO2 induced warming in the whole of the satellite temperature record. All warming has been from El Nino and ocean effect, which you have PROVEN are nothing to do with CO2.
2. You are totally unable to present one single paper that provides measurable evidence of CO2 warming of oceans or of our convective atmosphere.
CO2 is very obviously pretty close to INCONSEQUENCTAIL when it comes to warming.
If you had even the remotest honesty or any understanding of real science or physics, you would accept that fact.
But you have neither.
@sunsettommy: the evidence? Just fetch the CMIP5 model data and compare it to any actual temperature record. You’ll find the deviation is minimal (the models slightly overestimated warming on average, which has since been corrected, but apparently it is important for skeptics to point out that old predictions were somewhat off … not Christy-off though, that graph is just wrong and he probably knows it)
@Kenneth:
The adjustments aren’t just in one direction:
http://www.snopes.com/climatology-fraud-global-warming/
And the adjustments are pretty well explained in their FAQ:
https://www.ncdc.noaa.gov/monitoring-references/faq/temperature-monitoring.php
The recent RSS adjustments for version 4 have been explained extensively too … do you have a problem with the kind of adjustments? Do you think correcting for drift somehow makes the data fake? Or including new satellites and removing satellite data from defective instruments (calibration drift, etc) makes the data fake? Do you honestly think “we” are making this all up so we can show you that the planet warms?
Oh, has there been a survey I didn’t know of? I’d say 97% of the interested population thinks that calling everything fake as the last resort to defend your opinion that humans are mostly not influencing the climate is a problem.
Get over your trust issues and learn more about the kind of adjustments. There is no need to trust people here, it’s all open to be examined.
The unfalsifiable hypothesis? 😉 Whatever happens, it is all natural … no proof needed. See, I can play that game too.
The amount of forcing due to that little increase in CO2 concentration is pretty small.
You favorite one … everything natural, obviously. Since humans had no significant influence on CO2 concentrations back then.
And haven’t I tried to explain to you why CO2 levels can rise despite cooling? It is similar to driving forward at a certain speed and still driving forward when you decrease the speed. haven’t learned how that mechanism works yet? Want to call it fake because someone you don’t trust tries to explain it to you?
“Just fetch the CMIP5 model data ”
ROFLMAO
They only natch the FANTASY data of GISS et all, which has been PROVEN to be MASSIVELY manipulated
You are a LIAR, seb.
And you STILL have absolutely ZERO PROODF that CO2 causes warming of ANYTHING
Everybody can see you ducking and weaving, slipping and sliming trying avoid this FACT.
Your childish attention-seeking posts are doing a great dis-service to your anti-scicence cult, seb, and you are too darn thick to realise it.
Please keep posting so that others may see just how brain-washed the below average AGW troll really is.
[…] into solar minimum conditions and global cooling may be imminent (see, for example, here and here and here). What follows is a collection of dozens of other papers that have also projected a […]
[…] See also here and here […]
Incredibly Sebastian writes this howler,
“@sunsettommy: the evidence? Just fetch the CMIP5 model data and compare it to any actual temperature record. You’ll find the deviation is minimal (the models slightly overestimated warming on average, which has since been corrected, but apparently it is important for skeptics to point out that old predictions were somewhat off … not Christy-off though, that graph is just wrong and he probably knows it)”
He did it again!
He IGNORED the IPCC per decade prediction/projection since 1990. I posted actual quotes and provided the links to them. He also ignored the damaged RSS satellite data too.
This is what he had replied to what I wrote yesterday:
“Sebastian, you are the same dude who keeps ignoring the evidence that the IPCC’s per decade warming prediction/projection, based on the AGW conjecture is a colossal failure.
IPCC per decade since 1990 report, .3C warming per decade.
Reality using the damaged RSS data set shows less than HALF that rate.
http://www.woodfortrees.org/graph/rss/from:1990/mean:12/plot/rss/from:1990/trend
about .30 C TOTAL in 26 years.
AGW conjecture fails badly.”
Notice that he never addressed what I posted at all.
I pointed out that the IPCC made a series of per decade temperature guesses from 1990 onwards, then showed what the official temperature data showed really happened, from 1990 onwards.
Sebastian ignored all that by pushing a modeling construct program,which is NOT real data at all.After all they went far into the future,so logically it is IMPOSSIBLE to have real data,since for at least 83 years of it has never existed yet.
You can’t be that stupid,Sebastian?
It is clear that you are an ill person,because you again DELIBERATELY ignore contrary information that I provided. You do it over and over,as you have NEVER addressed what the IPCC stated about Per Decade warming projections,despite my bringing it up several times.
Here it is again straight from the 1990 report,you keep ignoring:
“Based on current model results, we predict:
under the IPCC Business-as-Usual (Scenario A)emissions of greenhouse gases, a rate of increase of global mean temperature during the next century of about 0 3°C per decade (with an uncertainty range of 0 2°C to 0 5°C per decade), this is greater than that seen over the past 10,000 years This will result in a likely increase in global mean temperature of about
1°C above the present value by 2025….”
http://www.ipcc.ch/ipccreports/far/wg_I/ipcc_far_wg_I_spm.pdf
You are again confirming that you are a warmist troll with no logical arguments to offer in reply.
What is the matter with you? Why do you have to throw such a tantrum about nothing?
And why do you call RSS data damaged? What is the goal of your reply here?
You do know that those reports are published regularly and that predictions can change? I am sure the owner of this blog would like to revise his 2008 prediction about the temperature anomaly being -2.x degrees by 2020 too.
CMIP5 is a modeled prediction, a more current one. What is your problem with this one? All fake and adjusted too or something like that? It gets repetitive …
Depending on where from around the year 1990 you start, we were pretty close at the top of the last El Nino, weren’t we?
Once again you ignored what the 1990 IPCC report stated,and ignore the RSS satellite data showing how wrong the IPCC was.
1990 is BEGINNING of the time frame the IPCC since that is their FIRST report.
No the RSS shows only a .30C increase since 1990,when the IPCC made that wildly wrong 1C prediction by year 2025. It is not going to happen in the next 8 years since virtually all warming since 1990 have been from ENSO events,CO2 has nearly nothing to do with it.
Once again this link you ignored before,showing that it is ENSO events that made it warm since the 1970’s:
“Surge in global temperatures since 1977 can be attributed to a 1976 climate shift in the Pacific Ocean”
Three Australasian researchers have shown that natural forces are the dominant influence on climate, in a study just published in the highly-regarded Journal of Geophysical Research. According to this study little or none of the late 20th century global warming and cooling can be attributed to human activity.
The research, by Chris de Freitas, a climate scientist at the University of Auckland in New Zealand, John McLean (Melbourne) and Bob Carter (James Cook University), finds that the El Niño-Southern Oscillation (ENSO) is a key indicator of global atmospheric temperatures seven months later. As an additional influence, intermittent volcanic activity injects cooling aerosols into the atmosphere and produces significant cooling.
“The surge in global temperatures since 1977 can be attributed to a 1976 climate shift in the Pacific Ocean that made warming El Niño conditions more likely than they were over the previous 30 years and cooling La Niña conditions less likely” says corresponding author de Freitas.
“We have shown that internal global climate-system variability accounts for at least 80% of the observed global climate variation over the past half-century. It may even be more if the period of influence of major volcanoes can be more clearly identified and the corresponding data excluded from the analysis.”
https://wattsupwiththat.com/2009/07/23/surge-in-global-temperatures-since-1977-can-be-attributed-to-a-1976-climate-shift-in-the-pacific-ocean/
Once again you have no counterpoint to offer.
This paper confirms the controlling influence of the millennial cycle as reported in my paper published earlier this year.
Climate is controlled by natural cycles. Earth is just past the 2003+/- peak of a millennial cycle and the current cooling trend will likely continue until the next Little Ice Age minimum at about 2650.See the Energy and Environment paper at http://journals.sagepub.com/doi/full/10.1177/0958305X16686488
and an earlier accessible blog version at http://climatesense-norpag.blogspot.com/2017/02/the-coming-cooling-usefully-accurate_17.html
Here is the abstract for convenience :
“ABSTRACT
This paper argues that the methods used by the establishment climate science community are not fit for purpose and that a new forecasting paradigm should be adopted. Earth’s climate is the result of resonances and beats between various quasi-cyclic processes of varying wavelengths. It is not possible to forecast the future unless we have a good understanding of where the earth is in time in relation to the current phases of those different interacting natural quasi periodicities. Evidence is presented specifying the timing and amplitude of the natural 60+/- year and, more importantly, 1,000 year periodicities (observed emergent behaviors) that are so obvious in the temperature record. Data related to the solar climate driver is discussed and the solar cycle 22 low in the neutron count (high solar activity) in 1991 is identified as a solar activity millennial peak and correlated with the millennial peak -inversion point – in the UAH6 temperature trend in about 2003. The cyclic trends are projected forward and predict a probable general temperature decline in the coming decades and centuries. Estimates of the timing and amplitude of the coming cooling are made. If the real climate outcomes follow a trend which approaches the near term forecasts of this working hypothesis, the divergence between the IPCC forecasts and those projected by this paper will be so large by 2021 as to make the current, supposedly actionable, level of confidence in the IPCC forecasts untenable.”
Wow Sebastian doesn’t realize that he hurt his own position when he tries to support RSS satellite data,he seems oblivious that I used the updated RSS set up,which should have helped the IPCC projections as it is now warmer than it was before the adjustments:
Seb writes,
“The recent RSS adjustments for version 4 have been explained extensively too … do you have a problem with the kind of adjustments? Do you think correcting for drift somehow makes the data fake? Or including new satellites and removing satellite data from defective instruments (calibration drift, etc) makes the data fake? Do you honestly think “we” are making this all up so we can show you that the planet warms?”
It is still less than half the rate the IPCC said was supposed to happen since 1990. This after using the new RSS temperature adjustments to their data.
How can you be this stupid Sebastian, to miss the obvious point that projections based on the AGW conjecture is still a colossal failure.
The world doesn’t revolve around you. Rest, see above … if you were around in 1990 (i doubt it because of your childish behavior), I bet you had different predictions on you own … those aren’t too far.
I don’t know why you expect that in 27 years no one improved upon those predictions and why you perform some kind of verbal victory dance here. And what is the matter with you calling people stupid?
*those (the IPCC ones from 1990) aren’t too far off
Another counterpoint free comment from Sebastian,the warmist troll.
When will you directly address the IPCC and RSS information I have posted several times?
You have yet to make a counter to it. You keep bringing up side issues that doesn’t address what I wrote at all.
Here it is once again:
“Sebastian, you are the same dude who keeps ignoring the evidence that the IPCC’s per decade warming prediction/projection, based on the AGW conjecture is a colossal failure.
IPCC per decade since 1990 report, .3C warming per decade.
Reality using the damaged RSS data set shows less than HALF that rate.
http://www.woodfortrees.org/graph/rss/from:1990/mean:12/plot/rss/from:1990/trend
about .30 C TOTAL in 26 years.
AGW conjecture fails badly.”
https://notrickszone.com/2017/08/01/new-study-by-germany-physicists-concludes-we-can-expect-climate-cooling-for-next-50-years/comment-page-1/#comment-1224893
Why is it so hard for you to DIRECTLY respond to my comment?
It’s cute that you demand me addressing something I wrote “or else”. I should have ignored you … instead of now having to deal with your “no counterpoint” nonsense.
Let’s just say: yes, I ignore what the 1990 report says … who cares?! Do you still do what you did in the 90s? The world has moved on, things improved, scientists learned stuff.
Seriously, what is your problem? I am sure you can find older predictions that were based on even fewer data and knowledge and use them to make you feel better. Can we please stay in the present and deal with current predictions (homework for you: find out the starting date of the CMIP5 model predictions)?
Love the way the CHIMP ignores every previous failures, The scammers then reset their graphs to a new starting point where real temps are with the error margin, and pretend that they have been correct.
So hilariously ANTI-SCIENCE.
Ain’t fooling ANYONE except the brain-numbed AGW cult followers .. like seb.
Bwahahahahahahahahaha!!!
Once again Sebastian,grace this board with another ZERO counterpoint response to my IPCC per decade prediction / RSS temperature data observation,that has been brought us several times now.
It is to show empirical evidence that a key AGW based prediction published in the 1990 IPCC report,fails badly.
It is clear he knows that what I wrote is correct,since he NEVER counters it.
Sebastian tried a bad attempt to wipe mud off his face with this hilarious tripe he wrote:
“Let’s just say: yes, I ignore what the 1990 report says … who cares?! Do you still do what you did in the 90s? The world has moved on, things improved, scientists learned stuff.”
Unfortunately for you the 2007 IPCC report STILL thinks it will be about a .30C per decade warming,while RSS from 2001 onwards show far less,the same high level failure as the one from 1990’s onwards, you have not once factually disputed.
IPCC 2007 says,
“For the next two decades, a warming of about 0.2°C per decade is projected for a range of SRES emission scenarios. Even if the concentrations of all greenhouse gases and aerosols had been kept constant at year 2000 levels, a further warming of about 0.1°C per decade would be expected.”
RSS shows from 2001,
http://www.woodfortrees.org/plot/rss/from:2001/mean:12/plot/rss/from:2001/trend
About .15 C increase after 16.6 years. Not even close!
Why don’t you stop right here since it is clear you have no answer to the obvious colossal failures of AGW based projections of temperature trends.
It’s not just 1990…or 2007. According to Fyfe et al., 2013, the average of the climate models still has us getting 0.3°C per decade of warming.
http://www.stat.washington.edu/peter/statclim/fyfeetal.pdf
“[W]e find an average simulated rise in global mean surface temperature of 0.30 ± 0.02 °C per decade (using 95% confidence intervals on the model average). The observed rate of warming given above is less than half of this simulated rate, and only a few simulations [2 out of 117] provide warming trends within the range of observational uncertainty”
So let’s replace 2013 data with SebastianH’s “rebuttal” to see how it reads upon altering his but-that-was-a-long-time-ago defense…
Even in 2017 scientists are noticing just how awful these climate models are at simulating climate…
Hedemann et al., 2017
https://dl.dropboxusercontent.com/u/75831381/Hedemann%202017.pdf
The observed trend deviated by as much as −0.17 ◦C per decade from the CMIP5 (Coupled Model Intercomparison Project Phase 5) ensemble-mean projection—a gap two to four times the observed trend. The hiatus therefore continues to challenge climate science.”
When people like SebastianH are caught getting it wrong, they just move the goal posts to claim they are right after all.
Sebastian. make clear he loves pseudoscience, since he is rutting over the contrived, empirical data free CMIP5 climate MODELS,of which there are over 100 of them,all worthless since they are not TESTABLE as the guesses runs to year 2100.
“Seriously, what is your problem? I am sure you can find older predictions that were based on even fewer data and knowledge and use them to make you feel better. Can we please stay in the present and deal with current predictions (homework for you: find out the starting date of the CMIP5 model predictions)?”
The Scientific Method tells us that for a hypothesis to work, it MUST be based on real data. to make it testable.
The Scientific Method once again,
“The scientific method is a body of techniques for investigating phenomena, acquiring new knowledge, or correcting and integrating previous knowledge. To be termed scientific, a method of inquiry is commonly based on empirical or measurable evidence subject to specific principles of reasoning.”
https://en.wikipedia.org/wiki/Scientific_method
It is obvious you have NOTHING intelligent to say here,as there is only 83 remaining years of NO “measurable evidence” to use.
You are stupid as hell!
Sunsettommy, this is getting annoying.
You don’t seem to grasp that the CMIP5 models are the basis for the predictions, do you? It is irrelevant that those models are calculated to the far future, they can also be calculated from the past … comparing it to observed temperatures you get something like this: http://imgur.com/a/sXjtE or this http://imgur.com/a/VMA13 (about 1 degree increase from 1990 to the year 2025)
I don’t know why you want me to counter your “point” so much and act like a little child over this not understanding what’s a prediction and what’s not …
Last comment from me about this. I don’t care if you call me “stupid as hell” because I think you can compare the model data to observed data quite easily. Why do you think that the model data would be untestable? Do you really think (your homework) that those models only start from the year 2017 and nobody ever has used a starting point from the past?
And you don’t seem to realise that the Chimp models are worse than a crystal ball.
At least a crystal ball has a chance of being correct.
The Chimp models are built from ground up to FAIL.
Juts like you always FAIL to support the very basis of the AGW religion
Absolutely ZERO proof that CO2 causes warming of oceans and or atmosphere, yet CO2 warming is built into the models
MASSIVE FAILURE ALL ROUND. !!
And yes, we know don’t care about being “as stupid as hell”
It is your natural way of life.
That’s who you are, and there is nothing you can do about it.
The models are bad and built to fail? I see … that’s why the observed warming matches them pretty closely?
Please enlighten us more about your nonsense, smartest person on this planet!
“It’s cute that you demand me addressing something I wrote “or else”.” – chatbot_SebH
You are the only one using the challenging “or else” term on this page, chatbot.
Another of SebH’s strawmen.
When the actual words spoken by others don’t help SebastianH’s position, he just makes up words and then claims they wrote it. It’s compatible with how people like Mann, Marcott, Gore, Karl, Mears, Jones, Schmidt…operate. When the data don’t fit the models, change the data.
It’s been know for a long time, and even published in peer reviewed literature, that models not only don’t work, they cannot work.
https://wattsupwiththat.com/2010/12/05/new-peer-reviewed-paper-shows-just-how-bad-the-climate-models-are/
The only way they get the models to match reality is by tweaking the tens of adjustable parameters after the fact. But the appearance of agreement is an illusion, because they still cannot forecast anything. Even if they got something “correct” it would be an accident.
“that’s why the observed warming matches them pretty closely?”
BULLS**T !!
http://www.drroyspencer.com/wp-content/uploads/CMIP5-global-LT-vs-UAH-and-RSS.png?w=240
And please, I’ve had enough laughter from becaue of you, don’t pretend the surface data is REALITY.
You know its one big monumental FARCE, manipulated purposely to attempt to justify the models.
So much so that the “adjustments” almost exactly match the change in CO2 levels.
Nearly ALL the claytons-warming in the surface data comes from “adjustments”, “infilling” , “homogenisation” and just basic data mal-manipulation/fraud.
The figure shows the 3 periodic elements as being equal in magnitude. This is unlikely to be true. And likely a better fit could be made by applying a scaling factor to each of the 3 frequencies.
Sebastian writes,
“CMIP5 is a modeled prediction, a more current one. What is your problem with this one? All fake and adjusted too or something like that? It gets repetitive …”
83 years of it is unverified,that is why it is not credible. Have you missed the Definition of the Scientific Method?
From the start the Model construct is not testable,it was already dead on arrival. Since you can’t test it as REQUIRED by the Scientific Method,it has no science research value.
“Scientific Method
The scientific method is a body of techniques for investigating phenomena, acquiring new knowledge, or correcting and integrating previous knowledge. To be termed scientific, a method of inquiry is commonly based on empirical or measurable evidence subject to specific principles of reasoning.”
https://en.wikipedia.org/wiki/Scientific_method
CMIP5 is another worthless modeling construct since it has ZERO Empirical data in it. There is nothing real to test!
How can you be that stupid?
The AGW conjecture was what the IPCC based their emission and temperature scenarios upon. From it they made several short term temperature prediction/projection that have been waaay off. Normally this would quickly invalidate the AGW conjecture, but ignorant warmist loons like you keep sweeping such failures under the sofa,continue to promote their CO2 cult and make a fool of themselves in the process.
Love the way the CHIMP ignores every previous failures, The scammers then reset their graphs to a new starting point where real temps are with the error margin, and pretend that they have been correct.
So hilariously ANTI-SCIENCE.
Ain’t fooling ANYONE except the brain-numbed AGW cult followers .. like seb.
Seb, has no idea of what credible science research consist of, since he drools over non existent data claims of CMIP5 modeling scenarios (which is what they are)so much,as if he is in rutting heat. It is currently year 2017, yet he thinks running wild guesses to year 2100 (83 years into the future) is scientifically valid.
That is a definition of stupidity in open display.
He added the CHMIP5 deflection in his desperate attempt to get me to stop the valid per decade projected warming rate failure argument and sniff over his bogus modeling crap instead. He never has addressed it because he KNOWS he can’t dispute it, as It came off the IPCC report and the RSS data themselves.
Sebastian,doesn’t know what Reproducible science research consist of.
You do know that those models didn’t just come into existence in the year 2017, do you? They have been run in the past and were used to predict the climate change (those per decade increases you mention). You can easily compare those graphs with observed measurements.
You seem to be confused here … and somehow seem to perceive this is a win or something. Very annoying, but I’ll let you do your “victory dance” now and will continue to ignore your tantrums in the future (so please don’t think I am avoiding you because you have valid argument, in most cases I will just not have read your comment)
You do know that the models are less likely to make a reliable prediction than a crystal ball, don’t you, seb?
They have this anti-science CO2 malarkey in them..
You know, the one you are TOTALLY INCAPABLE of finding a single bit of evidence for.
Yep, and they FAIL MISERABLY, just like you.
AndyG55, you might disagree about the things those models are based on. Nevertheless, those are what the IPCC used to predict the warming per decade. Mr. sunsettommy doesn’t seem to agree and thinks those models only exist from 2017 forward and can’t be used to compare to current measurements of the temperature. Which is just wrong …
Where does sunsettommy think the red line is coming from in this misleading graph http://media.al.com/news_huntsville_impact/photo/john-christy-chart-2b0592b7af6a6f08.jpg from Christy?
I highly doubt that sunsettommy actually thinks that.
Sebastian writes,
“You do know that those models didn’t just come into existence in the year 2017, do you? They have been run in the past and were used to predict the climate change (those per decade increases you mention). You can easily compare those graphs with observed measurements.”
He thinks I was saying CHMIP5 starts in 2017, but the moron doesn’t seem to realize it started only FOUR years ago in 2013 in the IPCC report. I have the link to the entire CMIP5 program.Just 4 years is not much for you to be this stupid over.
I wrote this way BECAUSE it is currently YEAR 2017,that way I can say 83 years of non existent data is in the future. The reason why I bring up the Scientific Method,that you still ignore in your irrational dash for pseudoscience, based on long into the future modeling scenarios that are untestable.
I wrote,
“It is currently year 2017, yet he thinks running wild guesses to year 2100 (83 years into the future) is scientifically valid.”
Meanwhile you still ignore the per decade warming projections FAILURE that are based on the IPCC reports. You do this deflection over a starting date of the CMIP5 modeling guesses,to avoid addressing the obvious CMIP3 failures in the 2007 report.
You have NOTHING as usual.
Seb, you really do appear not to understand how these models “work” … they contain many initially unknown parameters whose values are subsequently fixed to ensure that, when run from some point in the past to the present, they give results which correspond to what is currently observed.
Sadly, when these models are THEN used to predict the future, they have a bad habit of being proven wrong when the future date actually arrives.
Any trained scientist worth his/her salt would then ask: “what is wrong here?” Since the models are constructed with the inbuilt ASSUMPTION that CO2 is the culprit for warming, then that would be the first port of call … is this assumption just plain wrong??
PS: I spent the first 1/2 of my scientific career writing & running complex fluid dynamics models …
[…] References are HERE. […]
[…] Source: New Study By German Physicists Concludes We Can Expect Climate Cooling For Next 50 Years! […]
[…] Source: New Study By German Physicists Concludes We Can Expect Climate Cooling For Next 50 Years! […]
All of this nonsense would be flushed and forgotten if researchers knew that determining levels of trace gases in the atmosphere from ice cores is extremely inaccurate.
Once you review the 90,000 extremely accurate and consistent CO2 measurements taken directly from the atmosphere over the last 180 years you will realize that we are actually living in a period of unusually low CO2 levels.
When you know that our atmosphere was 70% CO2 for nearly 2 billion years you have to realize that an “unrecoverable tipping point” of 350 ppm is just fear porn.
Until this ice core issue is dealt with, a yawn is the most emotional response I can muster.
The concept that 2000 years is a long time in climate change time is totally erroneous. As Catt (above) has stated, the glacial – interglacial cycle is actually around 100,000 years, so looking at a 2000 year ‘record’ of climate is like admiring a panoramic view by looking through a microscope – the part you see is in great detail but is also totally without context.
During the past approximately 2.8 million years there have been at least 25 cycles of glacial to interglacial changes occurring in this present ice age. At present we have gone through the temperature rise until we are at the cusp of the next relatively precipitous drop into a glacial period, when sea level will drop 100m and temperatures drop maybe 10 degrees C. How surviving humanity will long for global warming at that time, and for the 80,000 subsequent cold years during which time the face of planet Earth will be changed beyond recognition, humanity will become tribalized in relatively isolated pockets where habitation is possible and, as Catt says, we will be able to drive to the Great Barrier Reef for rock climbing practice.
Theory states that the drop into a glacial period takes place very quickly, with sea levels dropping by around 1 meter per century, enough to bring shipping to a halt. The climb out of this deep freeze takes much longer. I wonder if, when it begins, there will be the same ‘Global Warming’ nonsense that is occurring now as beachside properties are inundated by rising sea levels, soon to be buried under 100m of salt water?
… [Trackback]
[…] Read More: notrickszone.com/2017/08/01/new-study-by-germany-physicists-concludes-we-can-expect-climate-cooling-for-next-50-years/ […]
[…] German physicists: “CO2 plays only minor role for global climate” […]