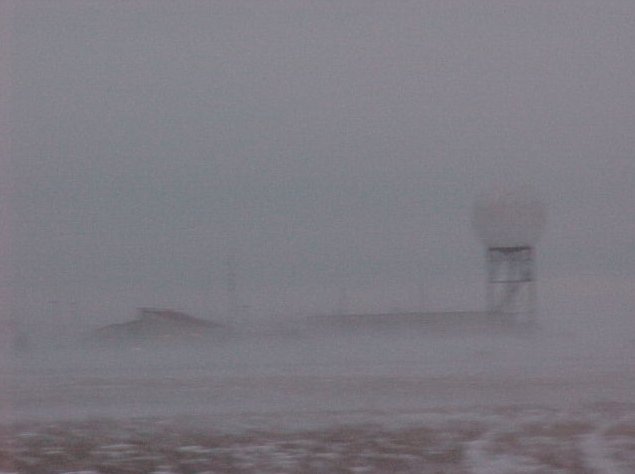
Yet another study has been published showing that regional climate cycles are related to solar activity. The most recent suggest that blizzards in North America are related to solar activity cycles.
Blizzard in Kansas. Photo: NOAA – public domain.
==========================================
More Blizzards in North America During Solar Weak Phases
By Dr. Sebastian Lüning and Prof. Fritz Vahrenholt
(German text translated/edited by P Gosselin)
In January, 2017, a study by Jill Coleman and Robert Schwartz appeared in the Journal of Applied Meteorology and Climatology . The paper looked at blizzards in the USA. Blizzards are powerful snowstorms in connection with pronounced temperature drops. What follows is the abstract:
An Updated Blizzard Climatology of the Contiguous United States (1959–2014): An Examination of Spatiotemporal Trends
Blizzards are extreme winter storms that are defined by strong winds and falling or blowing snow that significantly reduces visibility for an extended period of time. For the conterminous United States, blizzard occurrence by county was compiled from Storm Data for 55 winter seasons from 1959/60 to 2013/14. Spatiotemporal patterns were examined for blizzard seasons (September–August) at annual, decadal, and monthly frequencies. Linear regression and spectral analysis were used to detect any blizzard cycles or trends. Societal impacts such as fatalities, injuries, property damage, and federal disaster declarations were also tallied. Data revealed 713 blizzards over the 55 years, with a mean of 13 events per season. Seasonal blizzard frequency ranged from one blizzard in 1980/81 to 32 blizzards in 2007/08. The average area per blizzard was 83 474 km2, or approximately the size of South Carolina. Blizzard probabilities ranged from 1.8% to 76.4%, with a distinct blizzard zone in North Dakota, western Minnesota, and northern South Dakota. Every month except July, August, and September has reported blizzards with a peak occurrence in December and January. Federal disaster declarations resulting from blizzards totaled 57, with more than one-half of them occurring in the twenty-first century. Storm Data attributed 711 fatalities during the 55-yr study period, with an average of one individual per event; 2044 injuries were reported, with a mean of nearly three per blizzard. Property damage totaled approximately $9.11 billion in unadjusted dollars, with an approximate mean of $12.6 million per storm.”
Unfortunately we cannot get much information from the abstract and the paper itself is hidden behind a paywall. However, the Daily Mail obviously had access to the paper and reported here some interesting details that unfortunately got no mention in the abstract:
The number of blizzards has DOUBLED in the past 20 years: Scientists blame global warming and sunspots for rise in storms
–From 1960-94, the US had an average of nine blizzards per year
–But since 1995, the annual average has risen to 19, recent study found
–More blizzards are forming outside normal season of October to March
–One explanation is the use of better methods to record severe storms[…] Coleman claims sunspot cycles may also be to blame, with blizzards increasing in periods when sunspot activity has diminished. […] ‘Sunspot-minimum periods tend to coincide with more frequent polar outbreaks in the Northern Hemisphere that could increase the likelihood for blizzard occurrence,’ Coleman told ABC News. ‘However, sunspot activity is only a small component in explaining the frequency of blizzard occurrence.'”


Readers might be interested to see how autumn snow correlates with mild/harsh winters in NH.
https://rclutz.files.wordpress.com/2017/09/cohen-schematic2.png?w=612
The diagram represents how Dr. judah Cohen pictures the Northern Hemisphere wintertime climate system. He leads research regarding Arctic and NH weather patterns for AER. He explains the dynamics in an interview at Washington Post (here):
My colleagues, at AER and at selected universities, and I have found a robust relationship between two October Eurasian snow indices and the large-scale winter hemispheric circulation pattern known as the North Atlantic or Arctic Oscillation pattern (N/AO).
The N/AO is more highly correlated with or explains the highest variance of winter temperatures in eastern North America, Europe and East Asia than any other single or combination of atmospheric or coupled ocean-atmosphere patterns that we know of. Therefore, if we can predict the winter N/AO (whether it will be negative or positive) that provides the best chance for a successful winter temperature forecast in North America but certainly does not guarantee it.
https://rclutz.wordpress.com/2017/09/20/overview-winter-climate-for-nh/
I have been developing solar based long range NAOAO forecasts at weekly scales since 2008.
https://notrickszone.com/2017/01/19/defying-ipcc-models-u-s-blizzard-frequency-has-nearly-quadrupled-since-1960-as-u-s-continues-cooling/
Defying IPCC Models, U.S. Blizzard Frequency Has Nearly Quadrupled Since 1960, As U.S. Continues Cooling
“Seasonal blizzard frequencies displayed a distinct upward trend, with a more substantial rise over the past two decades. … The modeled increase in blizzard activity showed a nearly fourfold upsurge between the start and end of the study period at 5.9 and 21.6 blizzards, respectively. On the basis of current model trends, the expected blizzard total for a season is 32 blizzards by 2050; uncertainty exists on whether the linear trend will continue or stabilize in the near future.”
Who would have thought that weather and ultimately climate is largely controlled by a whitish-yellow ball in the sky?
Certainly not the “geniuses” at the IPCC and their running dogs at Greenp1ss, WTF, the BBC, CNN etc etc.