Has Global Cooling Begun?
Von Dr. Dietrich E. Koelle
(German text translated/edited by P Gosselin)
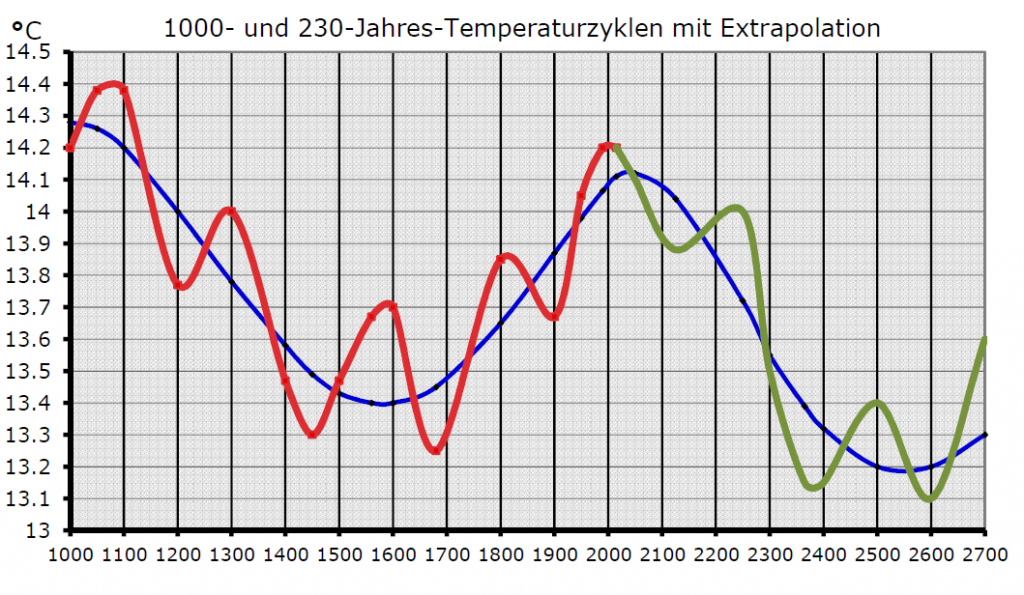
Now that the temperature maximum of the 1000-year cycle has been reached over the past two decades, a new global cooling phase can be expected — as has been the case over the past 8000 years. Why would the natural cycles just suddenly give up?
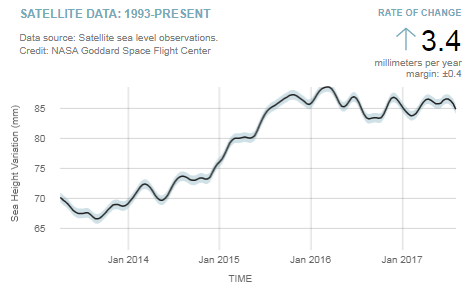
What can be expected over the next 400 years is a drop of at least 1°C to a level seen during the Medieval times some 500 years ago (called the LIA = Little Ice Age). Reports on sea level rise grinding to a halt and the unexpected rise in sea ice mass in the Arctic and Greenland further add weight to the suspicion that a new global cooling may have already started:
▪ Northern hemisphere (NH) snow cover im May 2017 was greater than at any time in the past 32 years.
▪ In May 2017 sea ice area compared to a year earlier increased during a month of May like never before, since satellite measurement began in 1979.
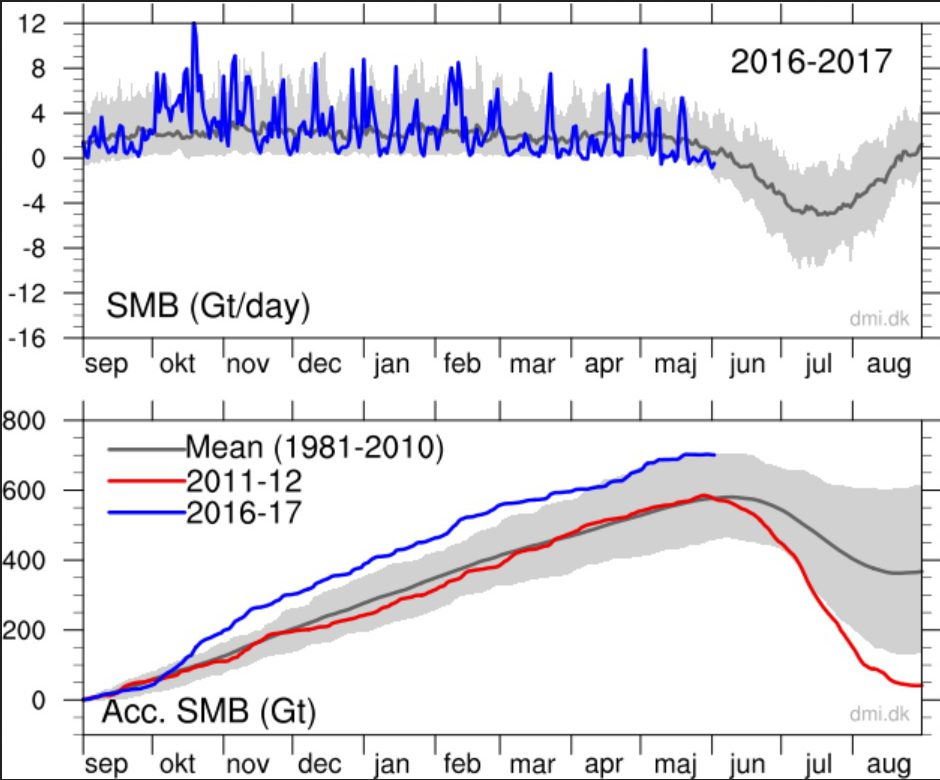
▪ The gigantic ice sheet on Greenland was also at record level in May 2017, from the beginning of September 2016 to the end of 2017 mass balance of Greenland ice at a surplus of 700 million tonnes and has never been so high since recording began!

▪ At the end of July in Greenland on the night of July 31 to August 1, a temperature of -30.7°C was measured at a location at 3200 m elevation. Never has such a low temperature been measured in the summertime since recording began in 1990. And in early July of this year, 2017, a temperature of -33.0°C was recorded in Greenland.
Also sea level is showing signs that may be related to ice mass: It has not risen in 2 years:

If one extends the temperature curve of the last 1000 years with its 230-year and 1000-year cycles, we get the following chart for the next 700 years:


I would give it another two-three years [at least], before making any predictions about “global cooling”.
Na, Pierre is an expert in predicting future cooling. Some 9 years ago he predicted that we will see -2.8 degrees or something like that until 2020. He can’t wait until then for “global cooling”. It needs to happen asap in the skeptic’s world 🙂
Seb,
Care to provide substantiation?
Just for the sake of argument, let’s look at the Alarmist’s World, shall we?
In 1990, ‘mainstream climate science’ predicted a decadal temperature increase of 0.3℃ warming under ‘Business as Usual’ human emissions scenario (with lower and upper bounds of 0.2℃ and 0.5℃ decadal warming, respectively).
https://www.ipcc.ch/ipccreports/far/wg_I/ipcc_far_wg_I_full_report.pdf
See page xxii
Fast forward to 2017: actual warming has been about 0.15℃ per decade, or half the best estimate and 25% beneath the lower bound. Yet global human CO2 emissions have been increasing at approx. 2.0% per annum, or 15% above the BaU estimate of 1.5% per annum.
Does(n’t) that raise your eyebrows? Just a bit?
And all the “warming” is accounted for by adjustments to real world temperature data.
Kurt, I was referring to this: http://archive.is/3pJIY (search for a comment made by Pierre Gosselin 9 years ago).
In reality, temperatures increased by almost 0.8°C from back then until now: http://www.woodfortrees.org/plot/rss/from:2008/to:2018
Expanding that graph further back should make clear why skeptics like Pierre predicted this kind of cooling back in 2008, they probably did the same in 2012. There is no “substance” to these kind of claims … never. It is just wishful thinking. The coming ice age yada yada 😉
Regarding predictions from 1990: do you think science had the perfect model figured out back then? To you think they have achieved that now? Why are you arguing like this? Do Newton’s finding also “raise your eyebrows” because we now know more about mechanics?
So if a trend for 2008 to 2018 temperatures is “reality”, surely you agree that the -0.8°C trend for 1998 to 2008 is “reality” too:
http://www.woodfortrees.org/plot/uah6/from:1998/to:2009
So what was the mechanism causing the temperatures to plummet by -0.8°C between 1998 and 2008, SebastianH? Assuming you believe it was CO2 that caused the warming “trend” between 2008 and 2018, explain the cause of the same cooling “trend” for the ten years prior. Or does only one of those 10-year “trends” qualify as “reality”?
The substance behind the claims comes from trend analysis, solar cycles, and hundreds of years of sunspot observations. The science definitely is not “settled” on the role of the Sun in climate change. That’s why so many scientists are continuing to predict global cooling ahead. That you are so certain that it will warm, and not cool, in the years ahead is a testament to your lack of skepticism regarding the kingpin role of human CO2 emissions in heating the Earth’s oceans.
A Swelling Volume Of Scientific Papers Now Forecasting Global Cooling In The Coming Decades
https://notrickszone.com/2017/04/10/a-swelling-volume-of-scientific-papers-now-forecasting-global-cooling-in-the-coming-decades/
Certainly cooling has already begun. The tipping point was around 1000BC. According to ice core records, the last millennium 1000AD – 2000AD has been the coldest millennium of our current Holocene interglacial.
Our current, warm, congenial Holocene interglacial, although cooler than the Eemian, has been the enabler of mankind’s civilisation for the last 10,000 years, spanning from mankind’s earliest farming to our recent advances in technology.
Each of the notable high points in the current Holocene temperature record, (Holocene Climate Optimum – Minoan – Roman – Medieval – Modern), have been progressively colder than the previous high point.
The ice core record from Greenland for its first 7-8000 years, the early Holocene, shows, virtually flat temperatures, but the more recent Holocene, since a “tipping point” at around 1000BC, 3000 years ago, has seen temperature fall at about 20 times that earlier rate at about 0.14 °C per millennium .
The Holocene interglacial is already 10 – 11,000 years old and judging from the length of previous interglacial periods, the Holocene epoch should be drawing to its close: in this century, the next century or this millennium.
Nonetheless, the slight beneficial warming at the end of the 20th century to a Modern high point has been transmuted by Climate alarmists into the “Great Man-made Global Warming Scare”.
The recent warming since the end of the Little Ice Age has been wholly beneficial when compared to the devastating impacts arising from the relatively minor cooling of the Little Ice Age, which include:
• decolonisation of Greenland
• Black death
• French revolution promoted by crop failures and famine
• the failures of the Inca and Angkor Wat civilisations
• etc., etc.
As global temperatures, after a short spurt at the end of the last century, have already been showing stagnation or cooling over the last two decades, the world should now fear the real and detrimental effects of cooling, rather than being hysterical about limited, beneficial or probably now non-existent further warming.
Warmer times are times of success and prosperity for man-kind and for the biosphere. During the Roman warm period the climate was warmer and wetter so that the Northern Sahara was the breadbasket of the Roman empire.
But the coming end of our present Holocene interglacial will eventually again result in a mile high ice sheet over much of the Northern hemisphere. As the Holocene epoch is already about 11,000 years old, the reversion to a true ice age is becoming overdue.
That reversion to Ice Age conditions will be the real climate catastrophe.
With the present reducing Solar activity, significantly reduced temperatures, at least to the level of another Little Ice Age are predicted quite soon, later in this century.
Whether the present impending cooling will really lead on to a new glacial ice age or not is still in question.
see
https://edmhdotme.wordpress.com/holocene-context-for-catastrophic-anthropogenic-global-warming/
I’ve read a few of your comments before at other site, and I believe you may find this interesting https://usclivar.org/research-highlights/finding-parallels-between-hadley-cell-expansion-and-global-warming-hiatus
The author completely misunderstands what’s happening to the Greenland ice sheet, yet makes such confident claims.
There’s no data that indicates it’s growing, or that the mass has “never been so high since recording began”
Last year was the 5th highest mass balance since 1979, with a surface mass gain of 544 billion tonnes of ice, 32.5% above the long-term average (368 billion tonnes).
https://www.carbonbrief.org/guest-post-greenland-ice-sheet-2017
“For the 2016-17 SMB year, which ended yesterday, the ice sheet had gained 544bn tonnes of ice, compared to an average for 1981-2010 of 368bn tonnes.”
“The SMB for 2016-17 is the fifth highest in the 37-year record.”
Kenneth,
You may be interested in this recent paper about the Gulf Stream and how it affects the Atlantic wind and weather. http://journals.ametsoc.org/doi/abs/10.1175/JPO-D-16-0115.1
Yes, it is mostly modeling but it is supported by some observational evidence.
Its effects are not well known, and yet these effects are significantly what drive warming and cooling.
Good paper.
Let’s always post the full quote, shall we?
Yes, overall it has. But there has been a rapid deceleration in the rate of mass loss in the last 10 years. The GIS lost -367 GtC/year during 2008-2012. Since then (2013-2017), the GIS mass loss has averaged closer to -100 GtC/year…with the most recent year showing a mass gain. Between 1992 and 2002, the GIS gained mass (+11 GtC/year). Between 1961-1990, the GIS gained mass (Fettweis et al., 2017). Between 1940 and 2000, there were no net changes in GIS SMB. So what we have here is an oscillation that plateaued in the 2008-2012 years and is now headed back to balance.
And none of these oscillating trends represent a correlation with linearly rising CO2 emissions.
Care to elaborate on when that (the moment of balance) will be so we can come back to this point in time and I can remind you of how wrong you were? Or ask differently: since you know that it is an oscillation, what will be the ice mass of Greenland 10 years from now?
Thank you for letting me once again post this graph: https://imgur.com/a/IkdQh
Apparently you still don’t understand it.
It will not be a “moment” of balance, but a decadal-scale period of years when the ice sheet is more or less in balance (or even advancing). After all, the entire Arctic region has undergone a temperature pause since about 2005, as well as a long-term oscillation in temperature (with periods of warming in the 1920s-1940s, cooling from the 1940s to 1980s, warming from the 1990s to about 2005, and then a pause since then). Overall, the Arctic’s temperature was warmer than the 1930s and 2000s during the Medieval Warm Period.
Quite similarly, Greenland has undergone a slight cooling trend since 2005, a warming-cooling-warming temperature oscillation during the last 100 years (see here and here and here and here), with no net warming trend since the 1920s. The current temperatures in Greenland are about 3 degrees C colder than it was during the Holocene Thermal Maximum, when CO2 concentrations hovered around 260 ppm.
None of these changes follow the linear trend in anthropogenic CO2 emissions, defying the models.
Like the entire Arctic region, Greenland has followed a warming-cooling-warming temperature and SMB oscillation as part of quasi-60-year natural cycles related to the NAO, AMO, and AO. Arctic sea ice has undergone a similar warming-cooling-warming oscillation, leading to a decline-advance-decline pattern, which again defies the models—just as the SH sea ice gains contradict the models.
–
https://www.jstage.jst.go.jp/article/sola/6A/SpecialEdition/6A_SpecialEdition_1/_pdf
Since the decadal variation of the AO is recognized as the natural variability of the global atmosphere, it is shown that both of decadal variabilities before and after 1989 in the Arctic [cooling, then warming] can be mostly explained by the natural variability of the AO not by the external response due to the human activity.
–
http://onlinelibrary.wiley.com/doi/10.1002/joc.4440/abstract
A multiple linear regression analysis reveals that interannual variability in extreme blocking and the Atlantic Multidecadal Oscillation (AMO) are the two predominant drivers of surface meltwater production across the entire Greenland ice sheet (GrIS)
–
http://www.nature.com/nature/journal/v509/n7499/full/nature13260.html
We find that the most prominent annual mean surface and tropospheric warming in the Arctic since 1979 has occurred in northeastern Canada and Greenland. In this region, much of the year-to-year temperature variability is associated with the leading mode of large-scale circulation variability in the North Atlantic, namely, the North Atlantic Oscillation. Here we show that the recent warming in this region is strongly associated with a negative trend in the North Atlantic Oscillation, which is a response to anomalous Rossby wave-train activity [planetary waves related to the Earth’s rotation] originating in the tropical Pacific. Atmospheric model experiments forced by prescribed tropical sea surface temperatures simulate the observed circulation changes and associated tropospheric and surface warming over northeastern Canada and Greenland. Experiments from the Coupled Model Intercomparison Project Phase 5 models with prescribed anthropogenic forcing show no similar circulation changes related to the North Atlantic Oscillation or associated tropospheric warming. This suggests that a substantial portion of recent warming in the northeastern Canada and Greenland sector of the Arctic arises from unforced natural variability.
can you trust a graph in which they spell may with a J????
seriously???????
That’s how “May” is spelled in Denmark. It’s the Danish Meteorological Institute.
Never trust a Danish!
Just believe in NASA and NOAA 😉
I trust none of them…
A radical change happened recently when most weather models, including NASA and NOAA went from putting Europe in the freezer for winter, to now most models saying Europe’s winter will be mild and wet.
With all forecasting I subscribe to the “you don’t know what you’ll get till you got it” outlook.
Here is a brief interpretation (from a UK perspective) of many, many weather models looking at what the winter months might bring — https://youtu.be/ZNrbQOvJDDo
If you can’t trust Danish, what pastry can you trust?
Are jou kidding??
[…] See also here […]
Global cooling began with the Minoan maximum about 3000 years ago. The recent warming since the depths of the LIA has resulted from a combination of (1) earth warming indicated by a proxy (SSN anomaly time-integral) and probably caused by cloud changes, (2) ocean surface temperature oscillations, and (3) increasing water vapor. Increasing water vapor has been countering cooling but will eventually be overwhelmed by increasing cloud cover. Current trend projection at http://globalclimatedrivers2.blogspot.com is looking about 0.1 K low for 2020.
Wow a lot of negativity here with regards to natural cycles, CO2 is really a pathetic argument with regards to temperature increases, CO2 lags behind temperature by around 7/800 years so how can it contribute to “warming”?. show me a chart where CO2 is ahead of temps and i will eat my words, (a real one), we also seem to forget the solar cycle contribution to changing climate conditions, maunder minimum 1675-1715 no sun spots, dalton minimum of the 1800’s weak solar cycle, downward temps after a weak cycle 24?, there are external forcings that also contribute to climate variations, volcanic ash, the PDO, the AMO the SAO, stop banging on about a miniscule contributor like CO2 and look at the bigger picture folks.
Humlum et al., 2013 “The phase relation between atmospheric carbon dioxide and global temperature”
Chart
“There exist a clear phase relationship between changes of atmospheric CO2 and the different global temperature records, whetherrepresenting sea surface temperature, surface air temperature, or lower troposphere temperature, with changes in the amount of atmospheric CO2 always lagging behind corresponding changes in temperature.”
(1) The overall global temperature change sequence of events appears to be from 1) the ocean surface to 2) the land surface to 3) the lower troposphere.
(2) Changes in global atmospheric CO2 are lagging about 11–12 months behind changes in global sea surface temperature.
(3) Changes in global atmospheric CO2 are lagging 9.5–10 months behind changes in global air surface temperature.
(4) Changes in global atmospheric CO2 are lagging about 9 months behind changes in global lower troposphere temperature.
(5) Changes in ocean temperatures appear to explain a substantial part of the observed changes in atmospheric CO2 since January 1980.
(6) CO2 released from anthropogenic sources apparently has little influence on the observed changes in atmospheric CO2, and changes in atmospheric CO2 are not tracking changes in human emissions.
(7) On the time scale investigated, the overriding effect of large volcanic eruptions appears to be a reduction of atmospheric CO2, presumably due to the dominance of associated cooling effects from clouds associated with volcanic gases/aerosols and volcanic debris.
(8) Since at least 1980 changes in global temperature, and presumably especially southern ocean temperature, appear to represent a major control on changes in atmospheric CO2.
Essenhigh, 2009
“[With the short (5−15 year) RT [residence time] results shown to be in quasi-equilibrium, this then supports the (independently based) conclusion that the long-term (∼100 year) rising atmospheric CO2 concentration is not from anthropogenic sources but, in accordance with conclusions from other studies, is most likely the outcome of the rising atmospheric temperature, which is due to other natural factors. This further supports the conclusion that global warming is not anthropogenically driven as an outcome of combustion.”
–
Ahlbeck, 2009
“The increase rate of atmospheric carbon dioxide for the period from 1980 to 2007 can be statistically explained as being a function solely of the global mean temperature. Throughout the period, the temperature differences seem to have caused differences around a base trend of 1.5 ppmv/year. The atmospheric CO2 increase rate was higher when the globe was warmer, and the increase rate was lower when the globe was cooler. This can be explained by wind patterns, biological processes, or most likely by the fact that a warmer ocean can hold less carbon dioxide. This finding indicates that knowledge of the rate of anthropogenic emission is not needed for estimation of the increase rate of atmospheric carbon dioxide.”