Two days ago Kenneth presented an impressive flurry of scientific, peer-reviewed charts published over the past 15 months (46 alone in 2018). Much to the surprise of alarmist scientists, global warming is weak at best.
Lack of warming a global phenomenon
According to Kenneth, these new papers show that “nothing climatically unusual is happening”. For example a publication by Polovodova Asteman et al shows that continental Europe’s temperatures are lower today than they were on other occasions over the past 2000 years:
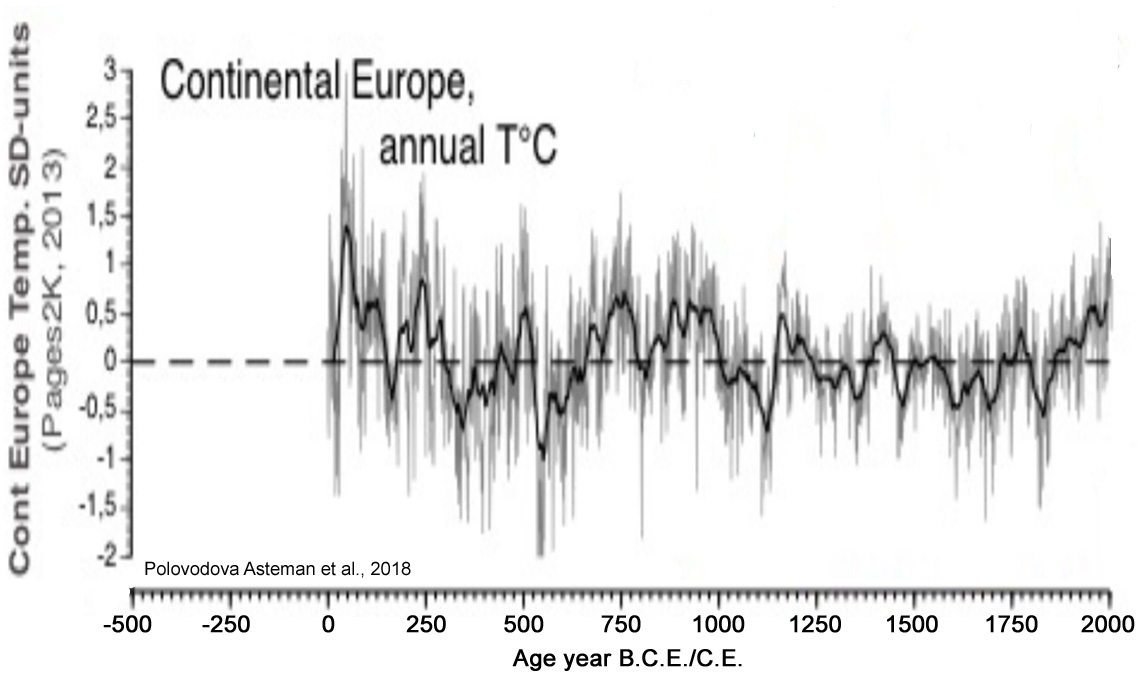
Source: Polovodova Asteman et al
Today’s warming doesn’t stand out
The authors write that the contemporary warming of the 20th century “does not stand out in the 2500-year perspective” and is “of the same magnitude as the Roman Warm Period and the Medieval Climate Anomaly.”
A number of strident global warming scientists prefer to dismiss the significance of Europe’s temperature record, claiming that it is local in nature and does not tell us what is really happening globally. However, other papers fully contradict this. For example, a paper by Wündsch et al., 2018 shows us that the warming today in South Africa also is nothing unusual.
It’s global, stupid
Temperature reconstructions show the same is true in Southeast Australia, according to McGowan et al., 2018, Northern Alaska (Hanna et al., 2018), the Tibetan Plateau (Li et al., 2018), South Korea (Song et al., 2018), Antarctica (Mikis, 2018), to cite just a few among dozens of others.
“Warming holes” surprise scientists
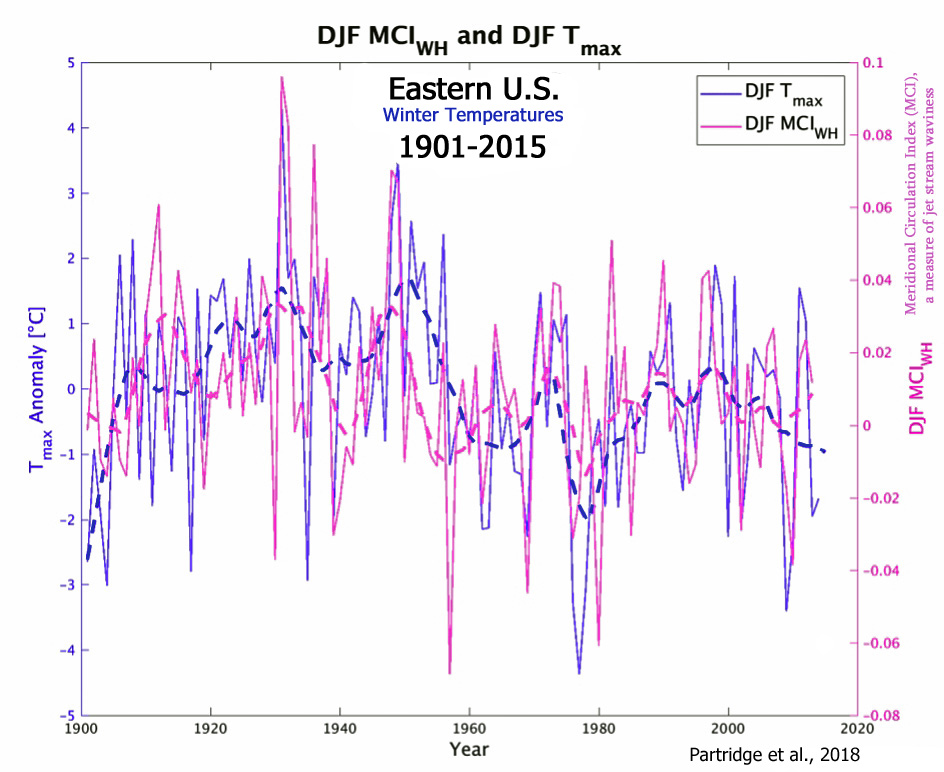
Meanwhile new findings by Partridge et al., 2018 show in fact that other regions have cooled. The eastern US “annual maximum and minimum temperatures decreased by 0.46°C and 0.83°C respectively.”
The surprising winter cooling has led scientists to dub the eastern US a “warming hole”, where scientists blame oceanic cycles for the unexpected cooling.
Greenland within normal, cooler than 1930s
Greenland often gets cited by alarmists as a climate canary in a coal mine due to its massive ice sheets and their potential to cause dramatic sea level rise should they melt. But a brand new study by Mikkelsen et al., 2018 shows that surface temperatures going back over 150 years are lower than they were in the 1930s!
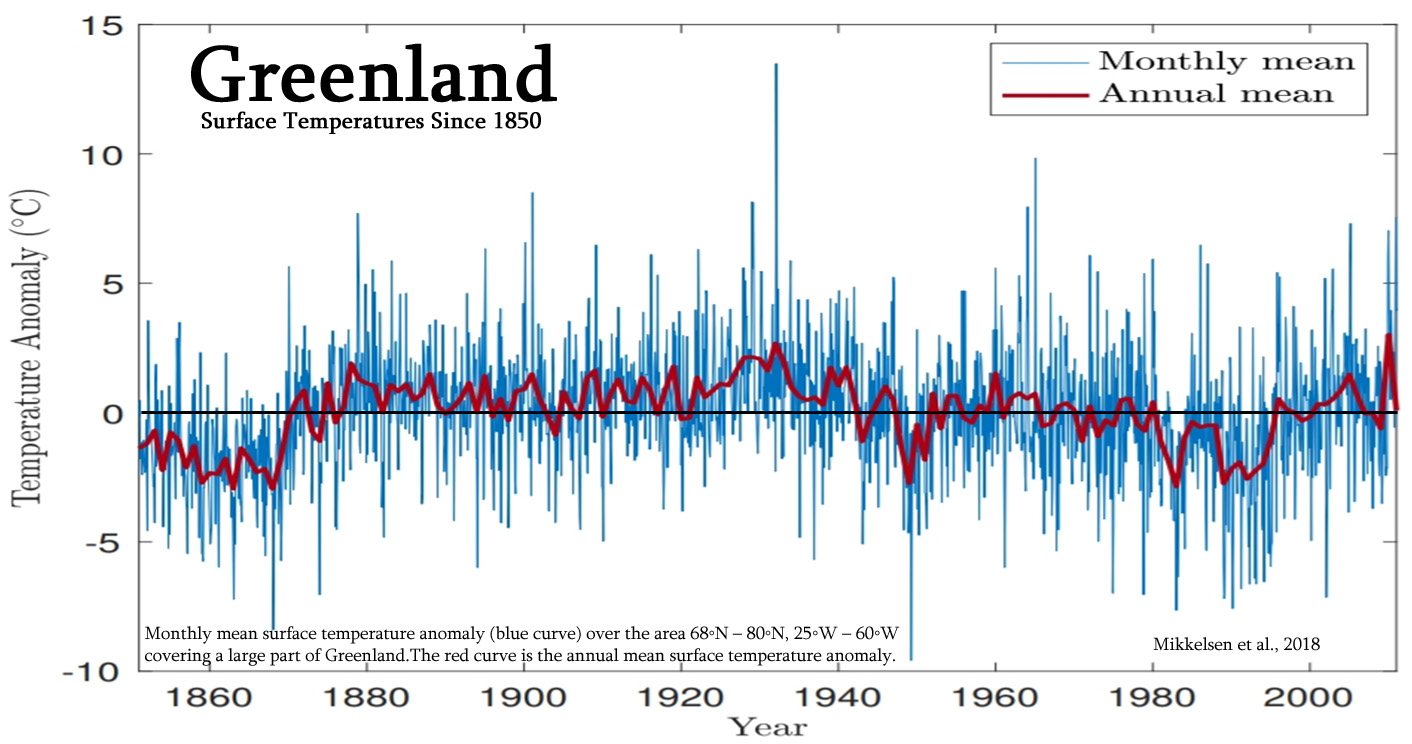
Source: Mikkelsen et al., 2018, Figure 2. Surface temperature anomalies obtained from (KNMI), “Twentieth Century Reanalysis V2c” from the years 1851 to 2011 in a box spanning 68N to 80N and 25W to 60W.
Looking at the above Greenland surface temperature chart, we see that the mercury plummeted some 5°C from 1930s to the 1980s before thankfully rebounding in the 1990s and 2000s. Here as well there exist no signs for warming alarm.
Greenland cooling again since 2000
Furthermore, much to the surprise of global warming scientists, Greenland temperatures have again been falling since 2000. Westergaard-Nielsen et al., 2018 examined the most recent and detailed trends based on MODIS (2001–2015) and concluded that if there is any general trend for Greenland it is “mostly cooling”.
South Pole cooling, getting icier
At the other end of the planet at the South Pole, new findings by Cerrone and Fusco, 2018 confirm the large increase in the southern hemisphere sea ice and suggest it “arises from the impact of climate modes and their long-term trends”.
They write that the results indicate a progressive cooling has affected the year-to-year climate of the sub-Antarctic since the 1990s and that the SIC [sea ice concentration] shows upward annual, spring, and summer trends.


If Society Can’t Trust Science, What Can They Trust? Climate Alarmist is Playing San Francisco Judge as a Complete Fool
Dr. Myles Allen must think that the San Francisco Judge is a complete fool. I just finished a post refuting many of his claims, but one example needed to be singled out. In his presentation, Dr. Myles Allen replaced the poster child Mt. Kilimanjaro, which was exposed as a fraud in the Climategate emails, with … Continue reading
https://co2islife.wordpress.com/2018/03/25/climate-alarmist-is-playing-san-francisco-judge-as-a-complete-fool/
Great read CO2isLife just read the main link.
been working on a few myself but loved your Absorption graph a lot better than my hand drawn one trying to show the H2O / CO2 overlaps.
Have you thought about including the errors in their energy balance equation ie circa missing 2 W/m2 versus errors circa 17 w/m2?
I’m just glad that he recognizes that without oil the global economy would collapse. That’s a start …
Time to get off oil and reduce our dependencies. Why start in 20 or more years when you can start now?
What’s the benefit of “getting off” petroleum-based energies and products (i.e., plastic)? Is the proposed replacement more cost effective, reliable, and efficient? Or do these factors not matter?
You are seriously asking what is the benefit? What is the benefit of quitting smoking? Of eating heathy? Of recycling trash? Do you need answers for these questions as well?
Yes, they are or will be in the near future. The transition will take place with or without your consent …
Dream on in your little fantasy la-la-land, seb.
Coal and other fossil fuel powered electricity and CO2 emissions will continue to rise on a world wide basis.
They will continue to be the mainstay of energy use for Decades maybe CENTURIES to come.
And there is NOTHING your childish anti-science daydreams can do about it.
I think it’s time for chatbots to stop eating, and reduce their dependence on food.
All AGW sympathisers and parrots should reduce their dependence on ALL THINGS CARBON, to ZERO.
That would be ideal, and would make for a much more sane and peaceful world.
One thing we certainly CANNOT depend on is wind and solar.
If you want some hard core physics/engineering try any of this fellow’s articles on the energy budget, like this one where he shows that the climateers can’t balance an energy budget to save their lives.
https://objectivistindividualist.blogspot.com/2017/09/climate-change-settled-science.html?m=1
The more comprehensive prior post is a must read, too: “Climate Sophistry In San Francisco; Half-Truths are Twice the Lie.” https://co2islife.wordpress.com/2018/03/24/sophistry-in-san-francisco-half-truths-are-twice-the-lie/
While I appreciate the sceptics’ sound scientific and empirical work on all fronts (so ably documented and discussed here at NoTricksZone), sometimes I feel that the physics of CO2 is not receiving enough attention by sceptics. Why this is so I fail to understand.
The physics of CO2 has been dealt with, as here…
https://www.john-daly.com/forcing/forcing.htm
…and elsewhere.
Still, I would like to see someone quantify that experimentally. Probably not being done because no grants haven’t been written and/or approved to study it, and so there’s no money to fund it.
But, as seen from the one link above and also from this one…
https://www.john-daly.com/artifact.htm
…enough is known to dismiss the notion that CO2 is dangerous, even under a “worst case” scenario.
yonason, Thank you for your reply and the links. The physics of CO2 clearly shows that CO2 is incacapble of achieving the catastrophic effects ascribed to it by alarmists. Why is this message not at the centre of the sceptics’ case? Even your links refer to rather arcane (for the average nonspecialist reader) presentations. Why are there no popularisations so that the layman immediately gets the point?
I am always at awe when someone posts an obscure “prove” of some retired hobby scientist and thinks that finally shows that all other scientists have been wrong …
Why do you believe authors like the ones yonason posted more than actual science?
You wouldn’t know what actual SCIENCE was, seb
You REMAIN TOTALLY EMPTY of any actual science to back up even the most basic of AGW fallacies.
John Daly had more climate knowledge than all of the AGW scammers put together.
All you can manage is a pathetic little ad-hom.
You have ZERO SCIENCE.
Note that the article I referenced was written by Peter Dietze, an engineer and expert reviewer for the IPCC.
As to John Daly, while he made observations himself, he also compiled articles and information by many scientists who the resident trolls hate for opposing the warmist agenda. Here’s his obit.
http://www.lavoisier.com.au/articles/greenhouse-science/climate-change/evans-daly2004-2.php
On the other hand, here are the guys the trolls want us to listen to.
http://www.populartechnology.net/2012/03/truth-about-skeptical-science.html?m=1
I’m not sure why the CO2 info isn’t more emphasized by skeptics. Maybe after we see the horse is dead, we see no reason to keep beating it? Seriously, though, despite how much we know about the gas, there seems to be a lot that isn’t known. Not sure why that’s not being investigated. I would also like to see it.
Here’s something you might like.
https://objectivistindividualist.blogspot.com/2017/12/does-additional-co2-in-atmosphere-cause.html?m=1
You can do a search for CO2 on his website for more of what he’s written on that.
Note that when I first posted on him, the troll SebH wrote that he probably did poorly in college – apparently not having read his bio. He’s a PhD physicist who runs a consulting company dealing with, among other things, heat transfer issues.
Myles Allen has lots of form:
http://mfgaccountabilityproject.org/2018/01/07/activists-hope-use-climate-attribution-take-manufacturers/
“Allen first got the idea of going after manufacturers back in 2003 when he was told it would be “impossible to attribute this particular event [floods in southern England] to past emissions of greenhouse gases.” Allen disagreed. According to Climatewire, Allen saw “the possibility of massive class-action lawsuits—carrying the potential for ‘up to six billion plaintiffs’ around the world—attempting to hold greenhouse gas emitters liable for damages.”
It was several years later that Allen would attend the exclusive summit of anti-fossil fuel activists in La Jolla, California, where they would lay out their plans to take down energy manufacturers.
The summit, hosted by the Union of Concerned Scientists and Climate Accountability Institute, was attended by many activists with whom Allen would later co-author several papers that attempt to attribute specific climate damages to individual companies.”
There is a lot more background on Allen here:
“Playing Climate Games – The Latest Attempt to Blame Carbon Dioxide for Extreme Weather” 2011.
http://scienceandpublicpolicy.org/science-papers/originals/playing-climate-games
“However, he (Allen) is also trying to produce a credible model to support the insurance industry and the NGO’s who are trying to sue countries for having had the gall to have a decent standard of living. This was his message in a BBC interview in 2003:
“The vast numbers affected by the effects of climate change, such as flooding, drought and forest fires, mean that potentially people, organisations and even countries could be seeking compensation for the damage caused.”
“It’s not a question we could stand up and survive in a court of law at the moment, but it’s the sort of question we should be working towards scientifically,” Myles Allen, a physicist at Oxford University, UK, told the BBC World Service’s Discovery programme.”
“Some of it might be down to things you’d have trouble suing – like the Sun – so you obviously need to work how particularly human influence has contributed to the overall change in risk,” the scientist, who has worked with the UN’s Intergovernmental Panel on Climate Change (IPCC), said.”
“But once you’ve done that, then we as scientists can essentially hand the problem over to the lawyers, for them to assess whether the change in risk is enough for the courts to decide that a settlement could be made.”
“This next decade is going to see quite a lot of climate change cases around the world”, said environment lawyer Peter Roderick, who runs the Climate Justice Program for Friends Of The Earth International.
That is Allen’s UN agenda, and he had used this legal compensation approach with the European Heat Wave, when claims of 30-40,000 deaths were made. Allen and Richard Lord, a London lawyer, published “The Blame Game”, again in the journal Nature, linking responsibility for the European heat wave of 2003 to greenhouse gas emissions.”
The sad thing is that Allen was a PhD student under Professor Richard Lindzen. He must have cut a lot of classes.
When can we sue the con-artists like Allen and Gore etc., for the harm THEY are causing?!
“The vast numbers affected by the effects of climate change, such as flooding, drought and forest fires, mean that potentially people, organisations and even countries could be seeking compensation for the damage caused.”
Even in the unlikely event some link could be established in law, in English-based common law there would be two defences ‘Volenti non fit injuria’ (to a willing person, no injury is done) and contributory negligence as the plaintiffs themselves have knowingly contributed to their own damage, no-one is forced to use fossil fuels.
Sceptics will never win a battle of facts with alarmists, because alarmists rely on emotion and feelings, not uncomfortable truths.
You cannot argue facts with a religious cult.
That is funny. You got the sides wrong though. It is you guys who are resistent to facts, rely on emotions and gut feelings. It is you who act cultish. No amount of science can convince you that you could be wrong. You’ll always find obscure papers supporting your views or will be able to interpret perfectly fine papers in a way that you feel supports your view (like the first one in the article above) 🙂
But it’s interesting that you feel this way. That somehow facts would be on your side …
“It is you guys who are resistent to facts,”
What facts?
You DON’T have any facts, you AVOID them like they were the plague.
Nor do you have any science to back up even the most basic fallacy of the AGW scam.. ie CO2 warming.
We are still waiting for you to produce that obscure paper that proves empirically that enhanced atmospheric CO2 has any effect other than making plants grow better.
You are kidding, right? Do you also need a paper that “proves” that gravity is causing stuff fall towards the ground?
The manic EVASION continues.
HILARIOUS…
and so, so PATHETIC
and we are still waiting for you to produce that obscure paper that proves empirically that enhanced atmospheric CO2 has any effect other than making plants grow better.
Poor EMPTY seb.
You really have NOTHING at all, do you ! 🙂
—–
And yes, gravity does cause stuff to fall.
Its produces what is called the gravity/thermal gradient that regulates the Earth’s temperature.
So you were joking, thanks for the clarification.
Your continual DENIAL of proven science is quite HILARIOUS.
Are you saying that gravity does not set the gravity-thermal gradient??
REALLY ????
Quite bizarre that you can be SO IGNORANT of basic science.
@Bitter&twisted 25. March 2018 at 6:22 PM
LOL – and in the first response to you, we have the proof you are correct.
Slightly off topic but the US government agencies says that they can determined the amount of sea-ice there is at the North Pole. They say they can make a very accurate assessment of where it is and how thick it is through their satellite monitoring and computer models, this information is freely available to all including the US armed forces. However on March 22, the US navy has managed to get one of it’s submarines stuck in overly thick ice, ice which by all technical means at the US governments disposal is not that thick. So how can that be?
The American nuclear submarine Connecticut could not rise to the surface in the Arctic due to an ice sheet. Another submarine missile carrier, Hartford (SSN 768), managed to break through the ice, but the submarine that surfaced received significant damage.
https://www.fort-russ.com/2018/03/us-nuclear-submarine-gets-stuck-in-arctic-ice-deterring-the-russians/
Another “ship of fools”.
I am pretty sure you a falling for Russian propaganda here …
Two submarines surfaced and there is no report of “significant damage” to be found except on some fringe Russian websites which boast about their superior Artic capabilities.
ROFLMAO..
Do you really think Russia DOESN’T have superior Arctic capability. !!! Seriously !!!!
You really do live in a FANTASY la-la-land, seb
But we knew that.
You have ZERO FACTS as always.
Interesting reply. So you interpreted the last sentence of my comment like I was saying they don’t have superior Arctic capabilities … why?
And why is this the important part of my comment, that you chose to make up a straw man for, to be able to attack it?
Do you believe what a site like fort-russ.com is writing without any mention of a source? Why?
You say ” Russian propaganda…….blah, blah……fringe Russian web sites”,
You KNOW what you were implying..
Caught out in your own LIES and slime, yet again, seb.
Speaking of “Russian Propaganda,” TomOmason…
https://www.thenewamerican.com/tech/energy/item/28447-congress-kremlin-used-green-propaganda-to-undercut-u-s-energy
It’s the trolls who are either falling for it, or willing accomplices.
More here
https://notalotofpeopleknowthat.wordpress.com/2018/03/28/u-s-energy-markets-the-real-russian-meddling-the-media-ignores/
That paper uses proxy data from sediments that only reach into the 1990s. It doesn’t show the 0.4 – 0.6 C increase from the last 20 years. The authors also mention ” At the same time the spring SST reconstruction from the
Chesapeake Bay (Cronin et al., 2003, Fig. 6 herein) shows that the 20th century warming clearly exceeds the temperatures
observed during the prior 2500 years. “
In their reconstruction up until the 90s from a single location that is. They do discuss other location and they do have other temperature graphs in their paper. It’s also interesting that you chose to post the graph from their paper that originates from a 2013 Pages2K paper. A paper that confirmed the “Hockey stick” 😉 From that Pages2K paper:
the global warming that has occurred since the end of the nineteenth century reversed a persistent long-term global cooling trend. The increase in average temperature between the nineteenth and twentieth centuries exceeded the temperature difference between all other consecutive centuries in each region, except Antarctica and South America.”
You picked from the wrong cherry tree …
The Polovodova Asteman paper also includes this text:
“Most of the proxy records in the North Atlantic indicate a clear warming trend for the last 100-200 years (Hald et al., 2011 and references therein) similar to our data picking up the warm 1930s and the 1990s (Fig. 8). The 500-yr long reconstruction of Stockholm winter temperatures also demonstrates that the 20th 30 century has experienced four out of five warmest decades over the last 500 years: 1905-1914, 1930-1939, 1989-1998 and 1999-2008 (Leijonhufvud et al., 2009). Gullmar Fjord temperature record shows that when considering a 3-point running mean temperature variability, the most recent warming stretching to 1999 does not stand out in comparison to the RWP and the MCA, similar to the Scottish loch data (Cage and Austin, 2010) and the North Atlantic SST composite (Cunningham et al., 2013) but in contrast to the Malangen Fjord record (Hald et al., 2011), according to which the last 100 years are the warmest in the last 2000 years
And indeed, the source for the continental Europe reconstruction is PAGES 2K, a paper that confirmed the Hockey Stick.
“The most coherent feature in nearly all of the regional temperature reconstructions is a long-term cooling trend, which ended late in the nineteenth century. At multi-decadal to centennial scales, temperature variability shows distinctly different regional patterns, with more similarity within each hemisphere than between them. There were no globally synchronous multi-decadal warm or cold intervals that define a worldwide Medieval Warm Period or Little Ice Age, but all reconstructions show generally cold conditions between AD 1580 and 1880, punctuated in some regions by warm decades during the eighteenth century. The transition to these colder conditions occurred earlier in the Arctic, Europe and Asia than in North America or the Southern Hemisphere regions. Recent warming reversed the long-term cooling; during the period AD 1971–2000, the area-weighted average reconstructed temperature was higher than any other time in nearly 1,400 years.”
So I am curious, does NTZ endorse PAGES 2K, and therefore the Hockey Stick, or not, in which case why reproduce a graph based on PAGES 2K data?
Mmmmm cherries!
Uh, no, PAGES 2K (2013) does not confirm that there was no warmer or as-warm-as-now 1st millennium, or flat handle, to the proverbial hockey stick. The opposite, in fact.
First of all, a year after the PAGES 2K data set (2013) was released (2014), the authors had to retract their claim that the Arctic – 1/3rd of their 1st millennium coverage area – was warmer in the 20th century than any time in the last 2,000 years.
The PAGES 2K authors issued a correction to the “several errors” in their Arctic reconstruction. Astonishingly, these subsequent 2014 corrections made temperatures in the Arctic just as warm during the Medieval Warm Period (~1,000 AD) as modern—and for much of the 1,000 years preceding it.
http://www.nature.com/articles/sdata201426
“Here we present an Arctic regional temperature reconstruction that revises the one published recently by the PAGES 2k Consortium. The revisions include updating records using more recent published studies from three sites, and correcting several errors discovered following publication of the PAGES 2k Consortium article. … 1. Three records were removed because of insufficient evidence that they are sensitive to temperature. 2. Sections of five records that were interpreted by the authors to violate criterion 5 were removed. 3. The interpreted temperature relation of the series from Hvítárvatn was corrected from positive to negative. 4. A 50-year offset in the ages of the record from Lone Spruce Pond was corrected. 5. The coordinates of the Copper River tree-ring reconstruction were corrected.”
With these error corrections to the original PAGES 2K reconstruction, the Medieval Warm Period (1,000 AD), as well as much of the entire 0 AD to 1,000 AD period, turns out to be just as warm (if not warmer in some decades) in the Arctic as are modern temperatures. Isn’t it amazing that all of the corrections turned out to suppress the modern temperature, and warm up the past temperatures (see C in Figure 2, link below)? Just a coincidence, probably. Here’s what the corrected Arctic record looked like as of 2014 (red) versus the uncorrected 2013 (black) record:
http://www.nature.com/articles/sdata201426/figures/2
Of the 7 regions that cover land masses only in PAGES 2K (2013), only 2 covered from 1 AD to present – the Arctic and Europe. Antarctica was represented beginning in 167 AD. Asia begins in 800 AD. South America begins in 857 AD. North America begins in 1204 AD. Australasia begins in 1001 AD. So 4 of the 7 regions of this “global” study of the last 2,000 years have no data from 1 AD to 800 AD. Of the 3 regions that do cover the 1st millennium — the Arctic (corrected), Antarctica, and Europe — all 3 indicate that the 1st millennium had warmer periods than the late 20th century.
PAGES 2K press release
“We also found that temperatures in some regions were higher in the past then they were during the late 20th century and that, the longer the individual site record, the more likely it was to show prior warm intervals, which is consistent with the long-term cooling trend. In Europe, for example, the average temperature between AD 21 and 80 was warmer than during AD 1971-2000.”
“The Arctic was also warmest during the twentieth century [prior to the 2014 retraction of this claim], although warmer during 1941–1970 than 1971–2000 according to our reconstruction.”
“In Europe, slightly higher reconstructed temperatures were registered in A.D. 741–770, and the interval from A.D. 21–80 was substantially warmer than 1971–2000.”
“Antarctica was probably warmer than 1971–2000 for a time period as recent as A.D. 1671–1700, and the entire period from 141–1250 was warmer than 1971–2000.”
But please do explain why it is that you believe PAGES 2K supports the Michael Mann version of a flat-handled (no 1st millennium warming period) hockey stick in their “global” reconstruction comprising 3 regions that all had warmer-than-now decades.
To my lay-eye the revised PAGES 2K chart indicates that for the past ~70 years, the period during which human emissions have skyrocketed and supposedly been the overwhelming climate forcing agent, the temperature proxy trend has flatline:
https://climateaudit.files.wordpress.com/2014/10/arctic2k-revised1.png
[…] Full post […]
“Mediæval Climate Anomaly”? Anomalous to what?
“Anomalous to what?”
The MWP was a warmer anomaly in the general cooling trend from around 1500BC, called “neoglaciation”.
Yes, that wording is an attempt to make the centennial-scale Medieval period between about 800 and 1200 AD — when wine vineyards reached as far north as Scotland and Vikings were farming on Greenland in regions now covered in permafrost — appear flukey.
“Mediæval Climate Anomaly”
Anomalous from what those sad human soothsayers expect.
Nature is always anomalous, or at least very unpredictable and chaotic, there are cycles but even these are very approximate and wobble around in intensity and timing.
Climate and weather have never been ‘settled science’, they will continue to be anomalous to expectations.
The real anomaly for the Holocene, was the 500 years or so of the Little Ice Age.
Thank goodness for the very slight warming out of that nasty, cold, spiteful period.
Not so sure about your claim. You might be aware of a few bubbles that might be pricked in these studies, all but one of which seems to make rather too many assumptions:
“These records are essential to place in context the impact of anthropogenic global warming…” (https://www.nature.com/articles/s41598-018-22766-z) So, man-made global warming is taken as read, then?
“The significant and ongoing environmental changes in Arctic regions demonstrate the need for quantitative, high-resolution records of pre-industrial climate change in this climatically sensitive region; such records are fundamental for understanding recent anthropogenic changes in the context of natural variability.” (http://journals.sagepub.com/doi/full/10.1177/0959683617752845) No explanation of why this region is any more “climatically sensitive” than any other, nor is there any explanation of what is meant by “climatically sensitive”. Again, significant anthropogenic influence is assumed, with little to back it up.
“Climate change threatens sustainable development in the coastal areas of Asia…” (https://www.sciencedirect.com/science/article/pii/S1367912017306211) Again, no explanation of what is meant by “sustainable development”, nor why a change in the climate would threaten it, other than a link to other papers which, curiously, merely results in this paper being reloaded.
“The Antarctic Peninsula and the surrounding Southern Ocean are some of the most climatically sensitive regions on Earth.” (https://orca.cf.ac.uk/109233/1/2018mikisadphd.pdf) Another mention of “climatically sensitive”, with no explanation of its meaning, nor reasoning why this region should be more “climatically sensitive” than any other. Within the same paragraph, it then states: “…indicating large scale natural decadal-scale climate variability at that location…” which does suggest that the region may not be as “climatically sensitive” as originally claimed.
The only paper which contains some rationale is the one on the Tibetan Plateau, when it states: “…the understanding of the local/regional characteristics of summer temperature fluctuations on a long-term scale in some regions is still limited. To improve our understanding in these aspects, more local or regional summer temperature reconstructions extending back over several centuries are required.” (https://www.sciencedirect.com/science/article/pii/S0921818117303235) No conclusions reached, other than what might be being indicated, with the obvious claim that more research is needed (i.e. a plea for more funding; whether it – or any of the raft of climate change studies – truly merits it is a point for further discussion).
[…] What their charts clearly show is that “nothing climatically unusual is happening.” […]
[…] What their charts clearly show is that “nothing climatically unusual is happening.” […]
[…] What their charts clearly show is that “nothing climatically unusual is happening.” […]
Your dates are wrong, e.g. N. America has data going back to AD360. The Hockey Stick was a multiproxy N Hemisphere reconstruction – and Mann 2009 pointed out that yes, there were regions, eg Greenland and Europe that have been warmer in the past. But not at the same time.
Each of the continental reconstructions has at least some data going back to 1000AD. If there were a globally or even hemispherical, synchronous MWP, it would show up.
But there wasn’t.
[…] What their charts clearly show is that “nothing climatically unusual is happening.” […]
Pollen only, not multiproxy like the others. The anomaly record for North America starts in 1200, or after the Medieval Warm Period:
https://science2017.globalchange.gov/img/figure/figure1_9.png
Notice in the graph above (2013) that only 2 of the 7 regions resemble a hockey stick shape: Asia and Australasia. The Arctic, upon correction of “several errors” a year later, showed the Medieval Warm Period and most of the 1st millennium as warm or warmer than the late 20th century.
And, again, only 3 regions of the Earth comprehensively encompass most of the 1st millennium in this “global” 2,000-year reconstruction: the Arctic, Europe, and Antarctica. And all 3 had warmer temperatures during the Medieval Warm Period (and much of the 1st millennium).
Yes, Mann had to admit ten years later that his original hockey stick — in which he extrapolated the temperature for the entire N. Hemisphere from a few trees in N. America — was wrong.
PAGES 2K (2013): “The period from around ad 830 to 1100 generally encompassed a sustained warm interval in all four Northern Hemisphere regions.”
You do realize that modern warming has not been globally synchronous. Right? The Arctic, and Greenland, cooled (by -1.5 C) between the 1940s and 1990s. East Antarctica has been cooling since the 1960s. West Antarctica has been cooling dramatically since 1999. The U.S. has been cooling overall since the 1950s. Most of the Pacific cooled between the 1970s and 2000s. The Southern Ocean has been cooling since 1979. The North Atlantic has been cooling dramatically since 2005.
433 non-corrupted temperature stations from across the globe reveal that there has been no net warming since the 1930s and 1940s during the 1900-2010 period.
https://notrickszone.com/wp-content/uploads/2018/03/Holocene-Cooling-Global-Temperatures-1900-2010-Lansner-and-Pepke-Pederson-2018.jpg
All of this is backed up by peer-reviewed scientific papers. The hockey stick has not been “confirmed”.
It doesn’t look like that in the graph you post and not in the revised graph someone else posted above:
https://climateaudit.files.wordpress.com/2014/10/arctic2k-revised1.png
Why do you name them “non-corrupted”? They are just shielded from the influence of Oceans and aren’t you the one who says the Oceans make the climate?
Are you sure that the science you quote from has the same weight as science that confirms AGW?
Sure it has. But feel free to post proxy records ending in the 60s or 90s or even claiming that there was a “decline” where non is visible in the instrumental record (not even in your “non-corrupt” graph).
ZERO-Science seb yaps mindlessly, yet again.
No net warming since the 1930s,40s
GET OVER IT.
Oft stated, always true, ‘The Big Con’ of ‘consensus scientivism’ also known as ‘settled politics’.
“More cherries.”Give me a specific location and a short time series and you could get almost any trend. Over a large area and over longer time I’m sure Greenland is warming,” writes Tjernström, ”
http://sciencenordic.com/greenland%E2%80%99s-recent-temperature-drop-does-not-disprove-global-warming
But that is exactly the point. To get your cherrypicked cooling trends, you have to select a *different* time period for each region. Besides which:
“The U.S. has been cooling overall since the 1950s. ”
Oh Really?”U.S. average temperature has increased by 1.3°F to 1.9°F since record keeping began in 1895; most of this increase has occurred since about 1970. The most recent decade was the nation’s warmest on record. ”
From
“The U.S. has been cooling overall since the 1950s. ”
Yes.
New Paper: 1,407 Contiguous U.S. Temperature Stations Reveal NO WARMING TREND During 1901-2015
1,407 temperature stations from across the U.S.: Partridge et al., 2018
Eastern U.S. cooling since the 1950s: Partridge et al., 2018
Rural U.S. Temperatures: Soon et al., 2015
236 U.S. Temp stations: Lansner and Pepke Petersen, 2018 (bottom graph)
The chief cherry picker at work again 😉
Tmax, Tmin? Warminghole? I am sure you will come up with a very good explanation what that has to do with the average U.S. temperature and why it shows that the U.S. has been cooling?
Soon, rural and unadjusted … need more words that should make a skeptic become very skeptic about someone posting such a graph and say it has been cooling since the 1950s? And even that graph shows warming …
OAS is not the entire U.S. …
I am guessing you are once again trying to show that it is not warming (or in your imagination cooling) in some locations. And thus “has not been cooling overall” in the sense of “everywhere” is not true, but in the sense of “on average” it is.
Yes we know you would rather use GARBAGE data from badly sited, urban/airport affected garbage sites with massive amounts of “estimated” data (approaching 50% in the US, and almost certainly higher elsewhere)
There is ZERO WARMING in the satellite era apart from Ocean/El Nino effects.
ONLY those places affected by those El Ninos and ocean effects show any warming.
DATA shows that many places HAVE NOT warmed and some are COOLING.. (seb hates real data)
El Ninos have ZERO link to human anything, especially not to human produced CO2.
Those are the FACTS that you continually IGNORE.
Some day you will maybe try to explain how an El Nino causes a lasting temperature increase and the next one adds upon that increase, and so on …
How does that mechansism work exactly, AndyG55?
Similar to your “the atmosphere gets constantly compressed and therefor that’s the cause of the higher than expected surface temperature” theory maybe? 😉
Poor seb, admitting his IGNORANCE, and still REFUSING to even attempt learn.
It has been explained to you before, and you dismissed that chance to actually learn something.
How petulant of you, seb.
Its called WILFUL IGNORANCE.
Surface temperature is pretty much exactly what you would expect from the gravity/thermal gradient effect, it is NOT higher than expected.
https://nca2014.globalchange.gov/report/our-changing-climate/recent-us-temperature-trends
And nearly ALL of that US temperature change since has come from “Adjustments” to data.
It is NOT REAL. The original REAL data shows 1940’s slightly warmer than now in the US.
https://s19.postimg.org/o1d61lfoz/Ncdc_measured.jpg
And do you really think temperatures should be the same now as during the LIA, the COLDEST period in 10,000 years.
Is that REALLY what you think is “normal” ?????
Do you think you can compare the temperatures measured over time to each other without adjustments?
You seem to be under the impression that the past was adjusted downward to become cooler, right? What if someone told you that the past was adjusted upwards?
Not the U.S., but this is how the NOAA adjustments compare to the raw data: https://imgur.com/a/r63eI
Yes we know how much data is “adjusted” and the overall effect is always driven by the AGW Agenda.
NOAA doesn’t use “raw” data, btw.
Your ignorance is showing, yet again.
[…] What their charts clearly show is that “nothing climatically unusual is happening.” […]
Sheesh, the urge to cherry-pick is irresistible, huh? Even Anthony Watts accepts US warming. Here’s a graph based on ALL the stations:
http://www.noaanews.noaa.gov/stories2009/images/1208natltemp.png
Unadjusted data begs to differ.
https://realclimatescience.com/2018/03/noaa-data-tampering-approaching-2-5-degrees/
What is unadjusted data, yonason? Why do you believe it’s better to use the raw data?
Besides:
https://imgur.com/a/r63eI
Additionally info on the importance of raw data. Adjustments to raw data after the fact are rationalizations of why that data didn’t agree with the investigators’ biases, and are calculations to bring said data into line with those biases, not with any underlying reality.
“Uncertainty in data leads to uncertainty in calculated results
• Uncertainty never decreases with calculations, only with better observations.
https://www.engr.colostate.edu/CBE101/_downloads/error_analysis_i.pdf
See also here.
https://chem.libretexts.org/Core/Analytical_Chemistry/Quantifying_Nature/Significant_Digits/Propagation_of_Error
I repeat.
UNCERTAINTY NEVER DECREASES WITH CALCULATIONS, ONLY WITH BETTER OBSERVATIONS.
And you wonder why people call you guys conspiracy theorists? 😉
So glad to see that seb accepts the collusion and data manipulation for what it is.
No-one else here mentioned conspiracy.
But seb recognises it, because he was part of it.
Do you DENY that the adjustments invariably end up getting rid of “inconvenient” facts that destroy the AGW fallacy. !
Are you REALLY that wilfully blind !
“Uncertainty in data leads to uncertainty in calculated results
• Uncertainty never decreases with calculations, only with better observations”
Or, as others have said elsewhere, “If you are allowed to cherry-pick your data, you can prove almost anything, but if you are allowed to make it up (as NOAA and NASA do), you can prove anything at all.”
Apparently it’s true that cherry-picking = 1,407 temperature stations across the contiguous U.S. that don’t show any clear warming trend between 1901-2015 (Partridge et al., 2018).
As for North America in general, which you seem to be hung up on, here are 10 non-hockey stick reconstructions from across North America that all show that nothing unusual is happening today that hasn’t occurred in recent centuries to millennia. Let me know if you need more examples.
–
North America (Gennaretti et al., 2014)
https://notrickszone.com/wp-content/uploads/2017/06/Holocene-Cooling-North-America-Gennaretti-2014.jpg
–
Canadian Arctic (Fortin et al., 2016)
“…in the last 150 yr, the reconstructed temperatures do not indicate a warming during this time.”
https://notrickszone.com/wp-content/uploads/2016/12/Holocene-Cooling-Canadian-Arctic-Fortin-16-copy.jpg
–
Northern Quebec (Gennaretti et al., 2017)
https://notrickszone.com/wp-content/uploads/2017/06/Holocene-Cooling-Quebec-Northern-997-to-2006-Gennaretti-2017.jpg
–
Canada (Naulier et al., 2015)
https://notrickszone.com/wp-content/uploads/2017/06/Holocene-Cooling-Canada-Naulier-15-Edit.jpg
–
Gulf of Alaska (Wilson et al., 2017)
https://notrickszone.com/wp-content/uploads/2017/03/Holocene-Cooling-Alaska-Gulf-North-Pacific-Wilson-17.jpg
–
Central U.S. (Alter et al., 2017)
https://notrickszone.com/wp-content/uploads/2017/12/Holocene-Cooling-United-States-Central-Alter-2017.jpg
–
Florida SSTs (Flannery et al., 2017)
https://notrickszone.com/wp-content/uploads/2017/01/Holocene-Cooling-Florida-U.S.-SSTs-Flannery-17.jpg
–
Canada (B.C.) (Pitman and Smith, 2012)
https://notrickszone.com/wp-content/uploads/2017/06/Holocene-Cooling-Canada-British-Columbia-Pitman-Smith-2012.jpg
–
Canadian Rockies, Alaska, Chesapeake Bay (Ljungqvist, 2010)
https://notrickszone.com/wp-content/uploads/2017/06/Holocene-Cooling-NH-Canadian-Rockies-Alaska-Chesapeake-Bay.jpg
–
NE Canada (Renssen et al., 2009)
https://notrickszone.com/wp-content/uploads/2017/06/Holocene-Cooling-Canada-Eastern-Renssen-09.jpg
I give a dataset with measurements over time that will show the same min/max for the whole period, but will have a very variable average/mean value. Interested?
Would you then also conclude that the dataset shows no clear trend because min and max values don’t show a trend?
Are you going to FABRICATE something yet again, seb ??
Get BEST or NOAA to help you. !
http://rankexploits.com/musings/2014/how-not-to-calculate-temperature/
http://www.politifact.com/punditfact/statements/2014/jun/25/steve-doocy/foxs-doocy-nasa-fudged-data-make-case-global-warmi/
“Apparently it’s true that cherry-picking = 1,407 temperature stations across the contiguous U.S. that don’t show any clear warming trend between 1901-2015 (Partridge et al., 2018).”
There are over 7,000 stations in the US Cooperative Observer (Coop) Network Program. How was this subset selected?
The US Historical Climatology Network consists stations chosen for their spatial coverage, record length, data completeness, and historical stability, it shows a strong warming trend (1973-2012) of +0.245 C/decade. The more recent reference network of stations confirms the HCN.
So any US network that shows no warming has some explaining to do. Are you up to it?
Almost 10000 stations according to Berkeley: http://berkeleyearth.lbl.gov/regions/contiguous-united-states
nearly 50% of Best stations are less than 20 years in length.
Most of their data is HIGHLY DUBIOUS in quality.
Its like wind and solar.. IRREGULAR, UNRELIABLE and basically just a load of GARBAGE.
Anything they CREATE from their GARBAGE DATA, will be exactly the GARBAGE they want to fabricate.
10K?
Easy enough to produce any trend you want by eliminating >80% then.
Lots of Canada, there, huh? The two Genneratti studies do indeed find the Taiga to have been of a similar temperatures in medieval times as recent, but the second is clear…
“These findings are consistent with the fact that the MCA and the LIA were not necessarily synchronous everywhere in the World, and their intensity also varied spatially”
Yes. 2/3rds of North America’s land area is above the contiguous U.S. Here are a few more non-hockey sticks from the U.S., though, in case you didn’t get enough. I also have many more non-hockey sticks from Alaska if you’re interested.
Central U.S.
https://notrickszone.com/wp-content/uploads/2017/12/Holocene-Cooling-United-States-Central-Alter-2017.jpg
–
Pacific Northwest
https://notrickszone.com/wp-content/uploads/2017/01/Holocene-Cooling-Pacific-Northwest-US-Steinman-16.jpg
–
American Southwest
https://notrickszone.com/wp-content/uploads/2017/12/Holocene-Cooling-American-Southwest-Temperatures-Loisel-2017-copy.jpg
–
Appalachian Mountains Cooling 1900-2017
https://notrickszone.com/wp-content/uploads/2018/02/Holocene-Cooling-Appalachian-Mountains-1-Eck-2018.jpg
https://notrickszone.com/wp-content/uploads/2018/02/Holocene-Cooling-Appalachian-Mountains-3-Eck-2018.jpg
–
Southeastern U.S. Cooling
https://notrickszone.com/wp-content/uploads/2017/01/Holocene-Cooling-Southeastern-US-Rogers-13.jpg
–
Yes, Phillip, the warming wasn’t “synchronous everywhere in the World”. Neither is today’s. Do I need to give you the run-down again?
So why did you decide to cherry-pick 1973 – the coldest year – as your starting point? Of course, it’s because you can then just ignore the 1920-1950 warm period.
If we want to look at temperature stations in the U.S. that are not corrupted by artificial/non-climatic heating via urbanization/asphalt, buildings, etc., we need to look at long-term, inland rural stations. That’s because the artificial heating can substantially affect the instruments.
—
https://link.springer.com/article/10.1007%2FBF00140159?LI=true
“Karl et al., 1988) has shown that at some ‘sun belt’ cities in the West, the rise of temperature that can be attributed to the urban heat island is as much as 0.3 to 0.4°C per decade. In the East, the rise is over 0.1°C per decade. … The artificial warming in the primary station network, relative to the climate division data, is nearly 0.17°C over the past 34 years [since ~1950]. Such trends are at least as large as any of the observed trends over the United States (Karl, 1988) or the globe (Jones and Wigley, 1987).”
—
http://journals.ametsoc.org/doi/pdf/10.1175/1520-0450(1986)025%3C1265%3AUW%3E2.0.CO%3B2
“The average annual difference of the trends is about +0.11°C per decade [of non-climatic warming due to urban location]. … The average difference between trends [urban station siting vs. rural station siting] amounts to an annual warming rate of 0.34°C/decade.”
—
There were still between 5,000 and 6,000 weather stations across the globe contributing to the GHCN temperature archive as recently as the 1970s. Today (or as of 2009), there are only a little over 1,000 left — 75% of the thermometers used in the 1970s have disappeared, mostly from rural/non-urban locations. There are now fewer weather stations contributing to the GHCN than there were in 1919.
In the U.S., there was a precipitous drop (92%!) in the number of (mostly rural) temperature stations contributing to the Network after the 1980s. The urban stations were allowed to remain, which has caused an artificial warming bias.
When looking at only rural U.S. stations that have not been corrupted by urban siting and airport siting, the temperature trends show an oscillatory shape, with warming in the 1920s to 1950s similar to the warming during the 1990s and 2000s…
Soon et al., 2015 – U.S. Rural Temperatures
Can I assume you prefer to have temperature trends reported that (a) start in the 1970s and that (b) include stations sited near buildings, asphalt, on black roofs, machines, and on the grounds of airports? Of course that’s what you prefer.
Because most of those don’t begin in the early 20th century. As the paper indicates:
“We select only stations in the contiguous U.S. that have an 80% complete record from 1901-2015, resulting in 1407 temperature stations.”
Do you see a clear warming trend here in these trend lines for 1901-2015?
Partridge et al., 2018 – U.S. Temperatures, 1901-2015
Why this obsession with the Tmax and Tmin values?
Why the IGNORANCE of data, seb?
Your only choice to maintaining your rancid, baseless, brain-hosed AGW cult-like belief, correct !.
[…] What their charts clearly show is that “nothing climatically unusual is happening.” […]
You did not answer the question.
How were the 1,407 US Stations that show no warming selected from the larger dataset of 7,000 (Coop) or 10,000 (BEST)?
And why are these stations more significant than those complete datasets, which show unequivocal warming?
Looking forward to hearing from you.
Fabrication of missing data, HUGE urban effects.
Up to 50% of the US data is “estimated”.
Most of the data used by BEST is total and utter garbage, that they kludge together in an Agenda driven mess, not fit for any purpose except blatant propaganda for the standard mindless AGW twerps to “believe” in.
I thought this would be clear from the quote cited in the Geophysical Research Letters paper. The 1,407 stations used in Partridge et al. (2018) all have >80% continuous and complete records spanning back to 1901. In other words, they don’t have missing periods, they weren’t re-sited to an urban location, etc. The other 1,000s of stations do have missing data, have been relocated, or were only installed in recent decades. The authors did not select stations based on whether they showed cooling or warming. They selected based on the record’s length and continuity. Is this still unclear?
“We select only stations in the contiguous U.S. that have an 80% complete record from 1901-2015, resulting in 1407 temperature stations.”
Why did you choose to report a trend that starts in the year 1972, Phillip? Why did you cherry-pick that particular year?
Why are you so hung up on U.S. temperatures, anyway? Especially since scientists’ reconstructions consistently show that modern temperatures don’t even come close to falling outside the range of natural variability…with Holocene temperatures much warmer?
I’m curious if you can explain this…
Back in 1984, or before all the adjustments to the U.S. data to transform cooling into warming, there was a multiple-degrees C cooling trend in the state of Indiana from the much-warmer 1930s-1950s to the much-colder 1960s-1970s:
https://notrickszone.com/wp-content/uploads/2017/01/NOAA-Data-Manipulation-Indiana-Karl-1984.jpg
Today, that substantial cooling has been removed by NOAA:
https://notrickszone.com/wp-content/uploads/2017/01/NOAA-Data-Manipulation-Indiana-2017-Annual.jpg
What do you think the reason is that the substantial post-1950s cooling was removed?
For that matter, as of 1987, NASA showed a global-scale warming of +0.5 C from 1880 to 1950:
https://notrickszone.com/wp-content/uploads/2018/03/NASA-GISS-Global-Temperatures-1987.jpg
Today, that +0.5 C of 1880-1950 warming has been removed:
https://notrickszone.com/wp-content/uploads/2018/03/NASA-GISS-Global-Temperatures-2018-Trend.jpg
Why do you think NASA has removed a half a degree of warming from the pre-1950 period?
And why do you think it is that the global temperature data set overseers make “completely artificial adjustments” to the data to “hide” the decline in temperatures?
CRU e-mails:
“Also we have applied a completely artificial adjustment to the data after 1960, so they look closer to observed temperatures than the tree-ring data actually were” …. “Also, we set all post-1960 values to missing in the MXD data set (due to decline), and the method will infill these, estimating them from the real temperatures – another way of ‘correcting’ for the decline, though may be not defensible!”
[…] What their charts clearly show is that “nothing climatically unusual is happening.” […]
So a casual visitor here will discover that a network of US sites have a flat trend, that the PAGES 2K study found medieval temperatures in Europe similar to today, there are proxy studies around the world that contradict the ‘hockey stick’ picture of the last 2,000 years of global temperature. Also that climate scientists added a totally artificial adjustment to the temperature record.
They will not discover that the full US network, the HCN subset chosen by the NOAA, a new reference network and the satellites all show strong warming in the US. They will not find out that the PAGES 2K project, for the globe as a whole, taken globally, gives a curve that looks very much like a piece of sporting kit.
https://i1.wp.com/www.skeptical-science.com/wp-content/uploads/2017/07/T_comp_61-90.pdf.jpg
A strong warming relative to what year, Phil? Are you cherry-picking 1972 as your starting point again? Why are you refusing to answer why you carefully selected that particular year as the starting point for the U.S. temperature trend? Didn’t you start off your criticism here by accusing others of cherry-picking?
Again, the PAGES 2k project “for the globe as a whole” only includes 3 regions of the globe’s land mass (Arctic, Antarctic, Europe) that extends from 0 to 2000 AD. (Actually, Antarctica starts in 167 AD, but close enough.) None of the oceans are covered, which means that 72% of “the globe as a whole” is excluded.
Of those 3 regions that cover nearly all of the 1st millennium, all 3 show that the 1st millennium had as warm or warmer periods than recent decades. The authors embarrassingly had to issue a corrigendum due to the several errors in their Arctic reconstruction (pointed out by Steve McIntyre on his blog, ClimateAudit) that blatantly made the past cooler and the modern temperatures warmer. After correction, the authors had to admit that the 1st millennium had warmer temperatures in the Arctic than modern — and the first half of the 20th century was warmer than the 2nd half.
Arctic correction paper: https://www.nature.com/articles/sdata201426#f2
Corrigendum paper: https://www.nature.com/articles/ngeo2566
The corrected continental PAGES 2k “global” reconstruction (from 2015) have data points that look different than the one from the SkepticalScience blog’s version (which you obviously prefer):
PAGES 2k “Global” Reconstruction (2015)
Notice that the 20th century is merely a return to the 1st millennium’s average “global” temperature (which includes all 7 regions). The exceptional period is not the “hockey stick” at the end. It’s the 1350-1920 cold period. There is nothing about modern temperatures that falls outside the range of natural variability.
In fact, PAGES 2k has the same temperature signature for the Arctic: https://notrickszone.com/wp-content/uploads/2018/03/Holocene-Cooling-Arctic-PAGES-2k-2014.jpg
PAGES 2k has a continued cooling trend for Antarctica (it’s colder now than at any time in the last 2000 years): https://notrickszone.com/wp-content/uploads/2018/03/Holocene-Cooling-Antarctica-PAGES-2K.jpg
What do you think the forcing was that caused the 500-600 years of colder temperatures after the 1300s and through the early 1900s? CO2 didn’t decline. So what was the causal mechanism?
“why you carefully selected that particular year”
It was just before start of a strong El Nino that occurred just before the satellite data.
Just like using the 1998 and 2015 El Ninos in the satellite data to say there is a trend.
Cherry-picking for baseless propaganda.
But El Ninos and ocean cycles, which have been the cause of the ONLY warming since the trough of the AMO, are ABSOLUTELY NOTHING to do with anthropogenic anything.
They are CERTAINLY not caused by enhance atmospheric CO2.
But the AGW scammers HAVE to use those El Ninos…
…. because there is NO OTHER WARMING
Question: since you seem to be convinced that the current temperature increase is totally normal – despite the reason for the increase being different than in any other period of Earth’s history – do you expect the temperatures to flat out now? Or do you expect them to decrease as all the other skeptics constantly declaring cooling due to a weak Sun?
Or do you deep down know that the temperature will further increase as the heat content increases? What will be your argument in another 30 years then? Still no enough warming? Still claiming the temperature record is fake? What’s your out in that situation?
“do you expect the temperatures to flat out now”
They have been flat for the whole of the satellite era apart from 2 large El Nino events.
Neither of these had ANYTHING to do with atmospheric CO2
They were PURELY NATURAL, driven by a build up of solar energy through the period of the strongest period of solar activity since the MWP.
Be VERY THANKFUL that we are out of that COLDEST period in 10,000 years into a modern SLIGHTLY warm period. Also be VERY thankful for the slight increase in atmospheric CO2 that allow us to come at least some way to feeding the world.
And DO NOT FRET, the world’s CO2 emissions will continue to climb for MANY, MANY years to come, and there is NOTHING your feeble religion can do about it. 🙂
How’s the fossil fuel heating going, seb.. still got it pumping out warmth ?
“a new reference network and the satellites all show strong warming in the US”
That is INCORRECT or a BLATANT LIE (you choose which)
Before the recent El Nino, USCRN had a ZERO TREND.
As did UAH USA 48 and RSS-ContUSA over that period.
UAH USA shows minimal warming over the satellite era before the 2015 El Nino.
https://s19.postimg.org/ix2iyjgn7/UAH_USA48.png
The temperature in all 3 sets of data has now dropped down pretty much to the zero trend level pre- El Nino..
There is ZERO anthropogenic warming signal in ANY respectable data set.
A short test post as others are not getting through.
A short test post.
As others are not getting through.
“4.3. Artificial removal of the recent decline in tree-ring density.
[…] To overcome these problems, the decline is artificially removed from the calibrated tree-ring density series, for the purpose of making a final calibration. The removal is only temporary, because the final calibration is then applied to the unadjusted data set (i.e., without the decline artificially removed).
from ‘Annually resolved patterns of summer temperature over the Northern Hemisphere since AD 1400 from a tree- ring-density network.’
Those sneaky climate scientists huh? Adding an ‘artificial adjustment’ (to tree-ring data) to hide the decline, then underhandedly DESCRIBING IT IN A PUBLISHED PAPER.
Re; PAGES 2K From that very Corrigendum “No major conclusions have been affected by the corrections made to the Arctic data set including the conclusion that, during the period AD 1971–2000, the area-weighted average reconstructed temperature among regions was higher than any other time in nearly 1,400 years.”
The PAGES 2K 2015 chart ends in 2000, and shows a maximum anomaly of less than 0.2C. Since then we have experienced another 0.32C of warming. Which looks like this:
https://pbs.twimg.com/media/DWkJ5AFWsAAPvHO.jpg
“Secondly, my dataset only starts in 1973 because that’s the first year with reasonably complete coverage of the U.S. with the hourly observation sites (not the cooperative observer sites which dominate the USHCN dataset which are more numerous but report daily max and min temperatures).”
– Dr Roy Spencer.
The source of the Spencer quote.
http://www.drroyspencer.com/2014/01/u-s-temperatures-1973-2013-a-alternative-view/
…where he also writes…
“Clearly, adjustments to surface temperature data are at least as large as the global warming signal being sought. Until a transparent analysis of the USHCN methodology is carried out, and alternative methods and temperature datasets are tested, I can’t bring myself to believe any U.S. government pronouncements regarding record warm temperatures.”
…and note his intro, as well, where he supports Tony Heller’s contention that there IS a problem.
“Steve Goddard recently posted some results from his analysis of the official U.S. surface temperatures (USHCN, from NOAA) suggesting spurious warming occurring around 1998. I also showed evidence of this back in 2012.”
So, basically, the Spencer quote is from a post of his that totally undercuts all your assertions. Thanks, Phil, for clearly showing us you are just another activist troll.
Which is why he failed to include the link to that quote. It’s like clockwork the way these people work.
My original question to Philip was why he chose to report on a warming trend in the U.S. by beginning in 1972 — one of the coldest years — rather than reporting on the entire 1900-present trend (that reveals a warming period during the 1920-’50 decades that rivals/exceeds recent decades). He chose not to defend his cherry-pick, but to instead pull a link-less quote from Dr. Spencer who discusses spurious warming added in recent decades. So amusing, these people.
“It’s like clockwork the way these people work.”
Sooo predictable.
This is from commenter Mark Fife over at Tony Heller’s blog.
https://realclimatescience.com/wp-content/uploads/2018/03/86873-1.jpg
It’s pretty clear why they chose the early seventies as their starting point.
He was commenting to this post.
https://realclimatescience.com/2018/03/rapid-growth-of-arctic-sea-ice-continues/
Poor little moppet still hasn’t figured out that Pages2K was SPECIFICALLY set up to as a propaganda unit attempting to support the FAKERY of Mann.
Another of my comments disappears. Hopefully Pierre can retrieve it. Thx in advance.
Hmm. Why “nearly 1,400” years? Because it was warmer, on average, from 0-700 AD than it was during the late 20th century in the 3 regions where the “global” temperatures were measured for that period in the 1st millennium: the Arctic, Europe, and Antarctica.
Considering the modern era is just a return to the “normal” levels of the first 1350 years of the last 2 millennia, making the cold period the exception rather than the last few decades, what was the causal mechanism for the 1350-1900 drop in “global” temperature, Philip? What forced that exceptional era?
PAGES 2k “Global” Temperatures 0-2000 AD
Why has Antarctica not warmed, but continued cooling (look at that year-2000 anomaly that’s off the charts!) according to PAGES 2k and others (Mayewski et al., 2017)? Why isn’t CO2 working there?
And why did all or nearly all of the warming out of the 1350-1900 cold period take place before 1950 in the Arctic, or before CO2 emissions began rapidly rising?
Why does HadCRUT (used in PAGES 2k) have the 1920s to 1940s Arctic as warm as the 2000s-present period, with cooling from the 1940s to 1990s? What caused that Arctic cooling?
Between 2001 and 2015, or between the ENSO events, there was no net warming trend:
http://www.woodfortrees.org/plot/uah6/from:2001/to:2015/plot/uah6/from:2001/to:2015/trend/plot/hadcrut4gl/from:2001/to:2015/plot/hadcrut4gl/from:2001/to:2015/trend
We only get a warming trend if we include the anomalous Super El Nino event of 2015-’16. Can I assume you understand why yearly anomalies are excluded from long-term trends? Do you understand why PAGES 2k uses 30-year periods (the climate-length minimum) rather than 1 or 2 year anomalies?
I can see why you decided to leave out the citation link to that quote, Philip. Spencer is talking about why the USHCN warming adjustments are not to be trusted…on his blog!
https://www.goodreads.com/author_blog_posts/5621761-u-s-temperatures-1973-2013-a-alternative-view
“Clearly, adjustments to surface temperature data are at least as large as the global warming signal being sought. Until a transparent analysis of the USHCN methodology is carried out, and alternative methods and temperature datasets are tested, I can’t bring myself to believe any U.S. government pronouncements regarding record warm temperatures.”
OK, good. At least if mine doesn’t get posted, your drawing attention to the context of his Spencer quote is what I was addressing.
I see, now the warm periods of the past are the normal and the way we reached those temperature levels is to be ignored since it surely will stop at that level and not continue to warm, right? So what will you call the current temperature in 30 or 50 years? Still normal?
“So what will you call the current temperature in 30 or 50 years? Still normal?”
They will still be well within the “normal” range.
The current period could be apt described as “the Modern SLIGHTLY Warm Period”
And it is a FAR better period to live in than the cold spiteful period of the LIA which AGW morons think was the norm.
What “should” the world temperature be, seb ?
Which is better for ALL LIFE on this carbon based planet, seb?
The somewhat colder than now period of the LIA ?
or the somewhat warmer than now period of the MWP ?
Why do you still not know how the CO2 effect works? What happens when the stratosphere is at the same or higher temperature than the surface? Do you know how to calculate the GHE for such a region? If yes, why then ask that question?
Why would you exclude El Nino events? Will you exclude La Nina events as well? Or the seasonal variations because they are natural?
Just use heat content and you don’t have to deal with the variations of the surface temperature due to varying release cycles from that big blob of water covering 70% of the surface.
Why do you assume that posting a quote from someone you don’t neccessarily agree with on other points is not possible?
You are doing that all the time? Every time you post a quote from a paper that you feel supports your view of the world you are then automatically agreeing with everything else the authors write? Is that so?
“Why do you still not know how the CO2 effect works”
It does NOTHING except enhance plant growth.
You have PROVEN that with your abject inability to provide even one bit of empirical evidence to support the “warming” fallacy.
“Why would you exclude El Nino events?”
Are we looking for CO2 warming,
… or purely Natural solar warming ??
Nobody except you DENIES that El Ninos are atmospheric warming events that occur naturally due to build up of solar energy.
Original ARGO data
https://s19.postimg.org/7h5rb639f/ARGO_NH.png
Then after some minor “adjustments” (doesn’t match the models yet.)
https://s19.postimg.org/md4aj0u6b/argo_v_models.png
OHC is not going anywhere since they started actually measuring it, rather than “modelling” it with assumption driven models..
Until they start with the “adjustments” yet again ! 😉
“Between 2001 and 2015, or between the ENSO events, there was no net warming trend:”
So you exclude 2016 El Nino, but include 2010/11 La Nina. Blatent cherry-pick alert.
http://www.woodfortrees.org/plot/hadcrut4gl/from:2000/plot/hadcrut4gl/from:2000/trend
The Spencer quote was to explain the choice of start year, nothing more. Zeke Hausfather has shown that the Heller allegations about all the warming to be due to adjustments to be baseless, heck, globally, the adjustments act to *reduce* the trend.
Just noise to detract from the main points: the 2015 revision to PAGES 2K did not affect the conclusions of anomalous global modern warmth, mirroring the Mann Hockey Stick, and the warming since 2000, the end point for the project, torpedoes any claim that PAGES 2K proves modern temperatures are not anomalous. And then some.
The 20th century is merely a return to the Late Holocene normal, albeit somewhat cooler:
https://notrickszone.com/wp-content/uploads/2018/03/Holocene-Cooling-Global-PAGES-2k-1350-1920-Exception.jpg
I’ll ask again: Why do you think PAGES 2k uses 30-year bins? Would it not be due to the tendencies for 1-2 year warming/cooling anomalies to skew the results? That’s why they stopped in 2000. The next bin will be 2001-2030. Many scientists are predicting global cooling will commence in the 2020s, which would mean that the late 20th century/early 21st century warming will be just another Late Holocene blip.
You mean like those who predicted cooling in 2007/2008? Those who even took bets that it wont warm for 10 years and even cool? Want to guess how skeptics precious UAH 6.0 did in that timeframe? What was the per decade warming between January 2008 and December 2017? 0.6C!!!
“Many”? More like “a few”.
seb STILL doesn’t recognise an El Nino transient.
WILFUL IGNORANCE can only carry you so far, seb.
February 2018 was 8th warmest February in UAH and 12th warmest in RSS.
“but include 2010/11 La Nina”
That was a pairing that provided ZERO change to temperature. Look at the temperature data and stop being a brain-hosed eco-lite
Facts are Facts,
No warming from 1980 to 1997
No warming from 2001 to 2015
GET OVER IT !!
Horsefather hasn’t shown ANYTHING except an ability to twist statistics to fool AGW brain-washed sympathisers.
“Why do you think PAGES 2k uses 30-year bins”
Because it allows then to choose the part of the major ocean cycle they want to use for their anti-science agenda.
They stop in 2000 because it allows them to use both the 1977/8 and the 1998 El Ninos to show a trend.
It really is a monumental cherry pick.
I don’t know why people are still pushing the Mann hockey stick, since it’s long been know it is nonsense.
I REPOST AGAIN
https://m.youtube.com/watch?v=cecmvYq_91A
John Michael Crichton (/ˈkraɪtən/; October 23, 1942 – November 4, 2008) was an American author, screenwriter, film director and producer best known for his work in the science fiction, thriller, and medical fiction genres.
-Wikipedia
Maybe that is why he likes the M&M comedy reconstruction.
Trying to ad-hom the messenger while saying NOTHING to counter the message.
Standard AGW tactic.
Mann’s data, procedures were PROVEN to be non-science.
“Phony, shocker.. such SLOPPY work.”
No longer used by the IPCC.
Ehm, AndyG55 … would you recognize yourself in a mirror? That’s what you do all the time and now you call it a “standard AGW tactic”? Just wow …
Poor seb, thinks his mindless EMPTY yapping has a point.
Bring SCIENCE to back up your brain-hosed fantasies , seb..
… or just remain EMPTY.
Wikipedia???!!
Seriously???????!!!!!!!
http://www.spiked-online.com/newsite/article/wikipedia-where-truth-dies-online/14963#.WrvrVjw8LYU
See here for one actual illustration.
https://farm4.static.flickr.com/3572/3513065356_26d4f59e37.jpg
When chatbots can’t deal with the facts, they hurl Ad Homs at them.
Now, Wikipedia aside, what are the facts?
“Crichton graduated summa cum laude from Harvard College, received his MD from Harvard Medical School, and was a postdoctoral fellow at the Salk Institute for Biological Studies, researching public policy with Jacob Bronowski. He taught courses in anthropology at Cambridge University and writing at MIT.”
http://www.michaelcrichton.com/biography/
PS – Everything Crichton said about the Mann hockey stick in the video I linked to was true, which is why the new (or retooled?) chatbot had to attack him personally.
Oops, lost another.
Let me know if I need to repost,
Thx
I liked a lot of Chrichton’s sci-fi, but for non-fiction he really should have stuck to medicine
https://www.aps.org/publications/apsnews/200604/viewpoint.cfm
Can you counter one thing that was said in the video..
.. or are you just going to keep the ad-hom mud-slinging. ?
Can you counter anything in the video?
Or are you just going to keep slinging ad-homs.
oops.. sorry for the re-post.
I thought the other post had disappeared
What is the provenance of that ‘PAGES 2k’ chart?I ask because Julien Emile-Geay, who was lead author of a 2017 update to PAGES 2K has released his own global composite, and it does not really support the proposal that ‘The 20th century is merely a return to the Late Holocene normal, albeit somewhat cooler’. In fact it’s um, a hockey stick.
http://www.unibe.ch/unibe/portal/content/e796/e803/e59463/e805/e514040/e514043/e582089/media_service582098/2k-temp-hockey-stick-fig_ger.jpg
From this article
http://www.unibe.ch/aktuell/medien/media_relations/medienmitteilungen/2017/medienmitteilungen_2017/umfassendste_datenbank_zu_klimawandel_in_der_vergangenheit_ist_online/index_ger.html
And here is Julien E-G discussing the 2017 results on his blog
“As a scientist, you have to go where the evidence takes you. You can only be smacked in the face by evidence so many times and not see some kind of pattern. (you will never guess: a HOCKEY STICK!).
It’s been nearly 20 years since the landmark hockey stick study. Few things about it were perfect, and I’ve had more than a few friendly disagreements with Mike Mann about it and other research questions. But what this latest PAGES 2k compilation shows, is that you get a hockey stick no matter what you do to the data.
The hockey stick is alive and well. There is now so much data supporting this observation that it will take nothing short of a revolution of how we understand all paleoclimate proxies to overturn this pattern. So let me make this prediction: the hockey stick is here to stay. In the coming years and decades, the scientific community will flesh out many more details about the climate of the past 2,000 years, the interactions between temperature and drought, their regional & local expressions, their physical causes, their impact on human civilizations, and many other fascinating research questions. But one thing won’t change: the twentieth century will stick out like a sore thumb. The present rate of warming, and very likely the temperature levels, are exceptional in the past 2,000 years, perhaps even longer.”
https://strangeweather.wordpress.com/2017/07/11/the-hockey-stick-is-alive-long-live-the-hockey-stick/
A link to “Gonzo”
ROFLMAO !!!
You are proving yourself as worthless as any other brain-hosed AGW troll.
Pages2K was specifically set up to “fabricate” support for the massively erroneous Mann farce.
To help people like you maintain their anti-CO2 RAGE !!!
Propaganda for the AGW aco-lites. !!
Below are 400 graphs from all over the world that do not support the hockey stick. They come from peer-reviewed scientific papers, most of them from the last few years. There were 150 published in 2017 alone. Already there are over 50 published in 2018.
Global Non-Warming (400 Graphs)
But you go right on ahead and keep believing. We understand how believers operate.
Takes one to know one …
You don’t even recognize how deep into the conspiracy rabbit hole you have fallen, do you?
Only seb keeps using the word “conspiracy”
First hand knowledge, seb ???
“We understand how believers operate.”
K backs everything he says with copious peer-reviewed links.
seb backs his EMPTY rants with…. EMPTY
Just “Believe”, seb …. (fantasy music)
Just chant the mantra. !!
Science…nah, not so much !!
“The hockey stick is alive and well”
Zombiism is rife in AGW !
A science-fantasy realm, for sure!
Appeal to authority?
But how much “authority” can a discredit scam artist have?
https://instituteforenergyresearch.org/analysis/james-hansens-failed-ultimatums-free-market-anyone/
https://stevengoddard.wordpress.com/spectacularly-poor-climate-science-at-nasa/
Because of his many errors and his data manipulation, Hansen is about as credible as Wikipedia, i.e., he’s not at all.
Proof positive that vegetarianism destroys the brain.
https://m.youtube.com/watch?v=zfbxeAFk8mY
Tales from the hockey schtick crypt.
https://www.rossmckitrick.com/paleoclimatehockey-stick.html
We keep having to repeat this for them, yet it still doesn’t penetrate their belief system. I mean, how many ways are there to say…
https://m.youtube.com/watch?v=MH7KYmGnj40
“Can you counter one thing that was said in the video..”
Easily. He mainly just rehashes McIntyre & McKitrick criticisms that have either been shown to have no merit or some merit but no impact.
Around 3:00 he overlays what looks like the M&M2005 reconstruction with higher 15th C temperatures over the MBH curve. But Wahl & Amman 2007 showed that the M&M reconstruction had simply dropped some proxies and failed validation.
“Similar to MM03, this scenario yields much warmer NH temperatures for the 15th century than both MBH98 and WA, which are also at odds with 15th century temperatures in other empirical reconstructions (see Jones and Mann, 2004). According to our assessment, however, this result does not have climatological meaning because the reconstructions clearly fail validation tests, returning negative RE scores for both calibration and verification (−0.42 and −0.57, respectively, for 1400–1449; −0.65 and −2.71, respectively, for 1450–1499)
indicative of no reconstruction skill”
http://www.rap.ucar.edu/projects/rc4a/millennium/refs/Wahl_ClimChange2007.pdf
Later Chrichton uncritically retails the canard that the MBH alogorithm produces hockey sticks from random data (‘red noise’).
“Lets turn, now, to MM’s claim that the “Hockey Stick” arises simply from the application of non-centered PCA to red noise. Given a large enough “fishing expedition” analysis, it is of course possible to find “Hockey-Stick like” PC series out of red noise. But this is a meaningless exercise. Given a large enough number of analyses, one can of course produce a series that is arbitrarily close to just about any chosen reference series via application of PCA to random red noise. The more meaningful statistical question, however is this one: Given the “null hypothesis” of red noise with the same statistical attributes (i.e., variance and lag-one autocorrelation coefficients) as the actual North American ITRDB series, and applying the MBH98 (non-centered) PCA convention, how likely is one to produce the “Hockey Stick” pattern from chance alone. Precisely that question was addressed by Mann and coworkers in their response to the rejected MM comment through the use of so-called “Monte Carlo” simulations that generate an ensemble of realizations of the random process in question (see here) to determine the “null” eigenvalue spectrum that would be expected from simple red noise with the statistical attributes of the North American ITRDB data. The Monte Carlo experiments were performed for both the MBH98 (non-centered) and MM (centered) PCA conventions. This analysis showed that the “Hockey Stick” pattern is highly significant in comparison with the expectations from random (red) noise for both the MBH98 and MM conventions. In the MBH98 convention, the “Hockey Stick” pattern corresponds to PC#1 , and the variance carried by that pattern (blue circle at x=1: y=0.38) is more than 5 times what would be expected from chance alone under the null hypothesis of red noise (blue curve at x=1: y = 0.07), significant well above the 99% confidence level (the first 2 PCs are statistically significant at the 95% level in this case). For comparison, in the MM convention, the “Hockey Stick” pattern corresponds to PC#4, and the variance carried by that pattern (red ‘+” at x=4: y=0.07) is about 2 times what would be expected from chance alone (red curve at x=4: y=0.035), and still clearly significant (the first 5 PCs are statistically significant at the 95% level in this case). ”
http://www.realclimate.org/index.php/archives/2005/01/on-yet-another-false-claim-by-mcintyre-and-mckitrick/
I suggest you read the notes on page 4 of this
https://www.rossmckitrick.com/uploads/4/8/0/8/4808045/hockey-stick-retrospective.pdf
Maybe start learning something for yourself rather than just spewing baseless propaganda pap. !!
Yeah, I guess it was kind of an appeal to authority, here is another. The American Meteorological Society decided in 2009 decided to bestow upon James Hansen the Carl Gustaff Rossby Medal, its highest honour, for “”outstanding contributions to climate modeling, understanding climate change forcings and sensitivity, and for clear communication of climate science in the public arena”.
Stephen Goddard (real name Tony Heller) used to write for The Register, a UK IT industry comment and gossip website, on climate science until he messed up once to often, and was reduced to writing BS for Anthony Watts. This is the Watts who for years allowed one of his moderators to post under a pseudonym in the debates he was moderating, just to ensure the playing field at WattsUpWithThat could never be level. But even a man with those standards decided Heller was too far out there:
“In case you didn’t know, “Steve Goddard” is a made up name. Supposedly at Heartland ICCC9 he’s going to “out” himself and start using his real name. That should be interesting to watch, I won’t be anywhere near that moment of his.
This, combined with his inability to openly admit to and correct mistakes, is why I booted him from WUWT some years ago, after he refused to admit that his claim about CO2 freezing on the surface of Antarctica couldn’t be possible due to partial pressure of CO2.”
http://rankexploits.com/musings/2014/how-not-to-calculate-temperature/#comment-130003
So a WUWT reject vs a feted scientist. I think I win the ad hom war.
https://www.theregister.co.uk/2008/08/15/goddard_arctic_ice_mystery/
Zzzzzzxxx
M&M’s
https://climateaudit.org/?s=Hockey+stick+&submit=Search
Mmm, yummy.
And also this, from the website that opened my eyes to the climate con-game.
https://www.john-daly.com/hockey/hockey.htm
A website with a rainbow marquee effect should never open anyones eyes, except to the revelation how “webdesign” of the 90s can survive. I suspect another retiree is behind that John-daly.com website?
SebastianH, please refrain from attacking people based on their age. It smacks of bigotry. As do your occasional references to race. Bigotry is not welcome here.
“So a WUWT reject vs a feted scientist”
… or you could look at the actual REAL DATA.
It makes a total MOCKERY of Hansen as any sort of scientist…. just a rabid anti-science activist.
Why he is feted for 100% WRONG predictions, is anyone’s guess.
Must be a religious based thing. !
And real data ABSOLUTELY DESTROYS the AGW farce. !
——
CO2 freezing is a TEMPERTURE thing…. didn’t you know that ??
And it has to be darn cold, which the Antarctic is.
Page 10 of
http://scienceandpublicpolicy.org/images/stories/papers/monckton/monckton_what_hockey_stick.pdf
“In fairly short order, the paper by Ammann and Wahl was rejected by GRL, many of its criticisms
either relating to other McIntyre papers than the one at hand, or relying on the still-unpublished paper
in Climatic Change for their arguments. Since that paper was unpublished, it was effectively
impossible for McIntyre to defend himself against these criticisms. Shortly after Ammann and Wahl’s
paper was rejected, a third attempted rebuttal of McIntyre’s work, this time by David Ritson, a
physicist, was also rejected by the journal’s editors.”
“Wahl and Ammann’s response was similar to that of the fabricators of the original “hockey stick”. They
refused any access to their verification variables, flouting not only the journal’s published rules but also
the norms of the scientific method, which require that results published in learned journals be
independently verifiable.”
“Amman and Wahl had quietly revealed their verification R2 figures, which were, just as McIntyre had predicted, close to zero for most of the reconstruction, strongly
suggesting that the hockey stick had little predictive power.”
AGW Priest at the ALTER !! LIARS ALL.
TRUTH will eventually rule, and the AGW trollettes will crawl back under their rocks until some other anti-human, anti-life totalitarian agenda comes their way.
Another for you, Andy.
From a ref I posted above.
“(North et al. 2006 p. 91). Sir Humphrey Appleby could not have phrased it better. Unpeeling the obfuscations, here is what they said.
Reconstructions can be assessed using a variety of tests, including RE, and the CE (Coefficient of Efficiency) scores.
If the CE score is near zero or negative your model is junk.
Wahl and Ammann include a Table in which they use Mann’s data and code and compute the test scores that he didn’t report.
The CE scores range from near zero to negative, which tells us that Mann’s results were junk.”
https://www.rossmckitrick.com/uploads/4/8/0/8/4808045/hockey-stick-retrospective.pdf
Tisk tisk, warmists so desperate, so out to lunch, so sad.
“But you go right on ahead and keep believing. We understand how believers operate.”
Just Wow. Hold your horses. You believe that the PAGES 2K study supports the proposal that ‘
The 20th century is merely a return to the Late Holocene normal, albeit somewhat cooler’. While an actual PAGES 2K scientist opines ‘ what this latest PAGES 2k compilation shows, is that you get a hockey stick no matter what you do to the data.’
Sorry, but there it is. You believe you know what a study shows better than its authors do. You may call this confidence. Others may call it hubris.
https://twitter.com/rahmstorf/status/966314483579834368?lang=en
https://strangeweather.wordpress.com/2017/07/11/the-hockey-stick-is-alive-long-live-the-hockey-stick/
Then why have there been over 200 graphs published in peer-reviewed scientific papers in the last 15 months that do not support what Rahmstorf and blog and twitter feed sources have to say about hockey sticks being everywhere? Why hasn’t Antarctica warmed in the modern era according to PAGES 2k, for example?
PAGES 2k: Antarctica Continues Cooling
200 Non-Hockey Stick Graphs Published Since 2017 Invalidate Claims Of Unprecedented, Global-Scale Warming
And why are you clinging to one single data set that doesn’t even cover the globe and that shows the modern period is merely a return to the Late Holocene temperature trends, with the 1300s to 1900s cooling period the exception to the rule? What was the causal mechanism for this anomalous cooling, Philip? Will you be answering this question or will you be ignoring it every time I ask?
https://notrickszone.com/wp-content/uploads/2018/03/Holocene-Cooling-Global-PAGES-2k-1350-1920-Exception.jpg
“get a hockey stick no matter what you do to the data.’”
roflmao. !!
You do know that the Pages2K project was planned SPECIFICALLY to support the AGW scam, don’t you????
Or are you really that naïve and ignorant!!
Yes, that’s what one gets, …when one uses the faulty statistical analysis that Mann used.
The code is available. Disect it, debug it, don’t just repeat what you read on some blog in the skeptics corner of the interwebs.
Get rid of the farcical upsidedown, CO2 enhanced Yamal tree rings and all the anti-reality statistical farce perpetrated by these twerps, and you get closer to REALITY.
https://s19.postimg.org/lomprmi3n/lanser_holocene_figure11.png
https://s19.postimg.org/ol9qs33er/Loehl_2007.jpg
https://s19.postimg.org/x4t4pq1fn/Ljungqvist2010b.jpg
All very much in line with the solar activity, and totally UNRELATED to human CO2.
https://s19.postimg.org/bnhvi8kf7/Solar_Max_Herrera-2015.jpg
Lake cores from Iceland concur
https://s19.postimg.org/6riu4f74j/Iceland_medieval.png
Biodata from around the Arctic concurs that we are in a very cool period of the Holocene.
https://s19.postimg.org/a2p8qx7oz/Arctic-_Sea-_Ice-_Changes-_Chukchi-_Sea-_Yamamoto-2017.jpg
https://s19.postimg.org/v6om69bj7/Arctic-_Sea-_Ice-_Extent-_North-of-_Iceland-3000-_Years-_Moffa-_S_nchez-.jpg
Pacific ocean as well.
https://s19.postimg.org/6uffv17tv/Holocene-Cooling-Western-Pacific-Warm-Pool-OHC-Rosenthal-2017.jpg
Heck, even Tibet gets in on the act.
https://s19.postimg.org/9pfsy8hdv/Holocene-_Cooling-_Tibetan-_Plateau-_Northern-_Li-2017.jpg
Seems that this P.C. clot is yet another CLIMATE CHANGE DENIER, like seb. !
That’s just the way Kenneth operates. He cherry picks quotes from papers without fully understanding any mechanism involved or what papers actually say. All the times he is right about a paper’s contents is when it is some junk science papers … and then he’s fully behind its claim, sometimes even calling it a “seminal paper” 😉
[…] https://notrickszone.com/2018/03/25/alarmism-takes-a-big-hit-flood-of-new-scientific-findings-show-no… […]
[…] presenter was Oxford physicist Myles Allen. He has long been itching to see oil majors sued, telling the BBC in […]
Crowley 2000: Used both his own and Mann et al. (1999)’s hockey sticks to examine the cause of temperature changes over the past 1,000 years. Found that natural forcings could not explain twentieth century warming without the effect of greenhouse gases.
Huang, et al. 2000: Reconstructed global average temperatures since AD 1500 using temperature data from 616 boreholes from around the globe.
Bertrand et al. 2002: Reconstructed solar output, volcanic activity, land use changes, and greenhouse gas concentrations since AD 1000, then computed the expected temperature changes due to those forcings. Compared the computed temperature changes with two independent temperature reconstructions.
Esper et al. 2002: Reconstructed Northern Hemisphere temperatures between AD 800 and AD 2000 using tree ring chronologies.
Cronin et al. 2003: Reconstructed temperatures between 200 BC and AD 2000 around Chesapeake Bay, USA, using sediment core records.
Pollack and Smerdon 2004: Reconstructed global average temperatures since AD 1500 using temperature data from 695 boreholes from around the globe.
Esper et al. 2005: Compared and averaged five independent reconstructions of Northern Hemisphere temperatures from AD 1000 to AD 2000.
Moberg et al. 2005: Combined tree ring proxies with glacial ice cores, stalagmite, and lake sediment proxies to reconstruct Northern Hemisphere temperatures from AD 1 to AD 2000.
Oerlemans 2005: Reconstructed global temperatures from AD 1500 to AD 2000 using 169 glacial ice proxies from around the globe.
Rutherford, et al. 2005: Compared two multi-proxy temperature reconstructions and tested the results of each reconstruction for sensitivity to type of statistics used, proxy characteristics, seasonal variation, and geographic location. Concluded that the reconstructions were robust to various sources of error.
D’Arrigo et al. 2006: Reconstructed Northern Hemisphere temperatures between AD 700 and AD 2000 from multiple tree ring proxies using a new statistical technique called Regional Curve Standardization. Concluded that their new technique was superior to the older technique used by previous reconstructions.
Osborn and Briffa 2006: Used 14 regional temperature reconstructions between AD 800 and AD 2000 to compare spatial extent of changes in Northern Hemisphere temperatures. Found that twentieth century warming was more widespread than any other temperature change of the past 1,200 years.
Hegerl et al. 2007: Combined borehole temperatures and tree ring proxies to reconstruct Northern Hemisphere temperatures over the past 1,450 years. Introduced a new calibration technique between proxy temperatures and instrumental temperatures.
Juckes et al. 2007: Combined multiple older reconstructions into a meta-analysis. Also used existing proxies to calculate a new Northern Hemisphere temperature reconstruction.
Wahl and Ammann 2007: Used the tree ring proxies, glacial proxies, and borehole proxies used by Mann et al. (1998, 1999) to recalculate Northern Hemisphere temperatures since AD 800. Refuted the McIntyre and McKitrick criticisms and showed that those criticisms were based on flawed statistical techniques.
Wilson, et al. 2007: Reconstructed Northern Hemisphere temperatures from AD 1750 to AD 2000 using tree ring proxies that did not show a divergence problem after AD 1960.
Mann et al. 2008: Reconstructed global temperatures between AD 200 and AD 2000 using 1,209 independent proxies ranging from tree rings to boreholes to sediment cores to stalagmite cores to Greenland and Antarctic ice cores.
Kaufman, et al. 2009: Used tree rings, lake sediment cores, and glacial ice cores to reconstruct Arctic temperatures between 1 BC and 2000 AD.
von Storch et al. 2009: Tested three different temperature reconstruction techniques to show that the Composite plus Scaling method was better than the other two methods.
Frank et al. 2010: A brief history of proxy temperature reconstructions, as well as analysis of the main questions remaining in temperature reconstructions.
Kellerhals et al. 2010: Used ammonium concentration in a glacial ice core to reconstruct tropical South American temperatures over the past 1,600 years.
Ljungqvist 2010: Reconstructed extra-tropical Northern Hemisphere temperatures from AD 1 to AD 2000 using historical records, sediment cores, tree rings, and stalagmites.
Thibodeau et al. 2010: Reconstructed temperatures at the bottom of the Gulf of St. Lawrence since AD 1000 via sediment cores.
Tingley and Huybers 2010a, 2010b: Used a Bayesian approach to reconstruct North American temperatures.
Büntgen et al. 2011: Used tree ring proxies to reconstruct Central European temperatures between 500 BC and AD 2000.
Kemp et al. 2011: Reconstructed sea levels off North Carolina, USA from 100 BC to AD 2000 using sediment cores. They also showed that sea levels changed with global temperature for at least the past millennium.
Kinnard et al. 2011: Used multiple proxies to reconstruct late summer Arctic sea ice between AD 561 and AD 1995, using instrumental data to extend their record to AD 2000.
Martin-Chivelet et al. 2011: Reconstructed temperatures in the Iberian Peninsula from 2000 BC to AD 2000 using stalagmites.
Spielhagen et al. 2011: Reconstructed marine temperatures in the Fram Strait from 100 BC to AD 2000 using sediment cores.
Esper et al. 2012: Used tree ring proxies to reconstruct Northern Scandinavian temperatures 100 BC to AD 2000. May have solved the post-AD 1960 tree ring divergence problem.
Ljungqvist et al. 2012: Used a network of 120 tree ring proxies, ice core proxies, pollen records, sediment cores, and historical documents to reconstruct Northern Hemisphere temperatures between AD 800 and AD 2000, with emphasis on proxies recording the Medieval Warm Period.
Melvin et al. 2012: Reanalyzed tree ring data for the Torneträsk region of northern Sweden.
Abram et al. 2013: Reconstructed snow melt records and temperatures in the Antarctic Peninsula since AD 1000 using ice core records.
Marcott, et al. 2013: Reconstructed global temperatures over the past 11,000 years using sediment cores. Data ended at AD 1940.
PAGES 2k Consortium 2013: Used multiple proxies (tree rings, sediment cores, ice cores, stalagmites, pollen, etc) to reconstruct regional and global temperatures since AD 1.
Rhodes et al. 2013: Used proxy and instrumental records to reconstruct global temperatures from AD 1753 to AD 2011.
Again, this is hardly surprising. What would be surprising is if any studies found something other than a hockey stick.
As Jim wrote,
The proper response to someone who asserts that the Hockey Stick has been falsified is to ask “Which one?”
https://davidappell.blogspot.co.uk/2015/08/36-hockey-sticks-and-counting.html
roflmao..
Using the rotten apple as your source.
copy paste from the sewer, without bothering to even look at any of them.
So HILARIOUSLY like a brain-hosed AGW-scammer. !
Lets just choose one, shall we
… look at the Ljungqvist graph
https://s19.postimg.org/c0x5oa46b/Ljungqvist2010b.jpg
now go and get a big wet rag and wipe the egg off your face. !!
We shouldn’t feed you, but it’s funny that you have nothing but ad hominems and insults a arguments … AndyG55, you do not disappoint.
So, no counter to the Ljungqvist graph that Phlop made reference to?
EMPTY yet again, hey seb.
“Then why have there been over 200 graphs published in peer-reviewed scientific papers in the last 15 months that do not support what Rahmstorf and blog and twitter feed sources have to say about hockey sticks being everywhere?”
See above, Mann et al, 2008, to quote just one, used over 1,200 proxies and concluded
“Our results extend previous conclusions that recent Northern Hemisphere surface temperature increases are likely anomalous in a long-term context. Recent warmth appears anomalous for at least the past 1,300 years whether or not tree-ring data are used. If tree-ring data are used, the conclusion can be extended to at least the past 1,700 years, but with additional strong caveats.”
http://www.meteo.psu.edu/holocene/public_html/Mann/research/res_pages/MannPNAS2008/index.html
See above again. David Appell has posted a list of 36 studies that show the hockey stick, between them utilising thousands of proxies.
https://davidappell.blogspot.co.uk/2015/08/36-hockey-sticks-and-counting.html
So you need to (cherry) pick a couple of thousand more just to get even. The hockey stick is in the data.
The hockey stick chart has even been disproved by the National Academy of Sciences and is figment of a fantasizing mind. Moreover, David Appell is no authority on what goes and what doesn’t.
Are you sure about that? Where is your source for that?
https://www.nature.com/articles/4411032a
says they affirmed the hockey stick …
http://www8.nationalacademies.org/onpinews/newsitem.aspx?RecordID=11676
Of course NAS won’t say it directly, but that’s what they found. GIGO. They fundamentally said, the methodology was flawed, but Mann is still right, which of course is absurd. The story of the hockey stick has been well chronicled. After 2007 it disappeared from the IPCC reports. Hans von Storch called Mann’s stick “Quatsch”, in English: “nonsense”.
“Of course NAS won’t say it directly, but that’s what they found. GIGO. They fundamentally said, the methodology was flawed, but Mann is still right, which of course is absurd. The story of the hockey stick has been well chronicled. After 2007 it disappeared from the IPCC reports. Hans von Storch called Mann’s stick “Quatsch”, in English: “nonsense”.”
No, they said the flaws did not have a significant impact on the conclusions. EG
“As part of their statistical methods, Mann et al. used a type of principal component analysis that tends to bias the shape of the reconstructions. A description of this effect is given in Chapter 9. In practice, this method, though not recommended, does *not* appear to unduly influence reconstructions of hemispheric mean temperature; *reconstructions performed without using principal component analysis are qualitatively similar to the original curves presented by Mann et al.*
Page 113
The next IPCC report after 2007 was 2013/14, a decade and a half after the original hockey stick papers. Many new reconstructions were published in that time, not least Mann et al 2008. Why on earth would they cite a 1999 paper when there was an update published in 2008?
Von Storch is maybe cross because his critique was found to be fatally flawed.
http://science.sciencemag.org/content/312/5773/529.2
http://www.realclimate.org/index.php/archives/2006/04/a-correction-with-repercussions/
Then there’s
“It has been noted that we have made no reference to Steve McIntyre’s work. This was on purpose, as we do not think that McIntyre has substantially contributed in the published peer-reviewed literature to the debate about the statistical merits of the MBH and related method. They have published one peer-reviewed article on a statistical aspect, and we have published a response – acknowledging that they would have a valid point in principle, but the critique would not matter in the case of the hockey-stick.”
– Hans Von Storch.
Naturally the alarmists and activists will do anything to make the dead look alive. The hockey stick was a farce from the very beginning. It was crackpot science at its best. I could bring up all the evidence in the world, but there’s nothing that would change your mind. It’s pointless. It’s clear that over 60% of the Holocene was as warm or warmer than it is today. Yes, you can go out and find plenty of activist science to dispute it.