By Kenneth Richard on 25. March 2019
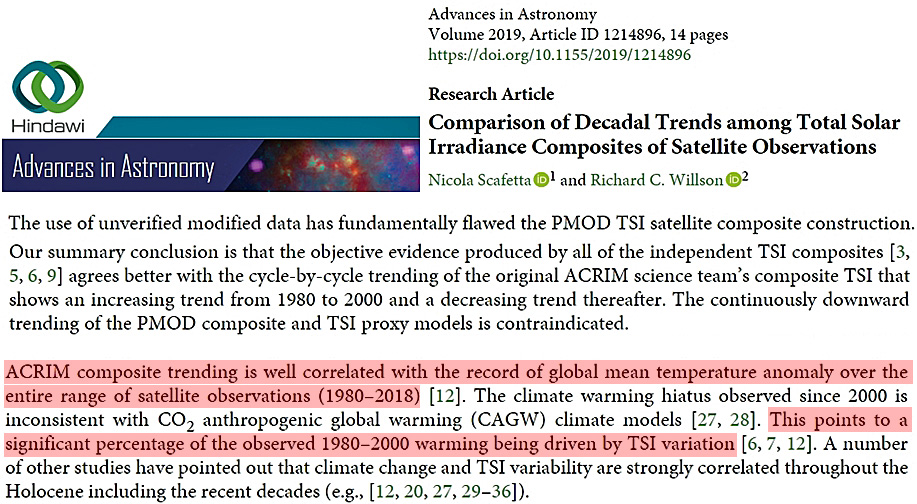
In a new paper, two astrophysicists shred the IPCC-preferred and model-based PMOD solar data set and affirm the ACRIM, which is rooted in observation and shows an increase in total solar irradiance (TSI) during the 1980-2000 period. They suggest a “significant percentage” of recent climate change has been solar-driven.
I. The PMOD is based on proxy modeled predictions, “questionable” modifications, and degraded, “misinterpreted” and “erroneously corrected” results
• “The PMOD rationale for using models to alter the Nimbus7/ERB data was to compensate for the sparsity of the ERBS/ERBE data and conform their gap results more closely to the proxy predictions of solar emission line models of TSI behavior.”
• “PMOD’s modifications of the published ACRIM and ERB TSI records are questionable because they are based on conforming satellite observational data to proxy model predictions.”
• “The PMOD trend during 1986 to 1996 is biased downward by scaling ERB results to the rapidly degrading ERBE results during the ACRIM-Gap using the questionable justification of agreement with some TSI proxy predictions first proposed by Lee III et al.(1995).”
• “PMOD misinterpreted and erroneously corrected ERB results for an instrument power down event.”
• “PMOD used overlapping comparisons of ACRIM1 and ACRIM2 with ERBE observations and proxy models to construct their first composite. Other PMOD composites [17, 18] used different models of the ERBE-ACRIM-Gap degradation. The result of these various modifications during the ACRIM-Gap was that PMOD introduced a downward trend in the Nimbus7/ERB TSI data that decreased results by 0.8 to 0.9 W/m2 (cf. [18, 20]).”
II. The PMOD TSI composite “flawed” results were an “unwarranted manipulation” of data intended to support AGW, but are “contraindicated”
• “The dangers of utilizing ex-post-facto corrections by those who did not participate in the original science teams of satellite experiments are that erroneous interpretations of the data can occur because of a lack of detailed knowledge of the experiment and unwarranted manipulation of the data can be made based on a desire to support a particular solar model or some other nonempirical bias. We contend that the PMOD TSI composite construction is compromised in both these ways.”
• “[O]ur scientific knowledge could be improved by excluding the more flawed record from the composite. This was the logic applied by the ACRIM team. In point of fact PMOD failed to do this, instead selecting the ERBE results that were known to be degraded and sparse, because that made the solar cycle 21–22 trend agrees with TSI proxy models and the CAGW explanation of CO2 as the driver of the global warming trend of the late 20th century.”
• “The use of unverified modified data has fundamentally flawed the PMOD TSI satellite composite construction.”
• “The consistent downward trending of the PMOD TSI composite is negatively correlated with the global mean temperature anomaly during 1980–2000. This has been viewed with favor by those supporting the CO2 anthropogenic global warming (CAGW) hypothesis since it would minimize TSI variation as a competitive climate change driver to CO2, the featured driver of the hypothesis during the period (cf.: [IPCC, 2013, Lockwood and Fröhlich, 2008]).”
• “Our summary conclusion is that the objective evidence produced by all of the independent TSI composites [3,5, 6, 9] agrees better with the cycle-by-cycle trending of the original ACRIM science team’s composite TSI that shows an increasing trend from 1980 to 2000 and a decreasing trend thereafter. The continuously downward trending of the PMOD composite and TSI proxy models is contraindicated.”
III. The ACRIM TSI supports the conclusion that “a significant percentage” of climate change in recent decades was driven by TSI variation
• “ACRIM shows a 0.46 W/m2 increase between 1986 and 1996 followed by a decrease of 0.30 W/m2 between 1996 and 2009. PMOD shows a continuous, increasing downward trend with a 1986 to 1996 decrease of 0.05 W/m2 followed by a decrease of 0.14 W/m2 between 1996 and 2009. The RMIB composite agrees qualitatively with the ACRIM trend by increasing between the 1986 and 1996 minima and decreasing slightly between 1996 and 2009.”
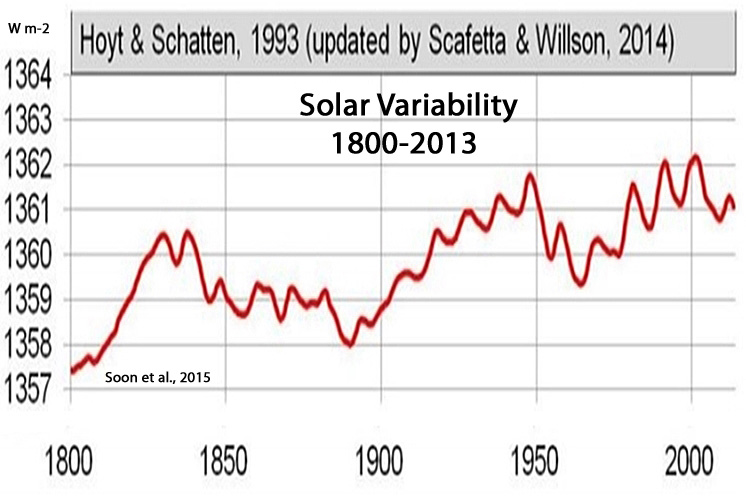
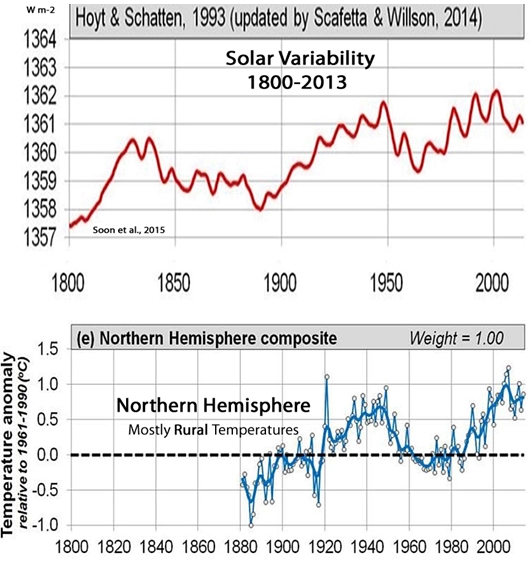
• “ACRIM composite trending is well correlated with the record of global mean temperature anomaly over the entire range of satellite observations (1980–2018) [Scafetta. 2009]. The climate warming hiatus observed since 2000 is inconsistent with CO2 anthropogenic global warming (CAGW) climate models [Scafetta, 2013, Scafetta, 2017]. This points to a significant percentage of the observed 1980–2000 warming being driven by TSI variation [Scafetta, 2009, Willson, 2014, Scafetta. 2009]. A number of other studies have pointed out that climate change and TSI variability are strongly correlated throughout the Holocene including the recent decades (e.g., Scafetta, 2009, Scafetta and Willson, 2014, Scafetta, 2013, Kerr, 2001, Bond et al., 2001, Kirkby, 2007, Shaviv, 2008, Shapiro et al., 2011, Soon and Legates, 2013, Steinhilber et al., 2012, Soon et al., 2014).”
• “The global surface temperature of the Earth increased from 1970 to 2000 and remained nearly stable from 2000 and 2018. This pattern is not reproduced by CO2 AGW climate models but correlates with a TSI evolution with the trending characteristics of the ACRIM TSI composite as explained in Scafetta [6,12, 27] and Willson [7].”
IV. The Correlation:
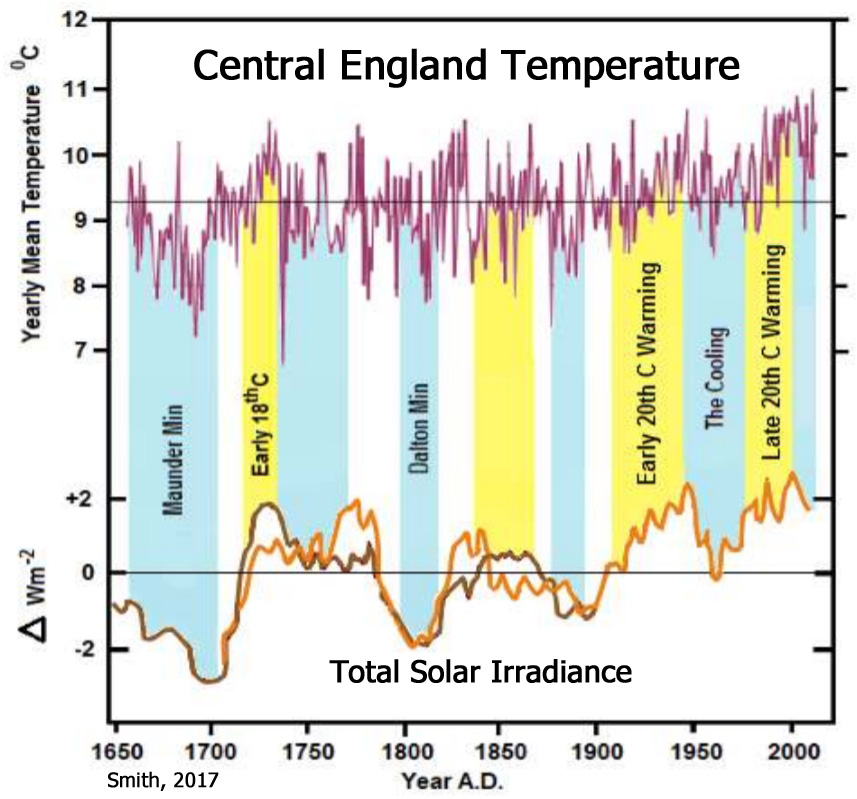
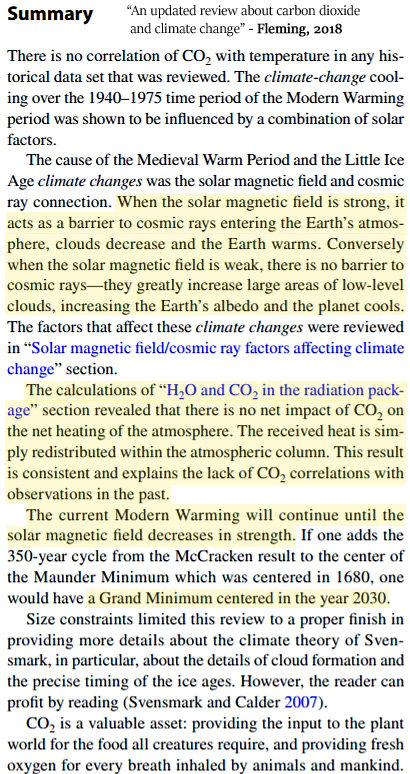
V. The Mechanism: Higher solar activity on decadal-scales limits the seeding of clouds, which means more solar radiation is absorbed by the surface, warming the Earth
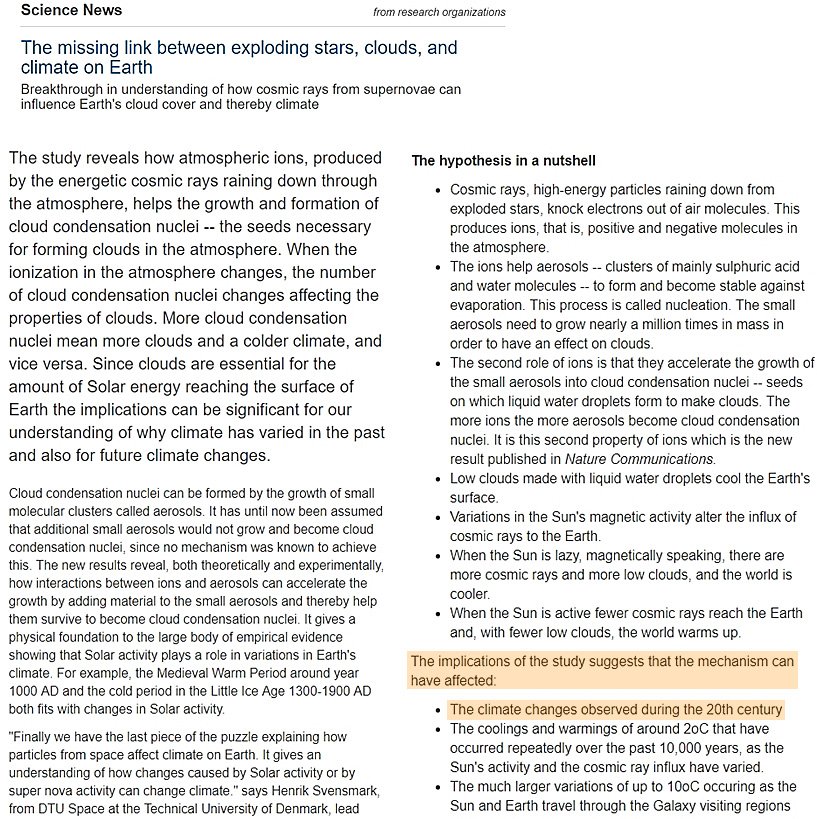
VI. The radiative forcing from the increase in surface solar radiation: +4.25 Wm-2/decade between 1984-2000
Posted in Solar Sciences |


There is a good correlation between the annual England max and mean temperatures and the annual sunshine hours.
https://www.metoffice.gov.uk/pub/data/weather/uk/climate/datasets/Tmax/date/England.txt
https://www.metoffice.gov.uk/pub/data/weather/uk/climate/datasets/Sunshine/date/England.txt
If you divide the sunshine hours by 100 you can easily plot them on the same graph.
Something like this?
https://imgur.com/a/2wBRBBl
Is it suprising that the temperature somewhat correlates with a solar variable? Is it warmer during the day than at night? The Sun is the source for the energy that makes up (most of) the heat content of this planet.
SebastianH 25. March 2019 at 5:18 PM
No not surprising at all, that’s the point.
I think you missed my point, Kelvin Vaughan. The point was that it somewhat correlates. It’s not a good correlation and it doesn’t say anything about the global picture when looking at just one region. E.g. the gulf stream code stop tomorrow and cause vastly different climate in the UK, probably a much cooler one. What would looking at such a change mean for the global picture?
The sun in Sweden also shines a lot more today
https://www.smhi.se/polopoly_fs/1.143989.1548428766!/image/allsack_1983-lastyear.jpg_gen/derivatives/Original_1256px/image/allsack_1983-lastyear.jpg
or if You prefer energy:
https://www.smhi.se/polopoly_fs/1.145594.1552572571!/image/g8lt_y.png_gen/derivatives/Original_1256px/image/g8lt_y.png
http://journals.ametsoc.org/doi/abs/10.1175/JCLI-D-12-00040.1
“Using observation-based products of climate variables, satellite-derived cloud cover, and radiation products, the authors show that, during the 1984–2007 period, Europe has become less cloudy (except northeastern Europe) and the regions east of Europe have become cloudier in summer daytime. In response, the summer temperatures increased in the areas of total cloud cover decrease and stalled or declined in the areas of cloud cover increase. Trends in the surface shortwave radiation are generally positive (negative) in the regions with summer warming (cooling or stalled warming), whereas the signs of trends in top-of-atmosphere (TOA) reflected shortwave radiation are reversed. The authors’ results suggest that total cloud cover is either the important local factor influencing the summer temperature changes in Europe or a major indicator of these changes.”
I think this is due to SO2 reduction.
Wild has noticed this in a paper:
https://journals.ametsoc.org/doi/pdf/10.1175/BAMS-D-11-00074.1
And Svensmark in this paper has a figure 12 that can confirm it:
https://www.thegwpf.org/content/uploads/2019/03/SvensmarkSolar2019-1.pdf
Human aerosol particulate production is about 1 to 10% of the natural background, with volcanic aerosols dominating. Our emissions have had little to no effect. Most studies have determined that cloud cover changes are more influential than aerosols in determining dimming and brightening.
Neely et al., 2013
http://onlinelibrary.wiley.com/doi/10.1002/grl.50263/abstract
“We employ model runs that include the increases in anthropogenic sulfur dioxide (SO2) over Asia and the moderate volcanic explosive injections of SO2 observed from 2000 to 2010. Comparison of the model results to observations reveals that moderate volcanic eruptions, rather than anthropogenic influences, are the primary source of the observed increases in stratospheric aerosol.”
Höpfner et al., 2013
http://www.atmos-chem-phys.net/13/10405/2013/acp-13-10405-2013.pdf
“The increase in the stratospheric aerosol concentration observed in the past years is caused mainly by sulfur dioxide from a number of volcano eruptions. Variation of the concentration is mainly due to volcanoes. Lower stratospheric variability of SO2 could mainly be explained by volcanic activity and no hint for a strong anthropogenic influence has been found.”
Bryson and Goodman, 1980
http://www.ganino.com/games/Science/science%20magazine%201980/root/data/Science%201980/pdf/1980_v207_n4435/
Volcanic Activity and Climate Changes
“[T]he measured values of direct solar radiation decreased about 5 percent during the 1945 to 1975 … From 1945 to 1970, the annual eruption numbers roughly doubled from 16 to 18 per year to 37 to 40 per year. During the same interval, the aerosol optical depth also roughly doubled. This is in good agreement with the observations of Hammer, who reported a doubling in the amount of nonorganic impurities deposited on the Greenland Ice Sheet between times of low and high volcanic activity based on ice core analysis for the past 300 years.”
Cobb, 1973
http://journals.ametsoc.org/doi/pdf/10.1175/1520-0469%281973%29030%3C0101%3AOALDFM%3E2.0.CO%3B2
“It has been estimated (Squires, 1966; Selezneva, 1966; Hidy and Brock, 1970; Robinson and Robbins, 1970) that the anthropogenic component of the global particulate burden of the atmosphere amounts to 5-12%; not, it would seem a very alarming figure. … Ellis and Pueschel (1971), in a report based on solar radiation data at Mauna Loa for the period 1958-70, conclude that human activities have not affected the atmospheric turbidity on a global scale. They also conclude that the 1963 eruption of Mount Agung, a natural phenomena, produced stratospheric aerosols which persisted for 7 years.”
Mitchell, 1970
http://link.springer.com/chapter/10.1007/978-94-010-3290-2_15
“The secular increase of global atmospheric particulate loading by human activity is estimated, and compared with a construction of the secular variability of stratospheric dust loading derived from data on volcanic activity since 1850. It is concluded that the total human-derived particulate load is at present comparable to the average stratospheric dust load from volcanic eruptions, but that the variations of human-derived loading are an order of magnitude less than those of volcanic dust loading. For reasonable estimates of the thermal cooling effect of dust load increases, it is inferred that secular cooling due to human-derived particulate loading is currently of the order of 0.05°C per decade. Although changes of total atmospheric dust loading may possibly be sufficient to account for the observed 0.3°C-cooling of the earth since 1940, the human-derived contribution to these loading changes is inferred to have played a very minor role in the temperature decline.”
http://onlinelibrary.wiley.com/doi/10.1002/2013JD021308/abstract
“It is concluded that at the sites studied changes in cloud cover rather than anthropogenic aerosols emissions played the major role in determining solar dimming and brightening during the last half century and that there are reasons to suppose that these findings may have wider relevance.”
Thanks for the links.
But one picture is more informative.
Look at the ship tracks in Svensmarks paper above.(fig 11)
Pinatubo charged the air with 20 M ton SO2 1991.
Since 1980 the yearly charging with SO2 is 50 M ton less .
Some of it must have given us less cooling.
And of course you think this actually contradicts AGW? 😉
Of course not. Believers have nothing to fear. The PMOD is…AWESOME!
Yonason, and others may wish appraise what is written here https://malagabay.wordpress.com/2012/12/10/1366-and-all-that-the-secret-history-of-total-solar-irradiance/
Given this potted history of TSI, do we really know what TSI is? Are we just being lead up the garden path of fantasy of unfounded belief on how the sun is affecting our planet?
P.S. I use to post this quite regularly on climate blogs(decades ago) and the cAGW advocates never have had a good answer for why we should believe that current TSI measurements are all true. 9 time out of 10 all they (cAGW advocates) had was an appeal to authority — Lean and all that baloney.
Oops,
The line “I use to post this quite regularly on climate blogs(decades ago)”
should be
I use to post this quite regularly on climate blogs(years ago)
It just feels like decades ago 🙂
Basically TSI is not a constant or even close to being one.
Do we really know anything? Do you think your smartphone can actually measure acceleration? Do you think your digital thermometer is measuring the temperature? Do you think an analog one does?
Everything we measure is based on models and the laws of physics we assume to be universal and correct.
I know it’s part of the climate skeptical culture to question everything and call everything a belief now, but this? It just shows that there is a lack of understanding on how we measure stuff present. I also find it kind of cute that whenever TSI comes up, skeptics refer to Willson and Scafetta. I wonder why that is, do you? Question everything … remember? Be skeptical for once!
Probably because the ACRIM data set they use is based on observations, whereas the PMOD that the activists and AGW promoters prefer uses the PMOD, which is based on modeled predictions rather than data and fits the AGW agenda.
Would it have been so hard to actually read the paper, even the summary of it in the article? Your comments are so often reflective of a lack of awareness, a tendency to comment first, then read later (if ever).
@tomO
Thanks. That’s more info on a problem that Willie Soon discusses in the video I link to, below.
SebastianH,
You’re trolling me again I see.
You’re a laugh 🙂 with all that high eluting babble you spew out!
I know, your scorching criticism has shown them to be wrong through physics and the empirical evidence, eh? Err, no!
I know, you appear not to understand Scafetta and Willson, so you poorly attempt to play down the huge knowledge and understanding they bring to the subject. But that’s your silly way, 🙂 .
They (Scafetta and Willson) certainly are much more convincing than you or the UN-IPCC on solar matters. And yes I’m skeptical but their analysis is very convincing and has stood the test of time, thus I accept it, unless YOU can show were they are wrong. You can can’t you? (No of course you can’t because as many have seen, you haven’t a clue!)
So keep-up the blather, you’re still unbelievable, still unconvincing, still just the comedy spot on this blog.
tomOmason,
It might feel that way when someone doesn’t respond to your own troll attempts, but I assure you I am not trolling you here.
So you admit you have no clue? Or are you now just trolling me?
I am not downplaying anything. Those two get mostly mentioned on climate skepticism blogs. Don’t you wonder why that is? They also mention everything a skeptic would like to here in their paper … and of course you’ll celebrate every word they utter 😉
You accept it because you want to believe that this is reality. They convince you because they appeal to your feeling of what is real.
I don’t need to, others have compared ACRIM to PMOD already … why would I need to repeat those findings to you? I am also not saying they are wrong, I merely find it curious that those two get so many mentions on skeptic blogs. You don’t and that’s fine as well.
Look at that, a clown tries to call his opponent a clown … anyway, congratulations on getting away with not answering my questions. I guess you do know that everything we measure is based on models and you are just trying to troll with declaring that models are bad.
“Look at that, a clown tries to call his opponent a clown … anyway, congratulations on getting away with not answering my questions. I guess you do know that everything we measure is based on models and you are just trying to troll with declaring that models are bad.”
Again you’re trolling me, and show how with some much blather (empty vassals and all that), you’re still unbelievable, still unconvincing, still just the comedy spot on this blog.
Hahahaha 🙂
Thanks again for the stupid comments with the unintended levity.
Much appreciated! 🙂
I’ve got SebH’s “science” right here….
“There is no way out. If your job is to sell a self-evident lie, you are in trouble. Different alarmists are leaning towards one side of the trade-off or another. Many of them are often changing the strategy. But almost all of them [the alarmists] keep on denying the fundamental conflict between the observations and the very point of their ideology…“ – Lubos Motl (a real scientist)
https://motls.blogspot.com/2014/09/one-half-of-co2-doubling-achieved.html
And in case the pseudo-science advocates here didn’t get that, let me clarify it for them: a fundamental conflict between observations of reality and theory means… THE THEORY IS WRONG!
They do NOT have science on their side, no matter what their social justice warrior heroes claim.
@Seb It is just another significant pointer in that direction.
Good to see you posting references to support the obvious.
@Don
AGW doesn’t even exist, and they know it. That’s why it’s now called “climate disruption,” which also doesn’t exist, but they probably figure it’s easier to sell a more ambiguous concept than one involving something people can clearly see isn’t happening.
What more “proof” do we need that AGW isn’t happening, other than they’ve stopped insisting that it is.
Looks like the troll didn’t get the memo?
“Good to see you posting references to support the obvious.” – Don to SebH
LOLOL. Not the first time the intrepid troll has bravely pushed the envelope of the ordinary. I doubt it will be the last.
No it’s not, that was the whole point. BTW: I don’t know if you read that this subthread was about cloud cover, do you?
Yonason,
No comment … seriously, how can anyone be this much in denial?
“…how can anyone be this much in denial?”
Easy. There’s no data supporting it. NONE AT ALL!
How you can think you are on the side of scientific investigation when you don’t even know how it’s correctly done, tells a lot about your state of mind.
Still, go ahead and prove me wrong. SHOW ME THE DATA!
But you won’t. Because you can’t.
Face it, SebH.
[…] […]
Haven’t read everything above yet, but think it’s important to add this on TSI by Willie Soon.
https://youtu.be/qbTo2q4o0tM?t=83
There are/were serious problems with determining what it’s absolute value is, without knowing which not much can be said with any degree of certainty about how earth’s energy budget is impacted by it.
Also, from Don Easterbrook, via Nils Axel-Moerner
https://www.youtube.com/watch?v=G4wov0kc3yg
TSI variation isn’t strong enough by itself, but the fact that it so well correlates with earth’s temperature tells us that whatever is affecting TSI is also affecting temperature.
And here Yonason, (https://phys.org/news/2019-03-solar-variability-weakens-walker-cell.html ) research shows more strange solar effects on weather and climate.
However they do have a theory to explain what’s happening.
Now all they have to do is collect the observational evidence and prove that it is so.
I don’t think much funding will be forthcoming for ongoing research, after all it goes against the cAGW meme.
Thanks, tomO. Nice find.
“An Inconvenient Truth” is false.
https://www.dropbox.com/s/t2dx3axg0zfl7ks/NOAA%20time%20series%20%28Draft%29.pdf?dl=0
and
https://www.dropbox.com/s/2khj5by6wk118yd/The%20Solar%20Cycle%20is%20responsible%20for%20extreme%20weather%20and%20Climate%20change%20WUWT.pdf?dl=0
and
https://www.dropbox.com/s/cpga49bbnn7q062/It%27s%20not%20the%20heat….pdf?dl=0
They don’t like you much here.
https://environmentdebate.wordpress.com/2007/07/02/doctor-no-dr-fran-manns/amp/
Keep up the good work.
Dr. Francis Manns: “CO2 was as high as 400ppm in 1942 only to fall again during the 1940-60 cooling period.”
Oh dear … 2 “charming” commentators found each other.
“Plant stomata reconstructions (Kouwenberg et al., 2005, Finsinger and Wagner-Cremer, 2009) and contemporary chemical analyses (Beck, 2007) indicate that CO2 levels in the 1930′s to early 1940′s were in the 340 to 400 ppmv range and then declined sharply in the 1950’s. These findings have been rejected by the so-called scientific consensus because this fluctuation is not resolved in Antarctic ice cores. However, MacFarling Meure et al., 2006 found possible evidence of a mid-20th Century CO2 decline in the DE08 ice core…”
https://wattsupwiththat.com/2012/12/07/a-brief-history-of-atmospheric-carbon-dioxide-record-breaking/
Activists cherry pick out the inconvenient data they don’t want, and then pretend it never existed.
What part of “there’s data to support that assertion” don’t you get, Mr. anti-science?
Hey Mr. Science Yonason,
you do know how science works, do you? There are also “scientists” who claim that gravity sets the surface temperature of planets with an atmosphere. That doesn’t mean that it’s true.
But of course we should follow any fringe result of all scientists and never question whether there could be any merrit to the findings, right? As long as they confirm your feeling of what is really going on, Mr. Science. As long as you can call others activists and whatnot.
I really hope you don’t see the article behind your link as science. I’ve read it and it is really interesting to see people argue this way, but it is complete nonsense nonetheless. But does one expect from guest posts on WUWT …
Here is another “science” paper from an author skeptics should be familiar with:
https://www.friendsofscience.org/assets/documents/FoS%20Pre-industrial%20CO2.pdf
Did you know that apparently CO2 concentrations were way higher than today in pre-industrial times? Who would have thought that? Actual science is surely ignoring this because it’s inconvenient and doesn’t fit in the huge conspiracy that is going on, right? 😉
Easy there, pardner. Get a grip, and face the AGW is a hoax music.
“…political goals have become more important than the scientific truth in …[climate “science”]. Most of the people who were hired to this discipline since 1988 or so became (or have always been) fraudsters and demagogues who are spinning and fabricating the facts, terminology, and emphases in order to strengthen the case for a predetermined political goal. This is not science.“ – Lubos Motl (actual scientist)
https://motls.blogspot.com/2018/12/its-spin-to-call-1850-1900-pre.html
As to the strawman/red herring about atmospheric pressure, Motl deals with that a bit here.
https://motls.blogspot.com/2010/05/tamino-vs-goddard.html
I don’t know why the troll keeps accusing me of believing something I’ve never said I believed in, i.e., that pressure alone (in the absence of a temp difference between a planet and space) determines lapse rate.
When they get rattled, activists say the darnedest things. //;o]
It can’t be science if it’s fraud.
“A recent letter from 300 scientists is requesting that Congress assure that the Data Quality Act is complied with, which NOAA has not done regarding both the U.S. and global empirical temperature observations.
When 300 scientists put their name and reputations on the line criticizing NOAA, it can be assumed that the issue is one of significance and importance to science.
And this issue is now coming to a head after 7+ years of both NOAA and NASA blatantly adjusting historical temperature measurement records on a continual basis.” – C3Headlines
https://www.c3headlines.com/2016/01/a-legitimate-question-how-much-of-modern-global-warming-is-fabricated-by-noaa-nasa.html
Case in point … are you an activist then?
I am not accussing you of anything but being anti-science. Your links are as interesting as they always are …
You have a very weird and selective perception, Yonason. That’s what makes you a perfect fit for a community like this one. From you previous comments I gather you are or could be a member of many other fringe oppinion communities as well. I have no problem with that, but apparently you do … just own it, Yonason! There is no shame in being weird.
Weak response, SebH.
If it isn’t mockery or deceit, it’s deflection. Why? Because he has no response to the substance of what I referenced, that the people he calls “scientists” are frauds. He has nothing to show that I’m wrong, so he attacks me personally.
What the real scientists I link to write shows that he’s wrong, so he calls me “weird.” And with that he thinks he can discredit what they say? This has to be one of his most desperate and pathetic posts yet.
[…] Reblogged from the NoTricksZone: […]
With all the propaganda regarding AGW, it is no wonder the “Illusory Truth Effect” is likely in play now!
No doubt part of the plan.
[…] https://notrickszone.com/2019/03/25/satellite-evidence-affirms-solar-activity-drove-a-significant-per… […]