By Kirye
and P. Gosselin
Of course all we hear from the media nowadays is that weather extremes have been getting worse (over the past decades) and the planet is warming rapidly. But when we look at the untampered data, we see that many places have been cooling.
Today I present to you some examples, now that untampered November data for 2019 have become available at the JMA.
Iceland
First we look at November mean temperatures of three stations Iceland, isolated in the middle of the North Atlantic. The source of the data is the Japan Meteorological Agency (JMA):
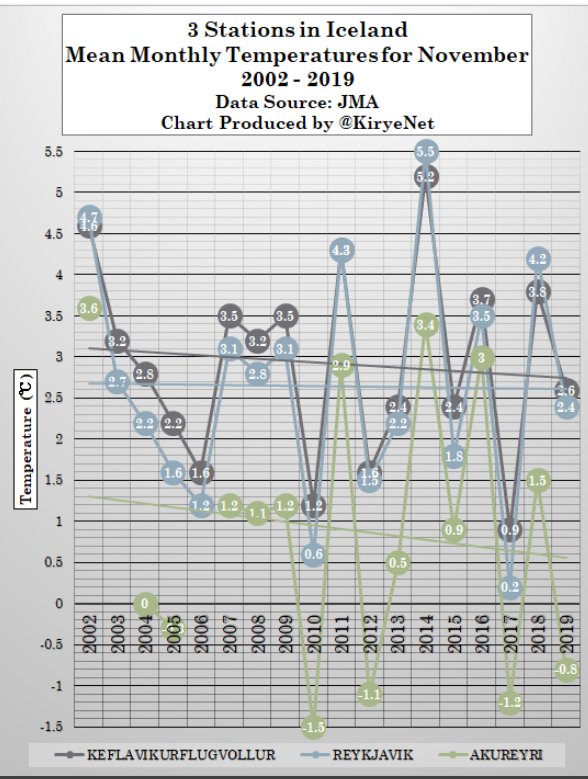
Three Icelandic stations with sufficiently available data from the JMA show a cooling November trend since the early part of the century. Data JMA.
In Iceland, the start of winter in fact has been getting colder, and not warmer like AGW theory would suggest. So there’s been lots of deception coming from activists.
Netherlands
The data tell a similar November story at the North Sea country of Netherlands: The start of winter is not getting delayed in the sense of warming. Quite to the contrary, it’s been cooling in November:

No real warming to be seen in November from the five examined stations in the Netherlands. Data: JMA.
Ireland
Over at the North Atlantic island of Ireland, we find 6 stations with sufficient data from the JMA to allow the plotting of November trends. Here’s the result of the six stations observed:

Warming? Ireland is hardly behaving like the alarmists and Greta claim. Early winter in Ireland has been cooling! Data: JMA.
Norway (Greta’s neighbor)
Greta Thunberg’s western neighbor, Norway, has also been defying claims made the teenage Swedish activist, and, for the most part, has been seeing cooling in November for two decades:
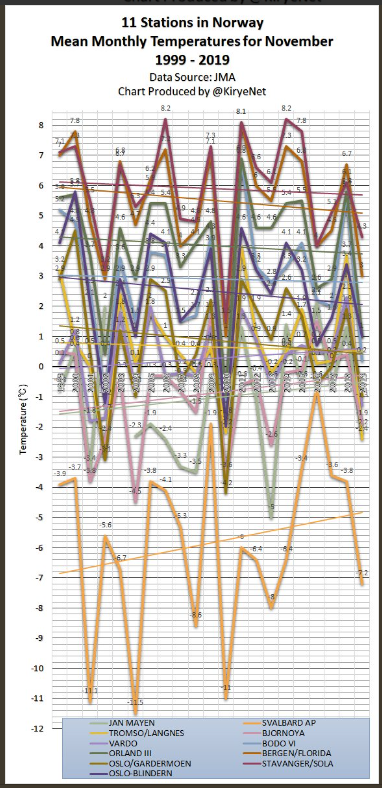
November in Greta Thunberg’s neighbor, Norway, has been cooling for some two decades now. Data: JMA.
Seven of 11 stations in Norway show November temperatures have had a cooling trend since 1999 (20 years)!
This year TROMSO/LANGNES and VARDO saw their coldest November in the last 17 yrs, BODO VI, ORLAND III, BERGEN/FLORIDA and OSLO/GARDERMOEN were the coldest in 9 years.
Sweden
Next we move to Greta’s Sweden, whose future she says we are stealing. But looking at her home country as a whole, 3 of 6 stations in Sweden show November temperatures have had a cooling trend since 1999:

No significant Swedish warming during Greta’s lifetime. Data: JMA.
Powerful ocean cycles, not trace gas CO2
So how can these northern European countries examined above be cooling in times of “rapid global warming”? Why is winter coming earlier, and not later? Isn’t CO2 greenhouse gas supposed to be trapping heat there and making things warmer?
Obviously it isn’t, and so there has to be other natural explanations.
The explanation for this of course has long been suspected, but has been kept hidden from the public. The major reason for the cooling of November over the recent years very likely has something to do with the North Atlantic sea surface temperature (SST).
As the following chart shows, SSTs are cyclic, and they have been trending down for the past 15 years.
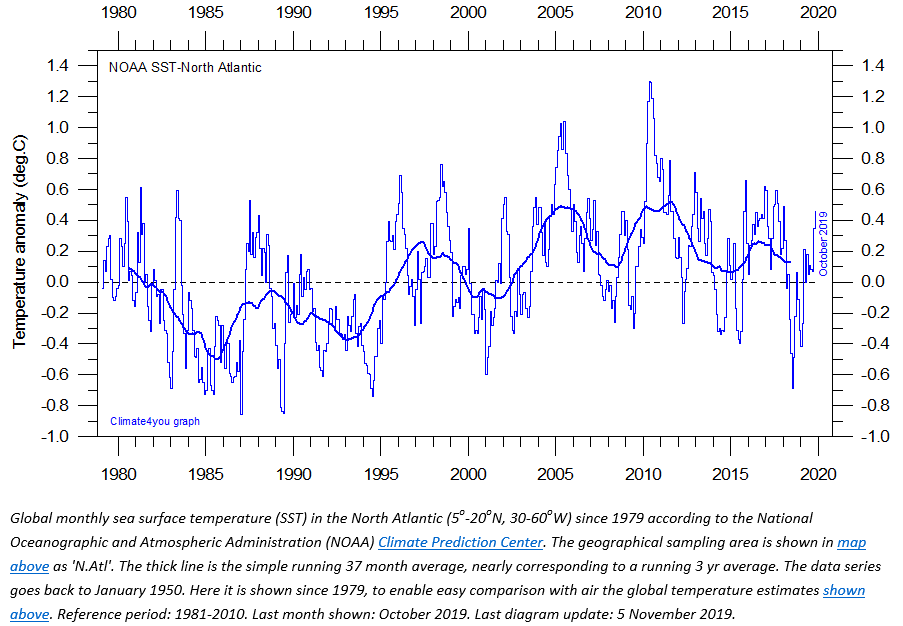
Chart: NOAA, via Climate4you.
So it’s no surprise that November has been cooling over northern, coastal Europe since the start of the century. Claiming that CO2 drives climate is a sham.


Armagh observatory on the border of the Republic of Ireland and N. Ireland has one of the longest temperature records going back to 1790. You can plot the figures from 1875 yourself, links below. Nothing to be seen there except the oscillation of the Atlantic Multidecadal Oscillation (AMO), as in your graph of sea temperatures above, on an approximately thirty year period. Other long term stations in the Republic include Birr, Valentia, Malin Head and Phoenix Park. You can request this data for free from Met Eireann under the AIE Regulations, see section on charges below:
https://www.met.ie/climate/services
Malin Head was relocated 2 miles inland from a very exposed position on the headland in 1950. From that point on it warmed somewhat compared to Armagh, Birr and Valentia, which are all rural locations with no real change over the last century. Phoenix Park in the centre of Dublin does show a recent slight warming trend, which would be consistent with the very large degree of urban development, which has occurred around it in recent decades. The only conclusion from all of this data is that everything is normal and the AMO is the biggest influence by far on Irish climate.
Tmax and T min for each month of each year below for Armagh since 1875:
https://www.metoffice.gov.uk/pub/data/weather/uk/climate/stationdata/armaghdata.txt
As the webpage below says:
https://www.metoffice.gov.uk/research/climate/maps-and-data/historic-station-data#?tab=climateHistoric
The monthly mean temperature is calculated from the average of the mean daily maximum and mean daily minimum temperature i.e. (tmax+tmin)/2.
Missing data (more than two days missing in a month) have been indicated by “—“. Estimated data (where available) have been indicated by “*” after the value.
Funny, but the data tamperers say they have to cool the past by make “adjustments” to the raw data because apparently back then no one knew how to take a temperature, and the raw data was running hot. But, and here’s what I find amusing, now that we know how to take temperatures, they are running too cold, and so the raw data has to be adjusted up.
Seriously, you NEVER adjust raw data except in rare instances and only to a small subset of the data. You never ever adjust ALL of the data, which is what they appear to be doing.
”The analysis presented here indicates that, outside the immediate war-time period, these adjustments are distorting and degrading the data rather than improving it.” – Judith Curry
https://judithcurry.com/2012/03/15/on-the-adjustments-to-the-hadsst3-data-set-2/amp/
Please also consider the fact that hundreds of scientists are deeply concerned that NOAA’s treatment of the raw data does not comply with the law.
em>“A recent letter from 300 scientists is requesting that Congress assure that the Data Quality Act is complied with, which NOAA has not done regarding both the U.S. and global empirical temperature observations.”
https://www.c3headlines.com/2016/01/a-legitimate-question-how-much-of-modern-global-warming-is-fabricated-by-noaa-nasa.html
Agree entirely. Raw data should never be adjusted. It may be ignored or have annotations, but NEVER, EVER adjusted.
The Gulf Stream has been weakening in recent years.
This is part of the downturn of the AMO.
https://www.nature.com/articles/s41586-018-0006-5
Here you may see, AMOC is fine
https://climexp.knmi.nl/data/imoc_mar_hc10_mon.dat
Here’s a video you might enjoy.
https://www.youtube.com/watch?v=g_n2bzjQetM
November temperatures were below normal out here in the middle of nowhere.
Anybody in contact with the Polarstern?
Stuck in the ice up there way up north, they’re going to be in the dark for a while.
The ice is still there? You’re kidding? Has to be some kind of explanation for that.
The scientists have their instruments lined up, data is the commodity extracted there, up in the Arctic ice floe that has them captured. The lights are on.
Polarstern meteorology data
It’s been -20 C plus some more for a number of days now. No sunshine will do that.
Lat Long YY-MM-DD UTC Wind T(C)
86.0 112.8 19-11-30 23:00 8 310 -26.0
85.8 123.1 19-11-01 00:00 4 90 -22.5
Polarstern
They might need some warmth, heat. The Polarstern wouldn’t dare use, consume fossil fuels, can’t do that, wouldn’t be prudent, you don’t dare be a hypocrite.
The carbon footprint must be off the charts. Yeah, it is. The range, nineteen thousand nautical miles. Gotta have a large fuel capacity, a big tank.
what can you say?
Fossil fuels are being used to keep them alive, without bunker fuel, they’ll be in big trouble. The refrigeration unit has to keep their food from spoiling.
The Polarstern has four Deutz KHD RBV 8m540 engines to make it go, keep the heat on.
With no fuel, there will be no electricity, they’re going to be cold.
@Phil Salmon
AMOC is down, a paper from Rahsmtorf as reference ?
Not realy…..
@Phil Salmon PS
There is not only one conrtadiction to Rahmstorfs AMOC papers, but if you look here:
https://climexp.knmi.nl/data/imoc_mar_hc10_mon.dat
Make your graphs, including a 13 month running mean and you will see what is wrong 😀
Krishna
Look at the science, not the names.
Mike Mann has also shown that the AMOC is slowing down.
This observation is correct, but their spin on it that it means warming, is one I disagree with.
Oddly one can find papers that say that both slowing down and speeding up of the Gulf Stream both cause warming. They can’t both be right.
Put simply, ocean circulation exists to move heat from equator to poles. When it works faster then more heat is moved and high latitudes warm. Conversely when this ocean poleward heat transport slows, high latitudes cool.
Thus a slowing Gulf Stream will result eventually in high latitude and Arctic cooling. Thus I predict will happen within a few years as the AMO moves into its declining phase.
[…] https://notrickszone.com/2019/12/15/ocean-cycles-at-work-data-from-japan-meteorology-agency-show-nor… […]
[…] Ocean Cycles At Work: Data From Japan Meteorological Agency Show Northern Coastal Europe November CO… […]
[…] https://notrickszone.com/2019/12/15/ocean-cycles-at-work-data-from-japan-meteorology-agency-show-nor… […]
[…] https://notrickszone.com/2019/12/15/ocean-cycles-at-work-data-from-japan-meteorology-agency-show-nor… […]
[…] https://notrickszone.com/2019/12/15/ocean-cycles-at-work-data-from-japan-meteorology-agency-show-nor… […]