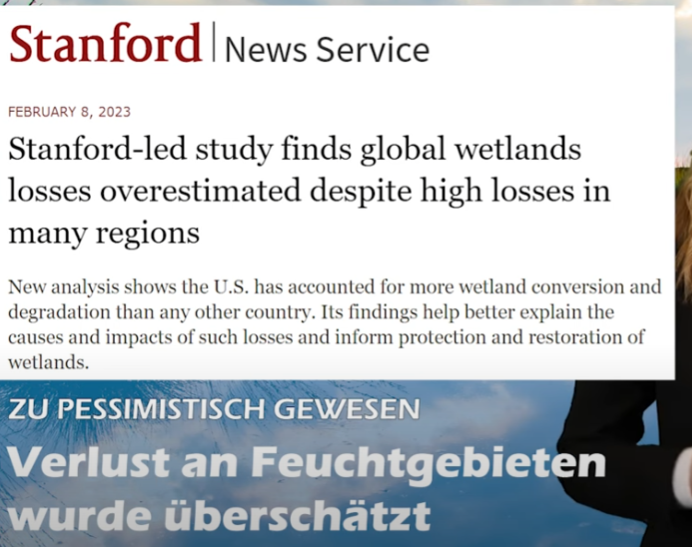
EIKE latest climate video (German) here reports on a recent Stanford University-led study that found global wetlands losses had been grossly overestimated, too pessimistic.
According to the study, the U.S. has accounted for more wetland conversion and degradation than any other country. Overall, the study investigated wetlands in 144 countries.
Researchers find that the wetland ecosystems area has declined 21-35% (3.36 million square kilometers, an area larger than India)) since 1700 – due to human intervention, e.g. drainage. Though this may sound dramatic, it is “far less than the 50-87% losses estimated by previous studies.”
It needs to be noted that data before 1850 is scarce.
“Discovering that fewer wetlands have been lost than we previously thought gives us a second chance to take action against further declines,” said study co-author Peter McIntyre, an ecologist at Cornell University. “These results provide a guide for prioritizing conservation and restoration.”
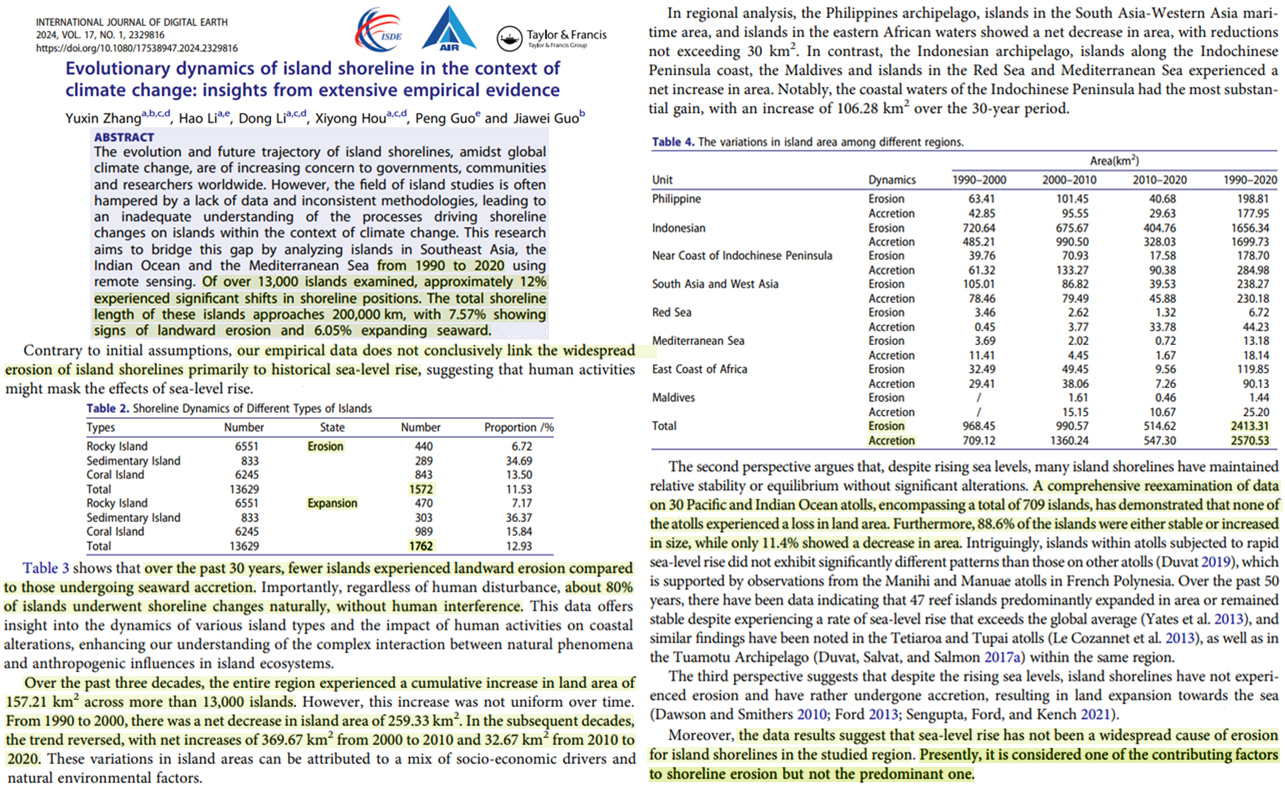
The sea level rise experienced in recent decades was supposed to lead to shrinking shorelines and inundated coasts. Instead, satellite observations reveal the globe’s island coasts expanded seaward (net) by 402 km² since 2000.
In a new study, over 13,000 islands were assessed for coastal change over the last three decades (1990-2020). Only 12% of these islands experienced significant shoreline change during this period. Thus, approximately 88% of the islands had stable coasts − neither substantial erosion or accretion.
About 6% of these 13,000+ islands experienced coastline expansion (accretion), while 7.5% lost coastal land area (erosion). The scientists point out that, for the islands experiencing coastal erosion in recent decades, sea level rise was not a primary or predominant causal factor. This is “contrary to initial assumptions.”
“Moreover, the data results suggest that sea-level rise has not been a widespread cause of erosion for island shorelines in the studied region. Presently, it is considered one of the contributing factors to shoreline erosion but not the predominant one.”
“Contrary to initial assumptions, our empirical data does not conclusively link the widespread erosion of island shorelines primarily to historical sea-level rise, suggesting that human activities might mask the effects of sea-level rise.”
Somewhat consistent with the alarming sea level rise narrative propagated by anthropogenic global warming (AGW) activists, there was indeed a net loss (-259.33 km²) of coastal land area for the 13,000+ islands studied in the decade spanning 1990 to 2000. But then, “in the subsequent decades, the trend reversed, with net increases of 369.67 km² from 2000 to 2010 and 32.67 km² from 2010 to 2020.”
Added together, in the last two decades the globe’s island coasts net grew seaward by 402.33 km² from 2000-2020, and coasts grew by a net 157.21 km² for the entire 30-year period (1990-2020).
“Over the past three decades, the entire region experienced a cumulative increase in land area of 157.21 km² across more than 13,000 islands.”
“…over the past 30 years, fewer islands experienced landward erosion compared to those undergoing seaward accretion.”
Sea level rise thus cannot be an explanation for the contradictory three decades of net coastal seaward expansion observations.
But if the recent decades of sea level rise trends cannot even be considered a primary or predominant factor contributing to coastal erosion either, then the alarmist sea level rise narrative necessarily disintegrates under the weight of the evidence.
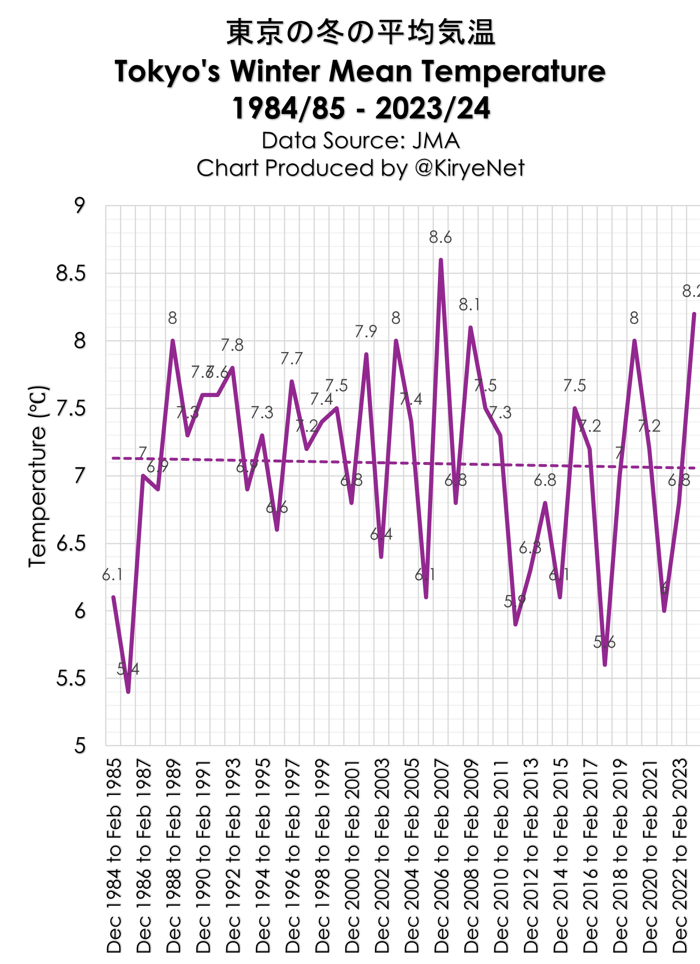
The December 1 to February 29 meteorological winter ended and the latest data for the mean winter temperature are available for Tokyo and its island Hachijō-jima.
Looking at the mean DJF winter temperature trend for Tokyo going back 39 years using the untampered data from the Japan Meteorological Agency (JMA), we see a surprising trend: NO WARMING!
Moreover, the average of the last 10 years have been colder than the two preceding ten-year periods.
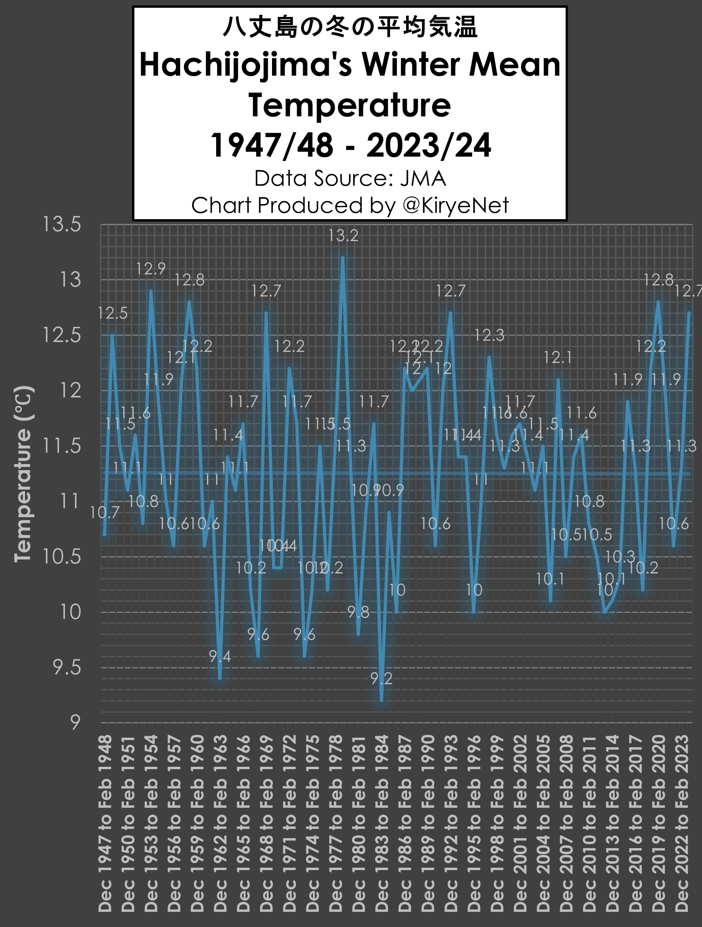
Rural Pacific island Hachijō-jima: no warming in 75 years!
Next we look at the latest mean winter temperature trend of the rural Tokyo island of Hachijō-jima, located in the Pacific – some 287 kilometers south of Tokyo – where there is relatively little temperature data corruptive concrete and asphalt like we have in Tokyo:
Winter mean temperatures on this Pacific island haven’t risen in over 75 years, this according to the meticulously collected and tabulated data from the JMA.
We can suspect the news is also similar at other locations across the northern hemisphere, if you don’t look at data that’s been tampered with by NASA.
Of course, few argue that the surface of the globe as a whole hasn’t warmed over the past decades, and that man hasn’t played a role. One thing is 99.99% certain: there is no “climate crisis” – just lots of junk-grade, foul science behind the ridiculous claim.
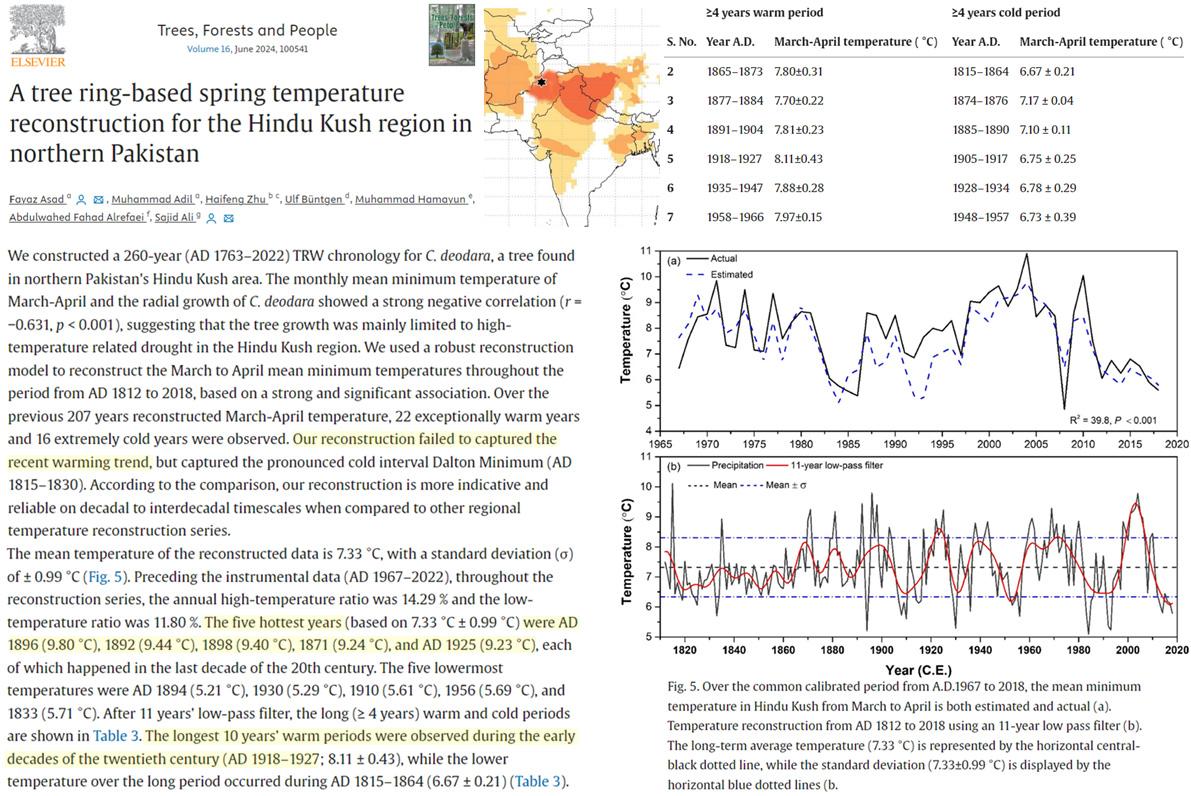
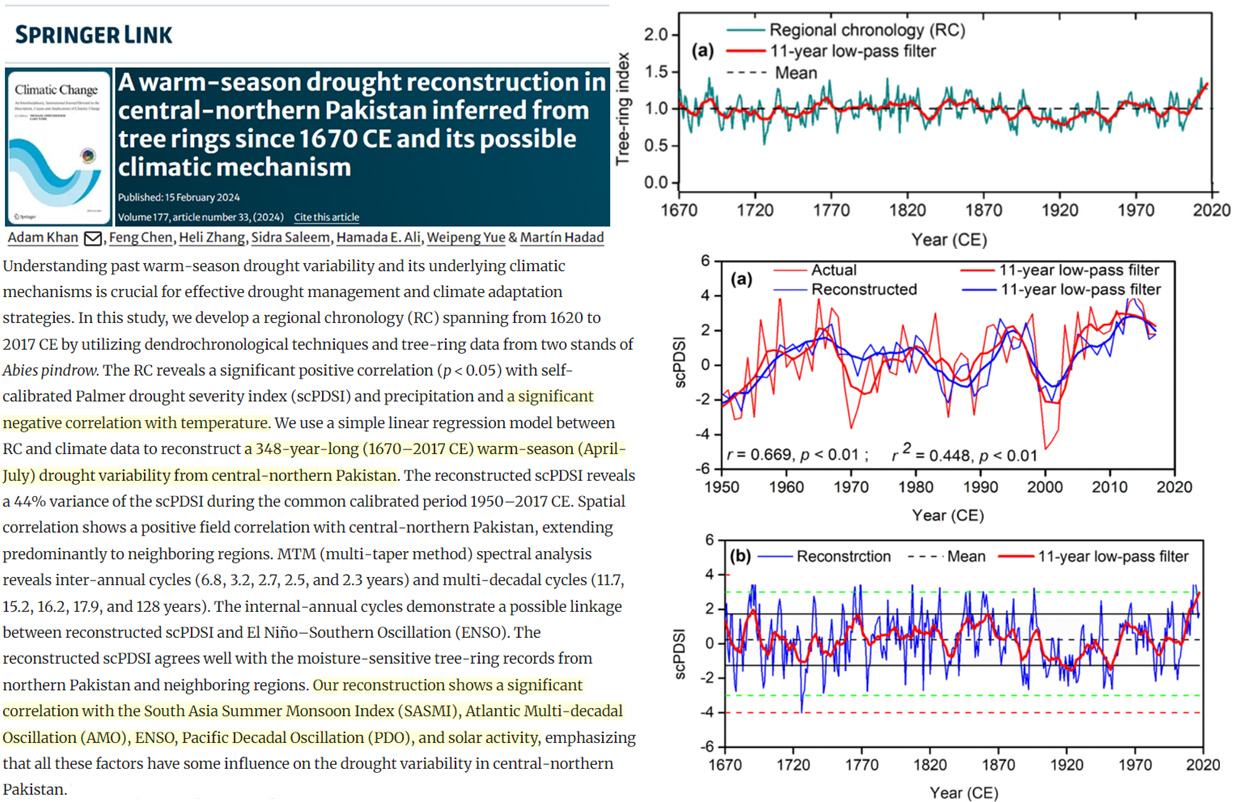
“In this study, we develop a regional chronology (RC) spanning from 1620 to 2017 CE by utilizing dendrochronological techniques and tree-ring data from two stands of Abies pindrow. The RC reveals a significant positive correlation (p < 0.05) with self-calibrated Palmer drought severity index (scPDSI) and precipitation and a significant negative correlation with temperature.”
“Our reconstruction shows a significant correlation with the South Asia Summer Monsoon Index (SASMI), Atlantic Multi-decadal Oscillation (AMO), ENSO, Pacific Decadal Oscillation (PDO), and solar activity, emphasizing that all these factors have some influence on the drought variability in central-northern Pakistan.”
Another solar farm gets wrecked by hailstorm…toxic chemicals now threaten environment
On March 16th, near Needville Texas, thousands of solar panels were destroyed by a powerful hailstorm, causing significant damage to a large 10,000-acre solar farm in the area. It’s tornado season!
The storm brought baseball-sized hail and smashed the solar panels at the Fighting Jays Solar Farm. Though the panels are made of tempered glass, which is designed to shatter safely upon impact, the hail’s size was enough to crack the photovoltaic cells underneath and thus render them useless and possibly environmentally dangerous.
The latest incident once again highlights the vulnerability of solar farms to the weather elements. Last month we reported how in June, 2023, hailstorms in Nebraska destroyed a 14,000-panel 4.375 MW AC solar facility.
Toxic chemicals risk leaking
Not only is the Fighting Jays Solar Farm property damage high, now there’s concern dangerous chemicals could now leak into the ground and contaminate the whole site.
Resident Nick Kaminski, who lives near the solar farms, said he “was shocked” is worried about the environmental impact “some highly toxic chemicals” coming from destroyed panels could have.
‘I have a family two children and a wife,’ he said. ‘My neighbors have kids and a lot of other residents in the area who are on well water are concerned that the chemicals are now leaking into our water tables.'”
Damages in the tens of millions of dollars
Currently there’s no publicly available damage estimate for the Fighting Jays Solar Farm. However, news reports on the event do provide some hints for how high the costs might be. Similar hail damage to a solar farm in Texas in 2019 resulted in over $75 million in losses. That particular farm had a capacity of 178 megawatts, while the Fighting Jays Solar Farm is even larger at 350 megawatts.
Based on this, it’s likely the damage to the Fighting Jays Solar Farm will run in the tens of millions of dollars.
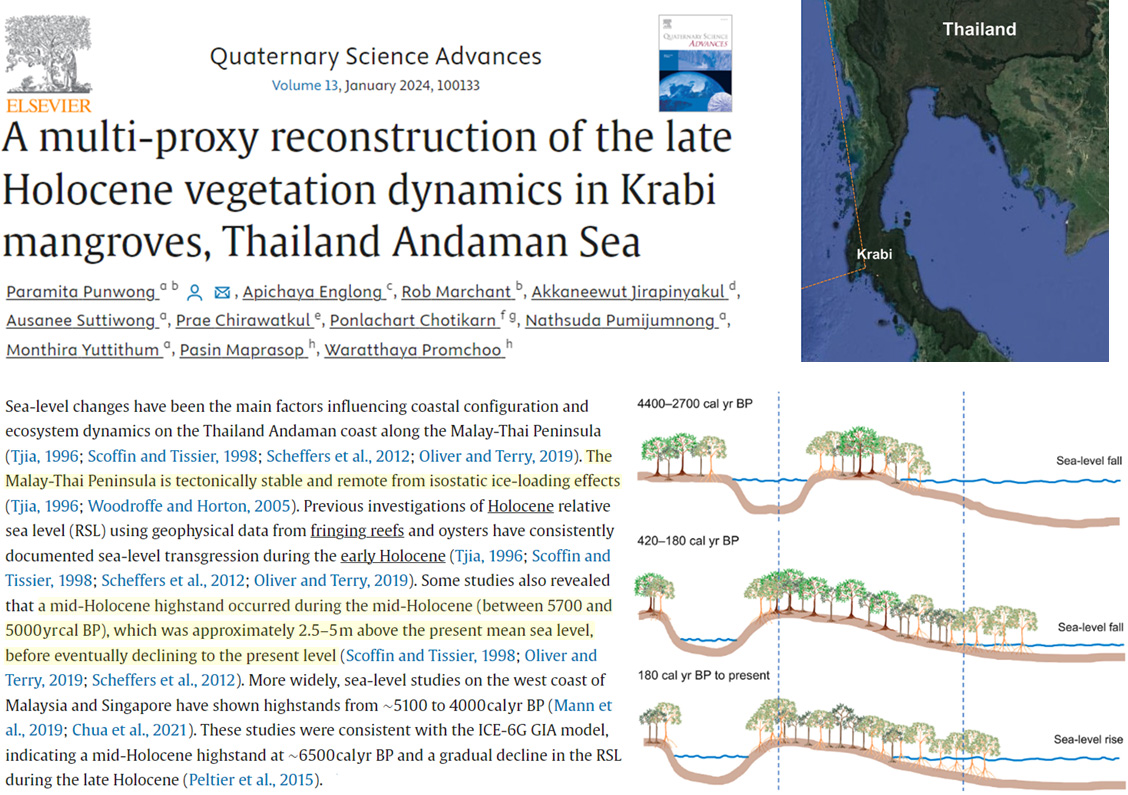
Modern relative sea levels are near the lowest in the last 7,000 years.
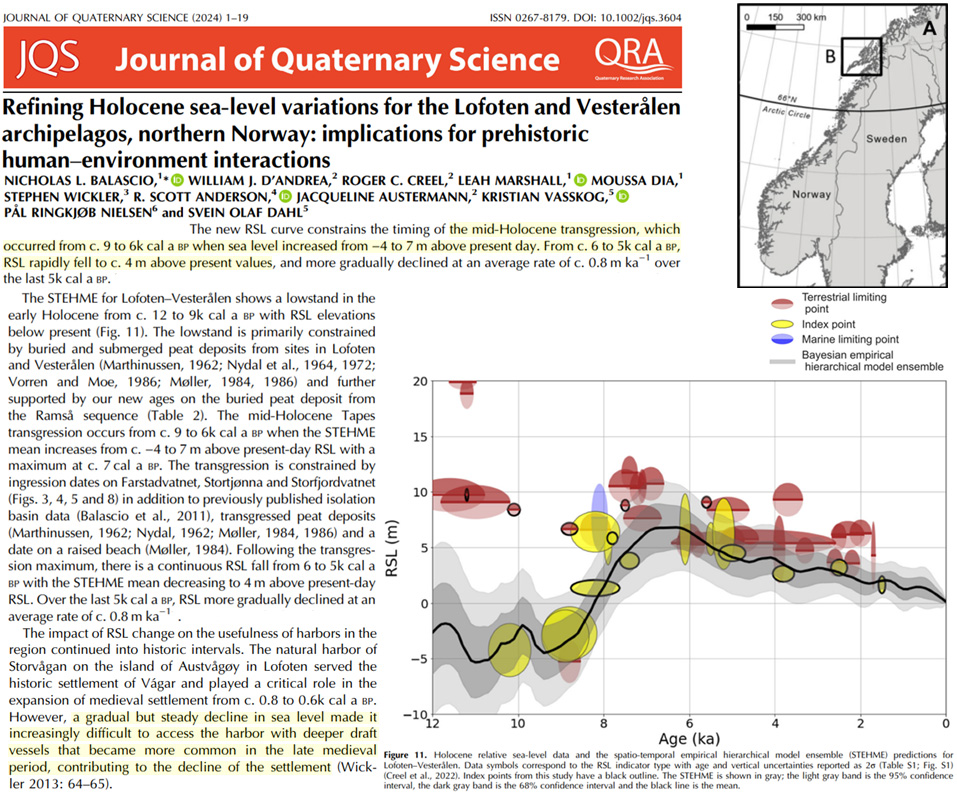
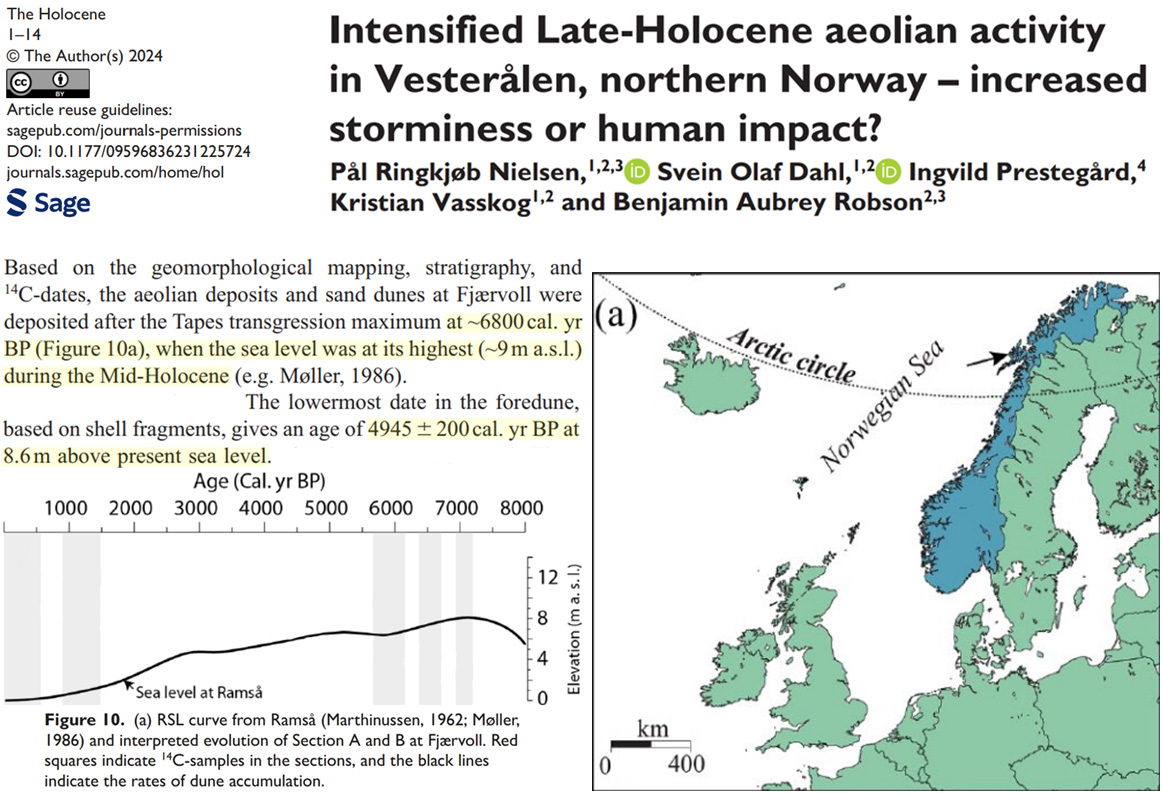
Two studies, independently published, identify Mid-Holocene sea levels in northern Norway (north of the Arctic circle) as 7 to 9 meters higher than today before declining to the present (Balascio et al., 2024, Nielsen et al., 2024).
This region of the Arctic was warm enough to support human settlements and boat harbors during the Medieval Warm Period. As the climate deteriorated into the Little Ice Age cooling centuries after the Medieval warmth, the accompanying sea level fall led to abandoned residences, ships, and harbors. The seas had become to shallow to sail in.
It is sometimes assumed that these much higher Holocene relative sea levels are merely a function of tectonics, or post-glacial uplift. But sea levels in the tropics (for example the Malaysia-Thailand region), unaffected by ice-loading vertical land motions, were also anywhere from 2 to 5 meters higher than today during this Mid-Holocene period before declining to present levels (Punwong et al., 2024).
“The Malay-Thai Peninsula is tectonically stable and remote from isostatic ice-loading effects.”
The recent sea level rise in recent centuries is thus well within the range of natural sea level variations.
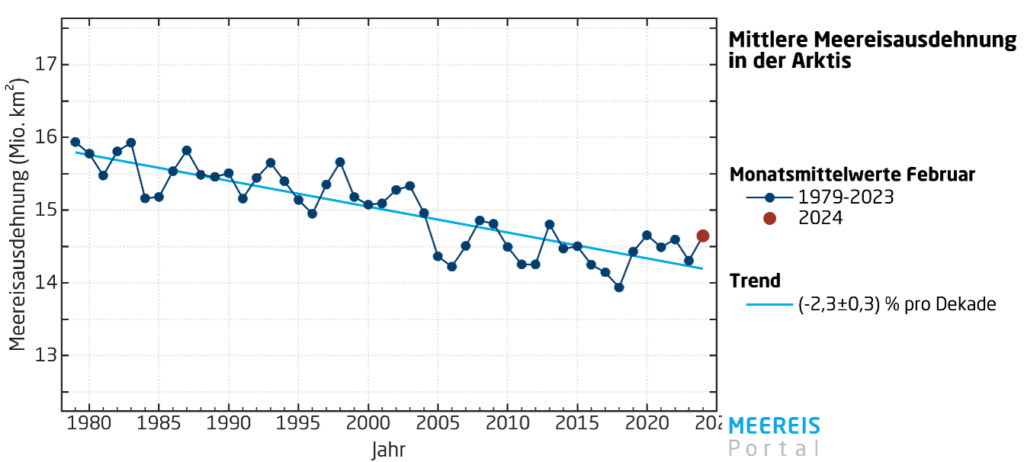
Arctic sea ice extent as recorded by Germany’s Alfred Wegener Institute (AWI) in Bremerhaven, Germany, looks at the situation in January 2024. Despite the record temperatures reported, the ice in the Arctic has recovered somewhat.
The slight recovery trend since the Arctic minimum was reached is continuing at the beginning of 2024, with the sea ice extent at the beginning of the year below the average value for the years 1981 – 2010, but in the lower range of the extreme values (minimum / maximum) of this international climate normal period (Figure 1).
If we look at the new reference period 1991 – 2020 introduced by the World Meteorological Organization in 2021, January 2024 is roughly in line with the mean value of this period (see interactive graphic). The average Arctic sea ice extent in January was 13.99 million square kilometers, around 400,000 square kilometers greater than the ice cover in January over the last 20 years (Figure 2). During the month, the extent increased by approximately 29,000 square kilometers per day, which was slower than the average increase from 1981 to 2010.”
Image: Screenshot Meereisportal.de
Among highest in past 20 years
The above chart indeed shows a stable trend over the past 2 decades. According to the AWI:
This year’s maximum sea ice extent most likely occurred on February 27, at 14.94 million square kilometers. The monthly average ice extent in February was 14.65 million square kilometers.”
That makes it higher than 15 of the past 20 years.
Compared to the long-term average for the years 2003 – 2014, it is noticeable that the sea ice cover in the northern Barents Sea is lower, but the Greenland Sea and the northern Baltic Sea in the Gulf of Bothnia and the coastal zones of the Barents Sea have more extensive sea ice areas. This indicates lower and longer-lasting cold periods in these regions.”
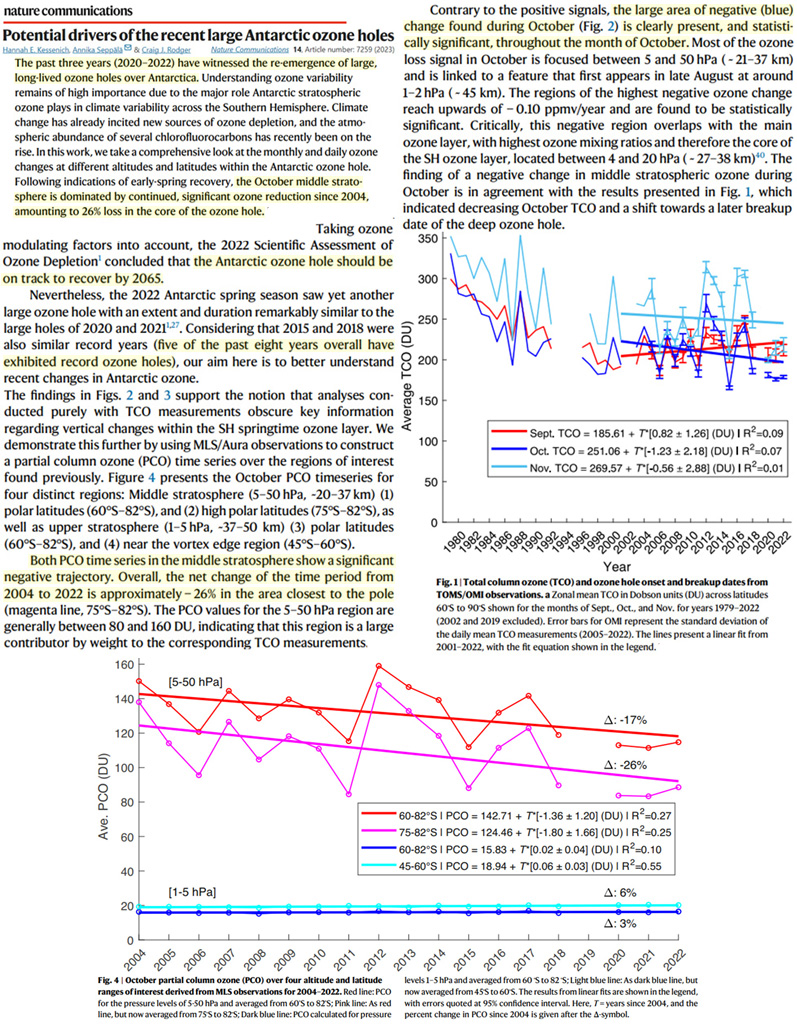
There has been a “continued, significant ozone reduction since 2004, amounting to 26% loss in the core of the ozone hole” (Kessenich et al., 2023).
It is not at all evident that the 1987 Montreal Protocol bans on presumed ozone-depleting substances (ODS) like chlorofluorocarbons (CFCs) materially affected the flat to negative trajectory of stratospheric ozone over Antarctica.
Massive Antarctic ozone holes – the largest on record in 45+ years of tracking – have been ongoing in the 21st century. In fact, “five of the past eight years overall have exhibited record ozone holes,” with a negative trend resulting in a “26% loss in the core of the ozone hole” from 2004-2022 (Kessenich et al., 2023).
Because the presumed effect of the ODS bans have not been realized in the last 35 years, the scientists who still believe humans are responsible for ozone losses (i.e., 2022 Scientific Assessment of Ozone Depletion) are now saying the ozone recovery from ODS damages “should be on track” to being realized by 2065 – over 40 years from now. This estimate is quite convenient, as most of the scientists formulating these predictions will be dead.
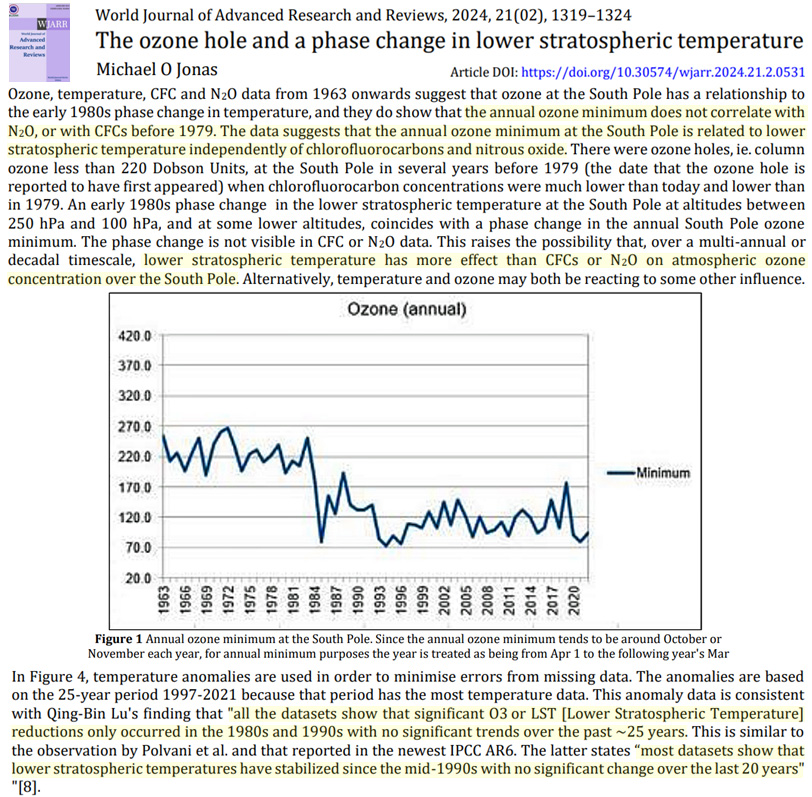
Another new study (Jonas, 2024) points out that ozone holes were observed in the 1960s too. This is well before 1979, the conveniently-chosen “start” year for ozone hole formation.
Also, the data appear to show “the annual ozone minimum at the South Pole is related to lower stratospheric temperature independently of chlorofluorocarbons and nitrous oxide.”
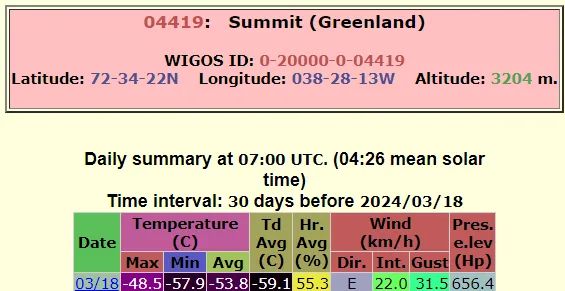
In the desert of Afif, west of Riyadh, it snowed unexpectedly, both citizens and tourists were shocked.
The significant drop in temperatures was expected with strong north-westerly winds making it even colder. Last year (2023), parts of Saudi Arabia saw its first snowfall in 100 years.
Bolstered by the increasing snowfall in recent years (and despite the “devastating effects of climate change”), Saudi Arabia is working to improve its mountain tourism with its own ski resort to be built by 2026.
Freezing Australia
This past week, the Australian continent saw temperature anomalies of up to 28°C below the multi-decadal norm, affecting large regions:
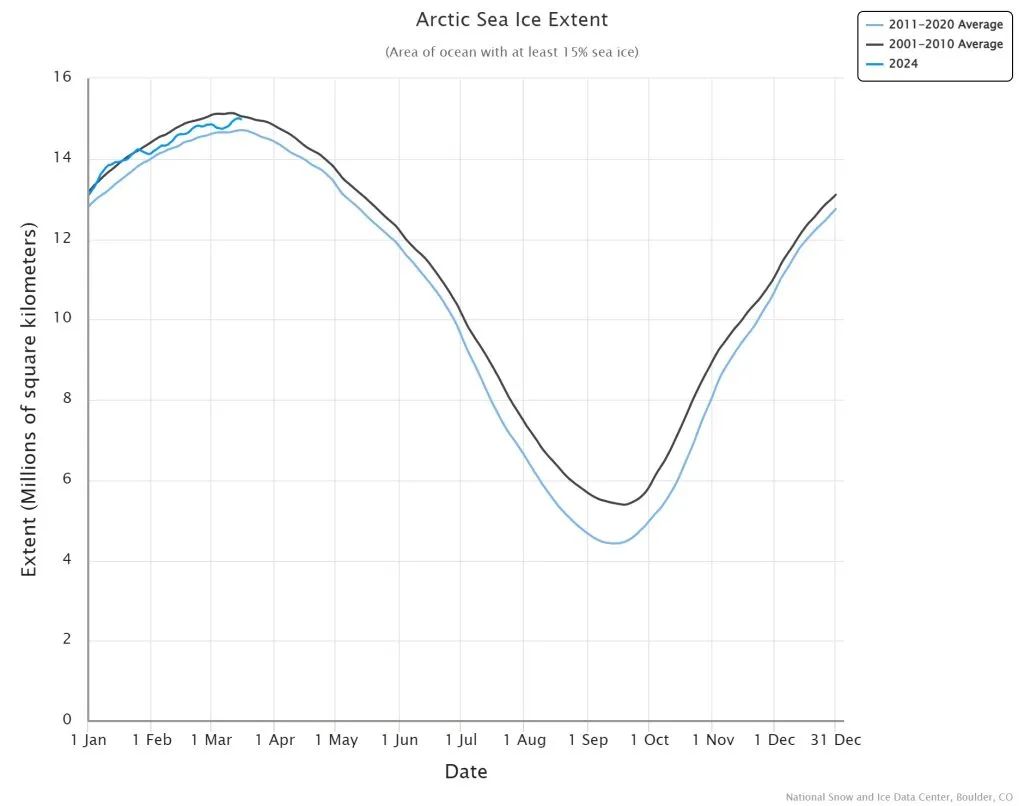
The exceptional cold in the far north has contributed to Arctic sea ice extent to be above the average for the period 2011-2020, and is rapidly approaching the average for the period 2001-2010.
Obviously the Arctic is surprising the experts, who warned that sea ice there was supposedly in rapid decline.
Unusual, record-breaking cold in India
Intense cold persists in Indian cities like Bhubaneswar, Cuttack, Puri, Chandbali, Paradeep and Baripada, which are experiencing record-breaking low temperatures. On Wednesday, many places in the eastern state of Odisha experienced the coldest March days ever. In Bhubaneswar, a maximum temperature of only 19.2 °C was recorded yesterday, breaking the previous record of 24.3 °C by a whopping 5°C!
In northern India, snow from the north is bringing down temperatures in the lower latitudes in central and southern India. In many cities, including the eastern metropolitan cities of Bhubaneswar, Cuttack, Puri, Chandbali, Paradeep and Baripada, record low March temperatures were recorded, beating benchmarks from the 1970s and beyond.
Record low in New Zealand
In the southern hemisphere, where summer has come to an end, the temperature in Whanganui, New Zealand dropped to 4°C on Wednesday morning, the second lowest March temperature in the town’s history. The lowest March low of all time was recorded on March 28, 1985 (solar minimum of the 21st cycle) at 2.5 °C.
New lows recorded in Australia
A severe cold snap has hit southeastern Australia. In the mountains of New South Wales, there was frost in the Perisher Valley with temperatures as low as -5.7°C. This is only 1.4°C above the national record for the month of March. Thredbo recorded -4.4°C. Cooma also recorded an impressive -1.9°C.
In Mt. Hotham, Victoria, the national record was missed by just 1.2°C, at -3.1°C. Monthly records also fell in Omeo, Victoria: on Thursday morning, the temperature of -0.7°C was a whole 1°C below the previous record (2021).
And in Cleve, South Australia, the temperature of 6.8 °C also exceeded the old record by 1 °C (yet to be confirmed).
Temperature in Antarctica plummets to near -68°C
On March 21, the seasonal minimum at Concordia dropped to -67.7°C, from -67.4°C on March 20.
Antarctica is cooling, the data is clear…
At Klimanachrichten, Dr. Ludger Laurenz looks how solar influence on rainfall in Germany.
Precipitation patterns linked to the 22-year Hale cycle.
While droughts and periods of heavy precipitation in Germany are often blamed on CO2 climate change by the media and pseudo-experts, Laurenz sees a clear link to the 22-year solar Hale cycle. This can be detected in many historical weather data series.
To search for the solar influence on the annual precipitation sum, he used the data from the DWD dating back to 1903.
Finding: “Different precipitation trends are repeated every 22 years. This indicates solar influence.”
According to Laurenz, “The exceptionally high level of precipitation totals in the last year and the first two months of 2024 is very likely due to solar influence.”
Moreover, he found: “The evidence of solar influence on precipitation totals is even better if periods over the turn of the year are selected instead of the classic annual period from January to December, such as the 12-month period from July to June of the following year or the winter half-year. The solar influence on the precipitation sum is much stronger in the winter half-year than in the summer half-year.”
The solar magnetic cycle (Hale cycle) lasts approximately 22 years and can be detected in solar physical measurement data (Chapman et al. 2021) and the search for solar influence is based on Chapman’s formulations.
With the change from one Hale cycle to the next, the sun starts a new program of activity within a few weeks that repeats itself in the same pattern approximately every 22 years. Every single month and every single year of the 22-year Hale cycle is characterized by a specific solar activity pattern that affects the Earth’s atmosphere and creates weather trends.
Ms. Veretenenko’s latest publication from the Loffle Institute in Saint Petersburg has described the mechanism of the transformation of varying solar activity via the stratosphere to the troposphere and thus our weather.
Using the start years of the Hale cycles, it is easy to prove solar influence in historical weather data, Larenz shows.
To do this, the weather data from the same approx. 22-year cycle phases, starting with the respective start years of the Hale cycles, are stacked on top of each other. The result:
Every 22 years, extremely high and low annual precipitation totals accumulate in the same phases of the 22-year Hale cycle.
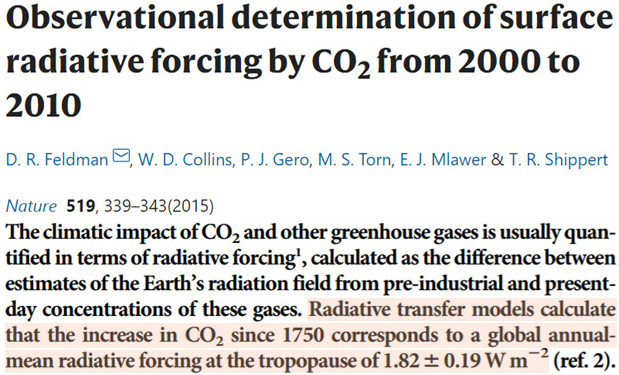
The radiative effect of natural wildfire aerosol forcing alone can be said to fully cancel out the total accumulated forcing from 170 years of CO2 increases in the current climate.
It has been estimated that the total change in climate forcing (radiation imbalance) from the 1750 to present CO2 concentration increase has been 1.82 W/m².
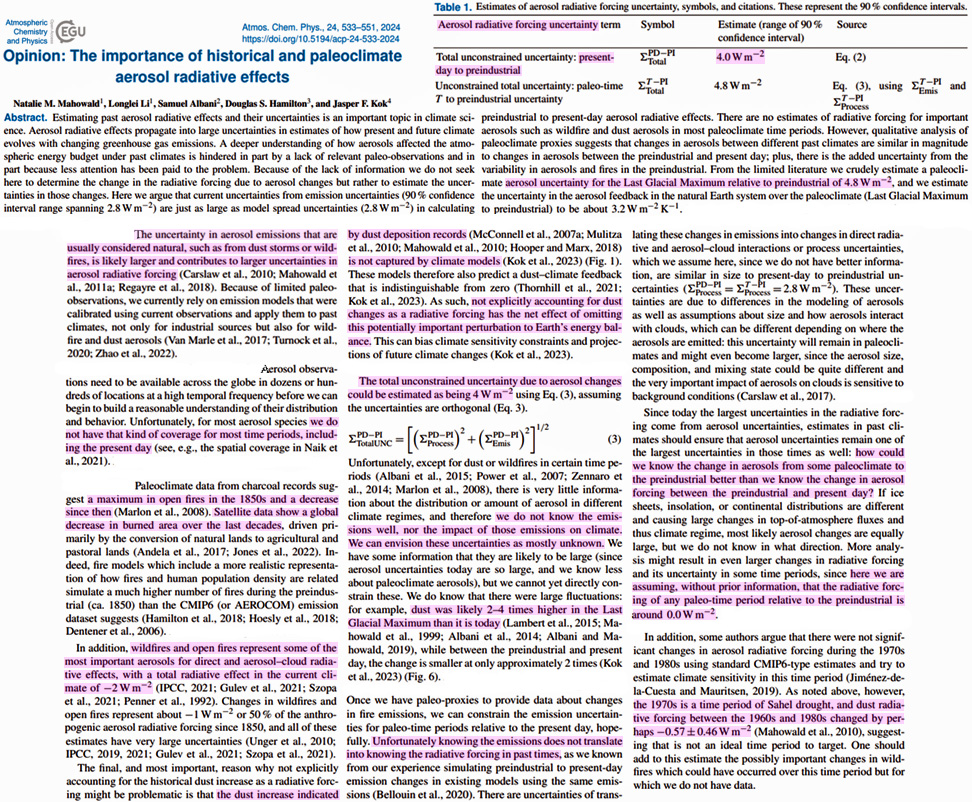
New research suggests today’s climate models omit an “important perturbation to Earth’s energy balance” because they fail to include the natural climate forcing potential from aerosols produced by wildfires and dust loading.
Climate models expressly assume this non-volcanic natural aerosol forcing is not present, or 0.0 W/m², even though it has been estimated that aerosol forcing from wildfire emissions alone – which were much higher during the preindustrial period before declining to today’s levels – deliver a “radiative effect in the current climate of -2 W/m².” Therefore, this natural climate forcing effect can be said to, by itself, fully cancel the surface forcing from the post-industrial CO2 increases.
Furthermore, the estimated 4 W/m² uncertainty in preindustrial-to-present (1850-) aerosol climate forcing from natural wildfire emissions and dust is also over two times larger than 270 years of CO2 concentration increases (1.82 W/m² since 1750). This effectively means that anthropogenic CO2 forcing is too uncertain to clearly separate from natural aerosol forcing.
1) Regarding the natural aerosol forcing uncertainty missing in the models…
“The uncertainty in aerosol emissions that are usually considered natural, such as from dust storms or wildfires, is likely larger and contributes to larger uncertainties in aerosol radiative forcing.”
“There are no estimates of radiative forcing for important aerosols such as wildfire and dust aerosols in most paleoclimate time periods.”
“…dust deposition records [are] not captured in climate models. These models therefore also predict a dust-climate feedback that is indistinguishable from zero. As such, not explicitly accounting for dust changes as a radiative forcing has the net effect of omitting this potentially important perturbation to Earth’s energy balance.”
“…here we are assuming, without prior information, that the radiative forcing of any paleo-time period relative to the preindustrial is around 0.0 W/m².”
“…we do not know the emissions [from wildfires or dust] well, nor the impact of those emissions on climate. We can envision these uncertainties as mostly unknown.”
2) Regarding the larger radiative forcing impact and uncertainty values of natural aerosols than CO2 forcing…
“In addition, wildfires and open fires represent some of the most important aerosols for direct and aerosol-cloud radiative effects, with a total radiative effect in the current climate of -2 W/m².”
“The total unconstrained uncertainty due to aerosol changes [since 1850] could be estimated as being 4 W/m².”
“…dust [radiative forcing] was likely 2-4 times higher in the Last Glacial Maximum [~25,000 to 17,000 years ago] than it is today.”
“From the limited literature we crudely estimate a paleoclimate aerosol uncertainty for the Last Glacial Maximum relative to preindustrial [1850] of 4.8 W/m².”
“Paleoclimate data from charcoal records suggest a maximum in open fires in the 1850s and a decrease since then. Satellite data show a global decrease in burned area over the last decades…”
“…the 1970s is a time period of Sahel drought, and dust radiative forcing between the 1960s and 1980s changed by perhaps -0.57 ±0.46 W/m².”
By continuing to use the site, you agree to the use of cookies. more information
The cookie settings on this website are set to "allow cookies" to give you the best browsing experience possible. If you continue to use this website without changing your cookie settings or you click "Accept" below then you are consenting to this. More information at our Data Privacy Policy


Recent Comments