Germany's Power Supply Will Likely Be Plagued By Supply Gaps Until 2030, Institute Finds

Germany’s Power Supply Will Likely Be Plagued By Supply Gaps Until 2030, Institute Finds

Energy Institute: supply gaps in the electricity market possible by 2030

By Die kalte Sonne 
(Translated by P. Gosselin)

The study by the Institute of Energy Economics at the University of Cologne (EWI) reads differently than the very optimistic forecasts one so often reads in the media.

With the expansion of renewable energies, the weather dependency of electricity generation in Germany is increasing. A new analysis shows that the security of electricity supply in this decade is currently not guaranteed in all extreme weather situations. Decisive factors here include the rising demand for electricity due to progressive electrification, the dismantling of fossil power plant capacities and the relatively slow expansion of renewable energies.

This is the result of a new analysis by the Institute of Energy Economics at the University of Cologne (EWI) on behalf of the Society for the Promotion of the Institute of Energy Economics at the University of Cologne. In the publication ‘Analysis of Supply Security up to 2030’, a team from the EWI examines in which (historical) weather situations the power supply is secure at all times and under which circumstances supply gaps could occur in the course of this decade.”

It’s apparent the scientists also do not assume that we have “storage facilities galore” like activists such as Claudia Kemfert often claim. For the study, weather data were taken from a period of 34 years. That is statistically climate.

An analysis of weather data from 1982 to 2016 shows that supply gaps could occur in particular in weather situations with strongly below-average wind availability in northern and central Europe and significantly limited solar radiation in southern Europe. These two weather anomalies occurred in combination, for example, in January 1997 and in December 2007 over an extended period of at least seven days.

For such extreme weather situations for power generation, the EWI team analyzed and quantified the possibility of supply gaps for the years 2025 to 2030 in different scenarios of power system development. In doing so, they examined different paths to coal phase-out, renewable energy expansion, availability of electricity imports and storage capacities, and the degree of electrification between 2025 and 2030.”

Keyword “storage facilities galore”: For natural gas and hydrogen, they also seem to have room for improvement, as reported by Die Welt. According to Müller:

The capacities for storing natural gas and hydrogen are not sufficient, according to the Federal Network Agency. ‘When the immediate crisis is over, Germany should take another close look at whether we actually have the storage facilities everywhere that we would like,’ says the agency’s head, Klaus Müller, in an interview with the Augsburger Allgemeine newspaper.

In the future, hydrogen will be increasingly needed in addition to natural gas. According to Müller, the development of a hydrogen network must begin now. The Federal Network Agency, the government and many municipal utilities and energy suppliers are already planning this. Germany has a widely ramified gas network that can be used in principle, he said. ‘But it can’t simply be converted one-to-one. Natural gas out and hydrogen in, that doesn’t work without any further ado.'”

====================================

Note from NTZ: The way things are going now, the grid probably will crash very soon, and so the government will have to come out of its green energy wet dream sooner than later. And even if the country managed to convert over to a green energies/hydrogen supply, it likely would be costly and extremely uncompetitive. This too would lead to a forced wake up from the green energies wet dream.

Colder, Wetter Than Normal September Pushes German Gas Consumption +14.5%, Winter Gas Outage Looms!

Sudden mid September cold snap forces Germans to turn on the heat early…consume 14.5% more gas than previous years…”wettest September since 2001″…gas shortage in winter “difficult to avoid”

Germany’s heating season gets an early start as cold snap hits. (Symbol photo by P. Gosselin) 

With Russia’s gas supply to Europe having practically come to a standstill, German authorities have begun pleading for its citizens to drastically cut back on their natural gas consumption immediately. “With a little luck, we’ll make through the winter,” said Economics Minister Robert Habeck, as Germany’s energy crisis deepens to alarming dimensions.

Habeck then expressed hopes for a mild winter. But unfortunately climate warming hasn’t cooperated over the past two weeks, failing to show up in September this year. With temperatures diving steeply last week, Germany’s mean September temperature is ending up almost half a degree cooler than normal, according the preliminary results from the DWD German national weather service.

“The mean temperature in September 2022 was 13.4 degrees Celsius (°C),” reported the DWD. Compared to the current reference period 1991 to 2020, the negative deviation was 0.4°C.

Early heating season

The bad news is that the recent cold has caused gas consumption to surge 14.5% higher compared to the previous years. According to the country’s Federal Network Agency: “While some residential and commercial gas consumption was well below average consumption levels in previous years through mid-September, last week’s 483 GWh/week was well above the 2018-2021 average (422 GWh/week; +14.5 percent).”

Communist-style shortages 

“Savings will have to take place even if temperatures continue to fall,” explained Federal Network Agency head Klaus Müller. He warned: “Without significant savings in the residential sector as well, it will be difficult to avoid a gas shortage in winter.”

Wettest September since 2001

There has been some good news: drought-stricken Germany got relief as September saw around 100 liters per square meter (l/m²) of precipitation on average – about 155 percent of the 1991 to 2020 reference period (64.5 l/m²).

“As a result, there was finally a marked easing of the situation in the drought-stricken regions,” writes the DWD press release. “It was the wettest September since 2001, with monthly totals of over 200 l/m² in the low mountain ranges and the Alps. At the highest altitudes, the first flakes even fell.”


There Is No Detectable Link Between Greenland’s Climate And Atmospheric CO2 Changes

Greenland’s climate changes are remarkably uncorrelated with climate model expectations and changes in atmospheric CO2.

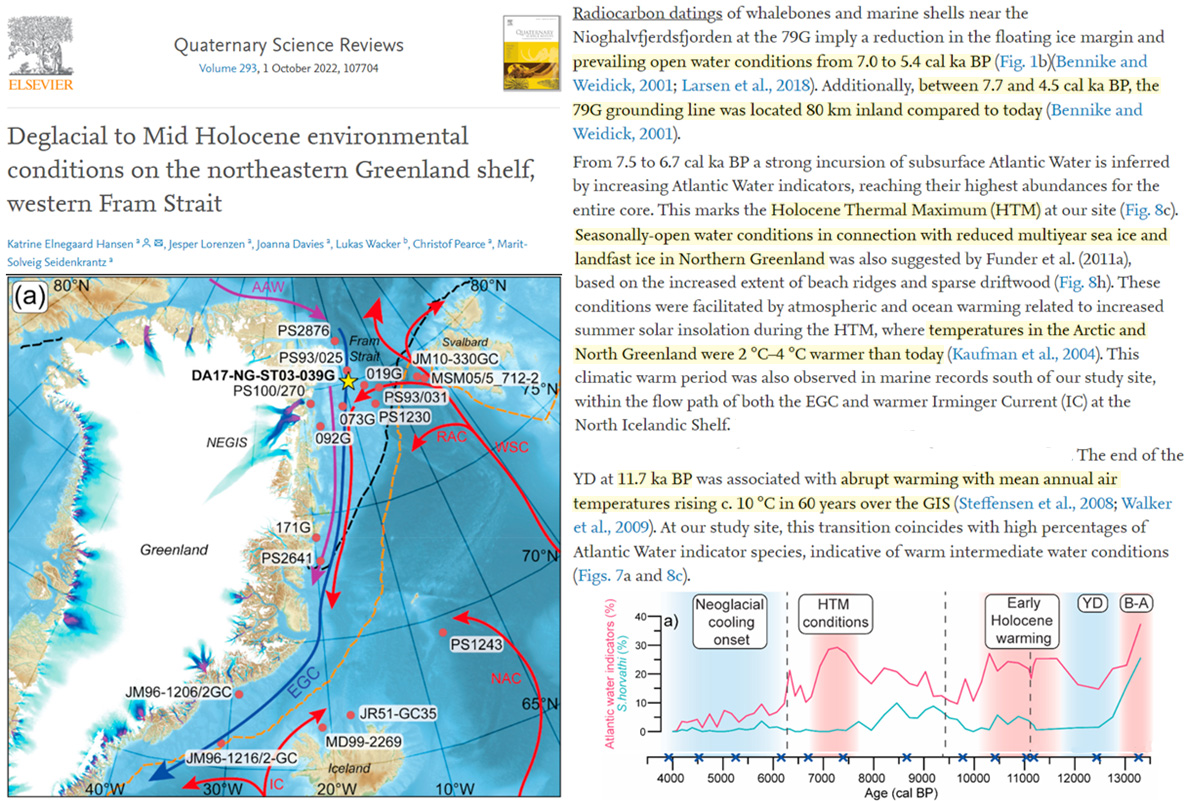
When CO2 levels were in the mid-200s parts per million (11.7 to 4.5 thousand years ago) the Arctic and northern Greenland were 2-4°C warmer than now, ice margins were 80 km behind today’s, ice-free open water conditions prevailed, and Greenland warmed 10°C in just 60 years (Elnegaard Hansen et al., 2022)

Image Source: Elnegaard Hansen et al., 2022

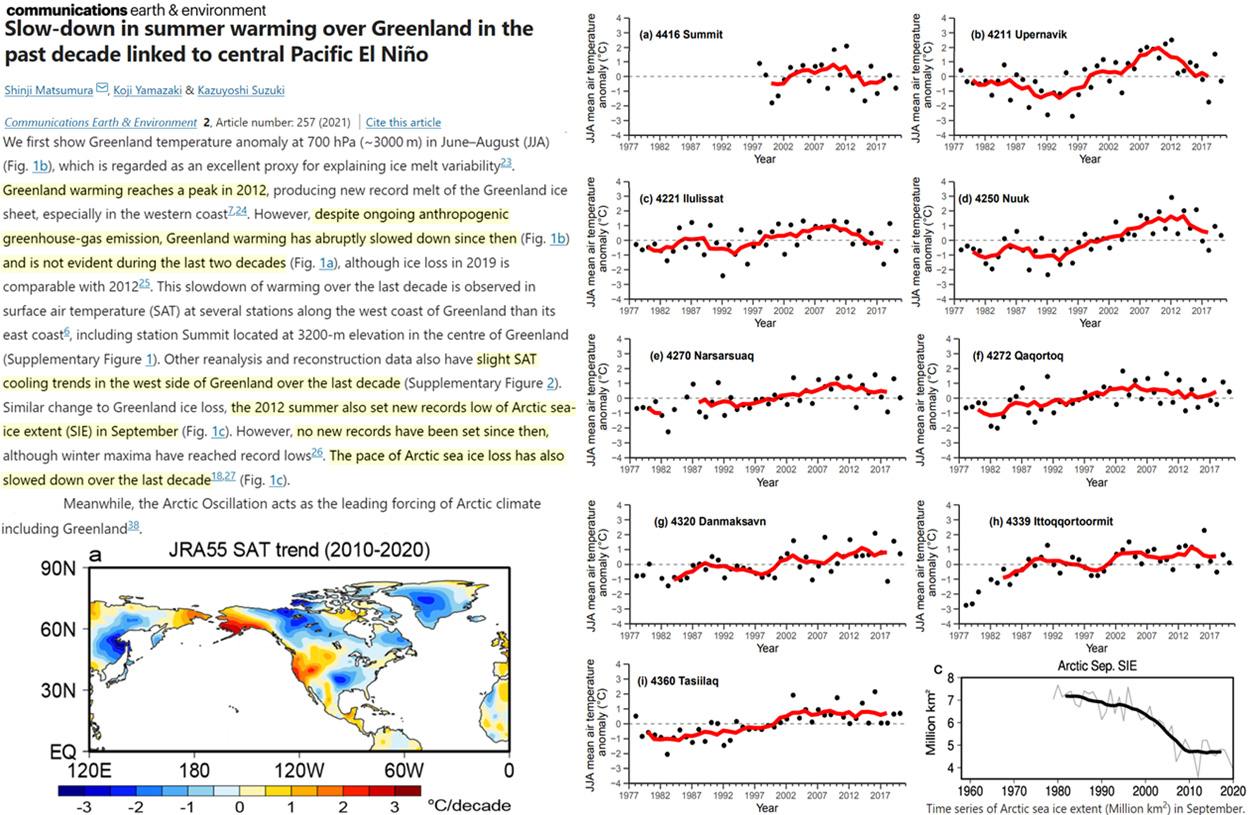
In the last two decades, as atmospheric CO2 has increased by 25 ppm, Greenland warming “is not evident” (Matsumura et al., 2022). Instead, temperature stations document cooling trends.

Image Source: Matsumura et al., 2022

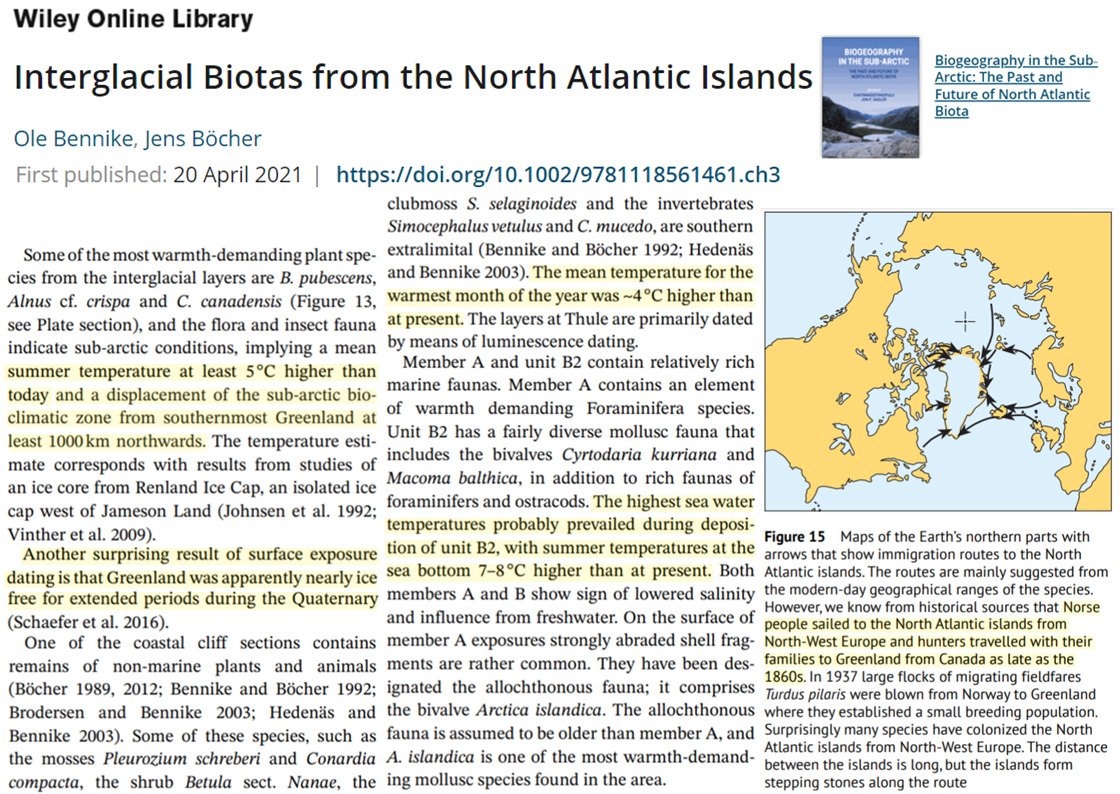
Past interglacial CO2 levels of only 280 ppm were associated with a “nearly ice free” Greenland and the presence of flora and fauna in subarctic terrestrial environments 1000 km northwards of where they can survive today, implying “at least 5°C higher temperatures” (Bennike and Böcher, 2021). Summer sea water temperatures were as much as “7-8°C higher than at present”.

Image Source: Bennike and Böcher, 2021

The assumption that Greenland’s climate (and thus ice sheet melt and associated sea level rise) can be linked to changes in atmospheric CO2 is contradicted by paleoclimate evidence and even modern instrumental temperature records.

Cardiologist Aseem Malhotra Gives Ray Of Hope In The Face Of Widespread Corrupt Science

Climate science has a lot of similarities with the science surrounding COVID prevention and treatment.

Both are awash with glaring contradictions, absurdities, corruption, censorship, propaganda, scientific bullying and coercion. But now one leading voice has courageously changed his mind and come out against the controversial vaccines.

“A reanalysis of randomised control trial data from both Moderna and Pfizer revealed one is more likely to suffer a serious adverse event from the COVID 19 vaccine than to be hospitalised with COVID 19,” Malhotra says.

“In part 2 of the paper, I aim to get to the root cause and understand why authorities and sections of the medical profession supported unethical, coercive and misinformed policies such as vaccine mandates and vaccine passports, undermining ethical evidence-based medicine and informed consent.”

“In conclusion of those papers, there is a strong ethical, scientific and moral case to be made that the COVID 19 vaccine rollout must stop immediately until more data has been released for fully independent scrutiny.”

Dr. Mahotra’s video announcement is a sign there’s still hope for true science and that scientific fraud is finally being exposed and challenged.

But we are not naïve and know this is far from being put right. We will keep pressing on until the true science emerges.


Grid Expert’s Dire Warning: “All Of Europe’s Power Supply At Risk”..30% Of Computers Could Be Destroyed

German Auf1 site here interviews blackout expert Robert Jungnischke on Europe’s growing threat of a unprecedented wintertime blackout. Experts are almost unanimous that a blackout will occur, the only question that remains is when and how long it will be.

Power grid and blackout expert Robert Jungnischke. Image cropped here

The gas supply bottleneck Europe is intensifying as the weather turns colder earlier than expected. People are preparing by buying electric fan heaters, hoping they’ll be able to keep warm if the gas supply runs out. The problem however, is that these millions of electric fan heaters sold in Europe will end up burdening an already extremely precarious power grid even more.

Already German officials are warning the country “may be facing ‘rolling blackouts’ over the coming winter months” as not only Germany’s but also Europe’s power grid teeter on the brink.

According to Robert Jungnischke, a blackout expert and consultant, many companies and people are poorly prepared, or not prepared at all. So when the blackout arrives, it will be too late to for them. The consequences would be dire. Once a a blackout hits, the total system failure that it causes cannot be fixed so quickly. The damage in terms of economics and lives would be enormous.

Electric chair for computers and electronics

According to Jungnischke, citing power experts, just rebooting the power grid would destroy about 30% of electronic devices such as computers.

The rebooting of an entire power grid after a blackout is a complicated task, as the supply has to match the demand. Both would have to ramp up in unison. Jungnischke explains:

After a blackout, the power gets ramped up, but we have a huge problem. The problem is that there is no load. As I said earlier, power is tied to consumption and the power is regulated accordingly. I have a problem when power needs to be ramped up but there’s not yet any demand. That means the power fluctuates strongly and strongly fluctuating power is death for electronics. That means experts calculate about 30% of computers will be damaged during the ramp up of the power grid.”

He adds that the dependence on solar and wind energy puts not only the German power grid at risk, but also the power supply of all of Europe.

The economic damage resulting from a major blackout would be crippling. Chaos would ensue for weeks or months.


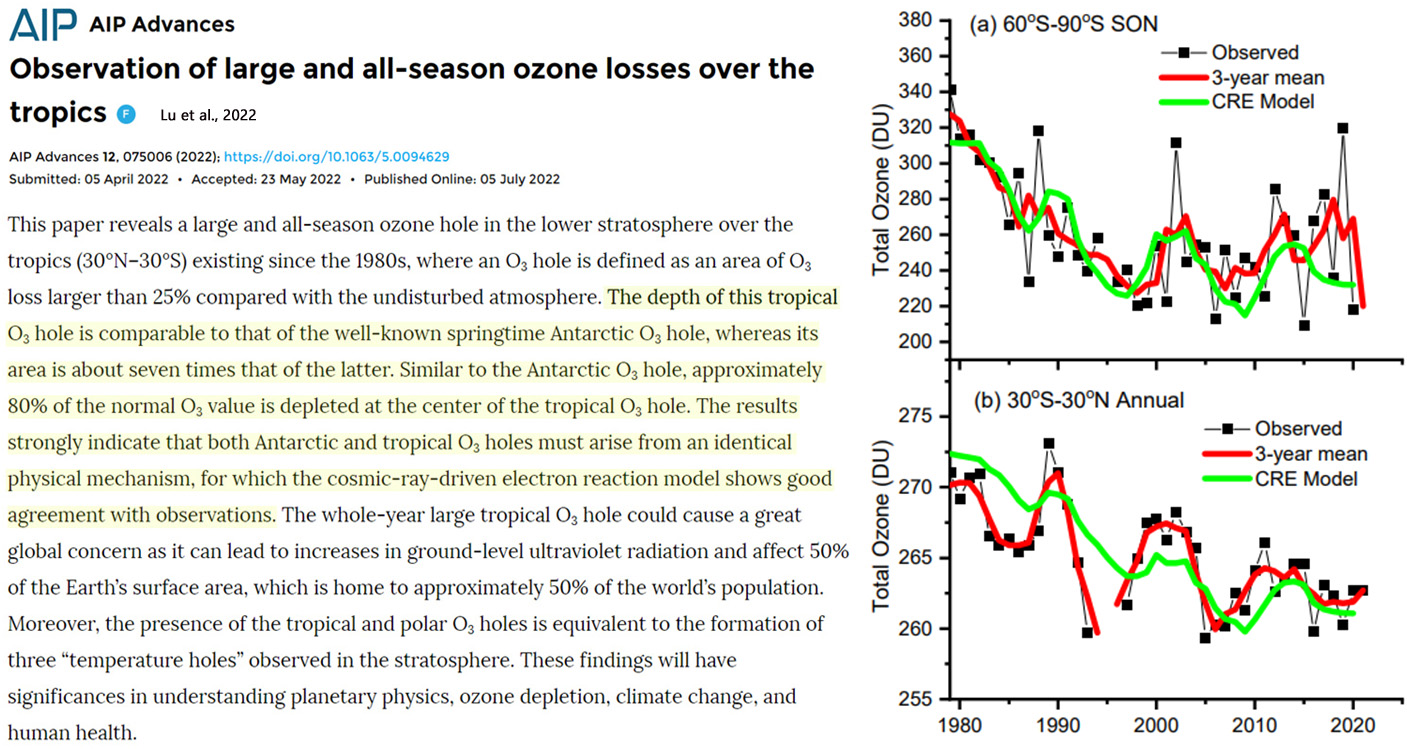
Gigantic Ozone Hole – 7 Times Larger Than Antarctica’s – Widens Over The Tropics

The increasing loss of ozone (O3) from 3o°N – 30°S has steadily accelerated since the early 1980s despite the 1987 Montreal Protocol’s ban on so-called “ozone depleting substances” like chlorofluorocarbons (CFCs). Once again this suggests human activity does not drive ozone losses.

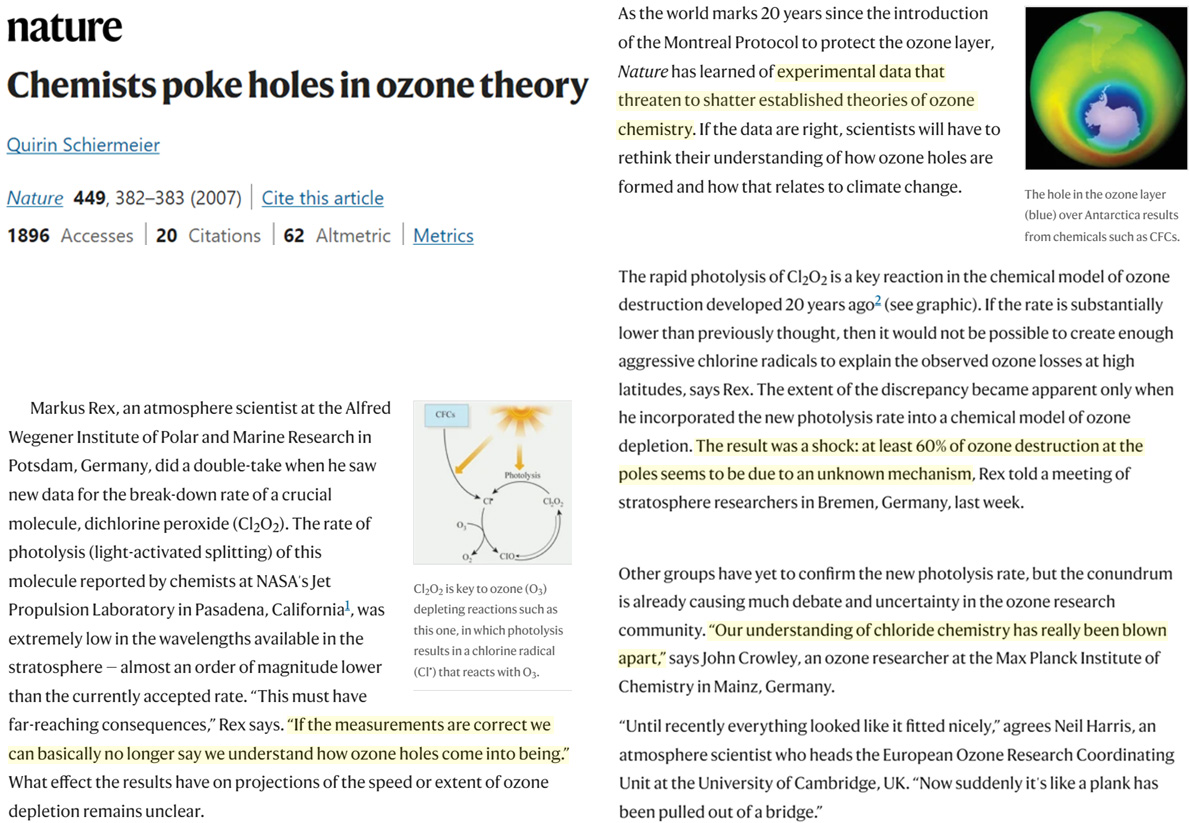
Twenty years after the Montreal Protocol agreement limiting or banning CFC use scientists reported an order-of-magnitude-sized error in molecular chemistry measurements that threatened to severely undermine the commonly accepted anthropogenic explanation for how ozone depletion occurs.

With the new measured evidence, a leading ozone researcher proclaimed the scientific “understanding of chloride chemistry has really been blown apart,” as “we can basically no longer say we understand how ozone holes come into being.”

Image Source: Schiermeier, 2007

But then, in the ensuing years after the measurement error had been exposed, there was . . . silence. The discovery of a molecular rate change “substantially [ten times] lower than previously thought” was not brought to the public’s attention again. Ostensibly due to a reluctance to admit they may be wrong, scientists just seemed to . . . move on.

Now, a new study reports the O3 hole over the tropics is 700% larger (area) than the much more famous O3 hole over Antarctica (60°S – 90°S).

Its size has continued widening after the 1987 governmental agreement to severely limit CFC use, which again seems to contradict claims that we humans can control O3 levels with our emissions.

The authors suggest the same non-anthropogenic physical mechanism – cosmic ray-elicited electron reaction – driving O3 losses over Antarctica may also be driving the O3 losses for 3o°N – 30°S.

Image Source: Lu et al., 2022

The ozone hole narrative and the presumption that governmental policies are what determine how small or large the hole gets would appear to be analogous to the current climate debate and its connection to the governmental push to dramatically limit CO2 emissions.

German Industry Collapse: Companies Leaving In Droves…”Can No Longer Bear Cost Explosion”!

Some industries rely on affordable energy to remain competitive on global markets. But in Germany, this lifeline of energy has become a luxury that many can no longer afford – even renowned companies who in the past had weathered two world wars and a pandemic. 

After years of catastrophic energy policy mismanagement and green energies dogmatism, the bill is coming due. A growing number of German companies are saying ‘auf Wiedersehen‘ or simply shuttering their operations. Others are preparing drastic measures.

German news site Business Leaders here has since begun a running list of companies that are packing up, or shutting down or moving their production and high paying jobs to friendlier business environments.

Business Leaders here reports:

Germany is losing important sectors of the economy and industry. Those who still survived the Corona measures are now facing massive increases in energy prices. Many businesses, the self-employed and companies can no longer bear the cost explosions. In addition, there is the danger of blackouts due to a power shortage. The consequences are insolvencies or the migration of companies abroad. This does not only affect the manufacturing industry. An overview of which companies want to leave Germany – or stop production here – you will find the current list further down in the article.

What follows is Business Leaders’ list of companies that are shutting down operations, declaring insolvency in Germany, or planning drastic contingency measures (e.g. layoffs, production stoppages) due at least in large part to insanely high energy prices:

  • Dr. Schneider Unternehmensgruppe
  • Hellma Materials GmbH, W
  • Borealis AG
  • Yara International
  • Paul Hartmann AG
  • Heinz-Glas & Plastics Group (founded in 1622!)
  • Ford
  • BMW AG
  • Vitesco Technologies Group AG
  • Kostal Automobil Elektrik GmbH & Co. KG
  • Privatbrauerei Bischoff GmbH + Co. KG
  • Aryzta AG
  • Villeroy & Boch AG
  • Neue Porzellanfabrik Triptis GmbH
  • Dachziegelwerke Nelskamp GmbH
  • Holcim AG
  • SKW Stickstoffwerke Piesteritz
  • Linde GmbH / Linde plc
  • Hakle GmbH
  • Ludwig Görtz GmbH
  • DMV Deutsche Metallveredelung GmbH
  • ROT Rickert Oberflächentechnik
  • Baumann Federn AG
  • Budel-Hütte
  • Aurubis AG –
  • Stahl-Holding Saar
  • Thyssen-Krupp Steel Europe
  • Salzgitter
  • Lech-Stahlwerke
  • Waelzholz
  • Trimet
  • Swiss Steel
  •  Glencore
  • ArcelorMittal –
  • Bremkamp Elastic GmbH
  • Cristal d’Arques
  • Nyrstar Budel
  • Aldel
  • Ascometal (Swiss Steel Group)

This list was last updated on September 14, according to Business Leaders, which reports it will keep updating. Analysts fear this is only the beginning and that things are going to get far bloody worse.

Half say their existence is threatened

In a recent survey by the German Association of Small and Medium-Sized Businesses (BVMW), almost half of Germany’s medium size companies said: “the explosion in energy prices was threatening the existence of the company.” This was reported by the Funke Mediengruppe, according to Business Leaders.

Almost three-quarters of the companies surveyed said they were “suffering from the current prices for energy.”

The entire article by Business Leaders is here (in German).


Trend Change? Greenland Ice Mass Loss Has Been Decelerating Since 2012

Greenland’s Ice Mass Balance 2021/22

By Die kalte Sonne

Autumn has begun. Time for the Greenland mass balance.

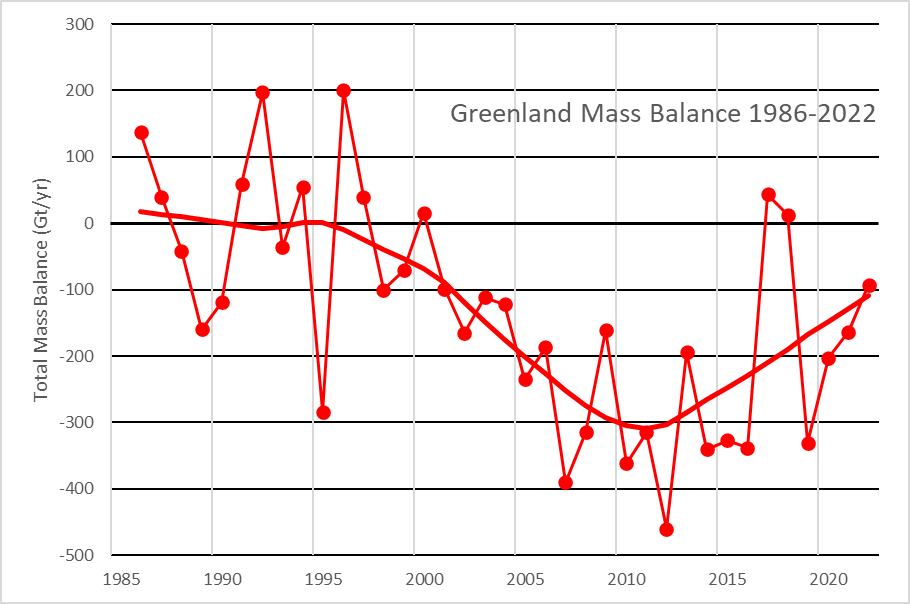
We have digitized the Polar Portal’s graph of the accumulated surface mass balance and have come up with a value of 467 Gt. That’s 100 Gt or 27% above the 1981…2010 mean! Together with the melting of icebergs (assuming the value of the previous year, which was already 10% more than that of 2020 ) this results in approximately the representation below, which was included in the publication until the report 2020.

In 2021, one has probably omitted for reasons, perhaps the jump was difficult to explain by the calving of icebergs?

The total mass balance is very likely -100 Gt. An “accelerated” thawing of the Greenland ice sheet is not to be recognized. If one accumulates the mass loss, one sees the “braking” very nicely. Acceleration occurred until 2012.

Accumulated Greenland ice loss in gigatonnes since 1986.


Germany’s “Tenfold Increase In Gas And Electricity Prices” Is Driving Out Industry

Europe’s energy policy is creating jobs – for USA  

What leaves once, will not come again. While energy prices in Europe are going through the roof, they remain moderate in the USA. This will have serious consequences for energy-intensive industries.

The Wall Street Journal (paid article) is already rubbing its hands together for the US economy. It is twice beneficial: high prices for LNG exports and new jobs in the future. It’s Win/Win – Lose. One of the losers for Germany is Areclor-Mittal. Now they are turning down the first blast furnace. Here, too, the USA is profiting. The FAZ reports:

Arcelor-Mittal, the world’s largest steel producer, is shutting down two production facilities at the end of September due to high energy prices in Germany. “Until further notice,” one of the two blast furnaces at the plate steel site in Bremen will be shut down. And the direct reduction plant at the Hamburg long steel mill is also to be shut down. In addition to the already high costs for gas and electricity, the gas surcharge planned from October will place a further burden on the competitiveness of energy-intensive plants, it says in justification. ‘With a tenfold increase in gas and electricity prices, which we had to accept within a few months, we are no longer competitive in a market that is 25 percent supplied by imports,’ Germany CEO Reiner Blaschek is quoted as saying in a statement from Arcelor-Mittal.

In order to avoid gas consumption in Hamburg, the precursor iron is now being purchased from America in order to be able to continue production – more cheaply, but with a higher CO2 footprint. Reduced work hours is also being introduced at the production sites in Duisburg and Eisenhüttenstadt due to the difficult situation.”


How Can The Globe Be Warming When Most Of The Southern Hemisphere Isn’t?

New research continues to document non-warming and even “robust cooling” trends for entire regions of the Southern Hemisphere in recent decades.

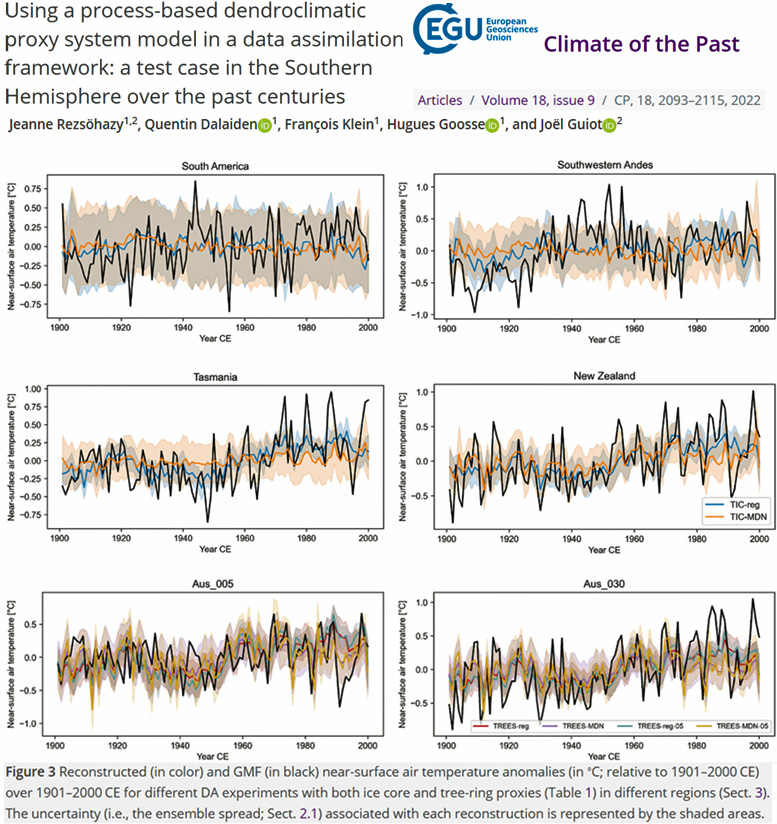
Land surface temperature data compilations from the Southern Hemisphere (South America, Southwestern Andes, Tasmania, New Zealand, Australia) indicate that any warming during the 20th century occurred before 1980, with no obvious net warming since (Rezsöhazy et al., 2022).

Image Source: Rezsöhazy et al., 2022

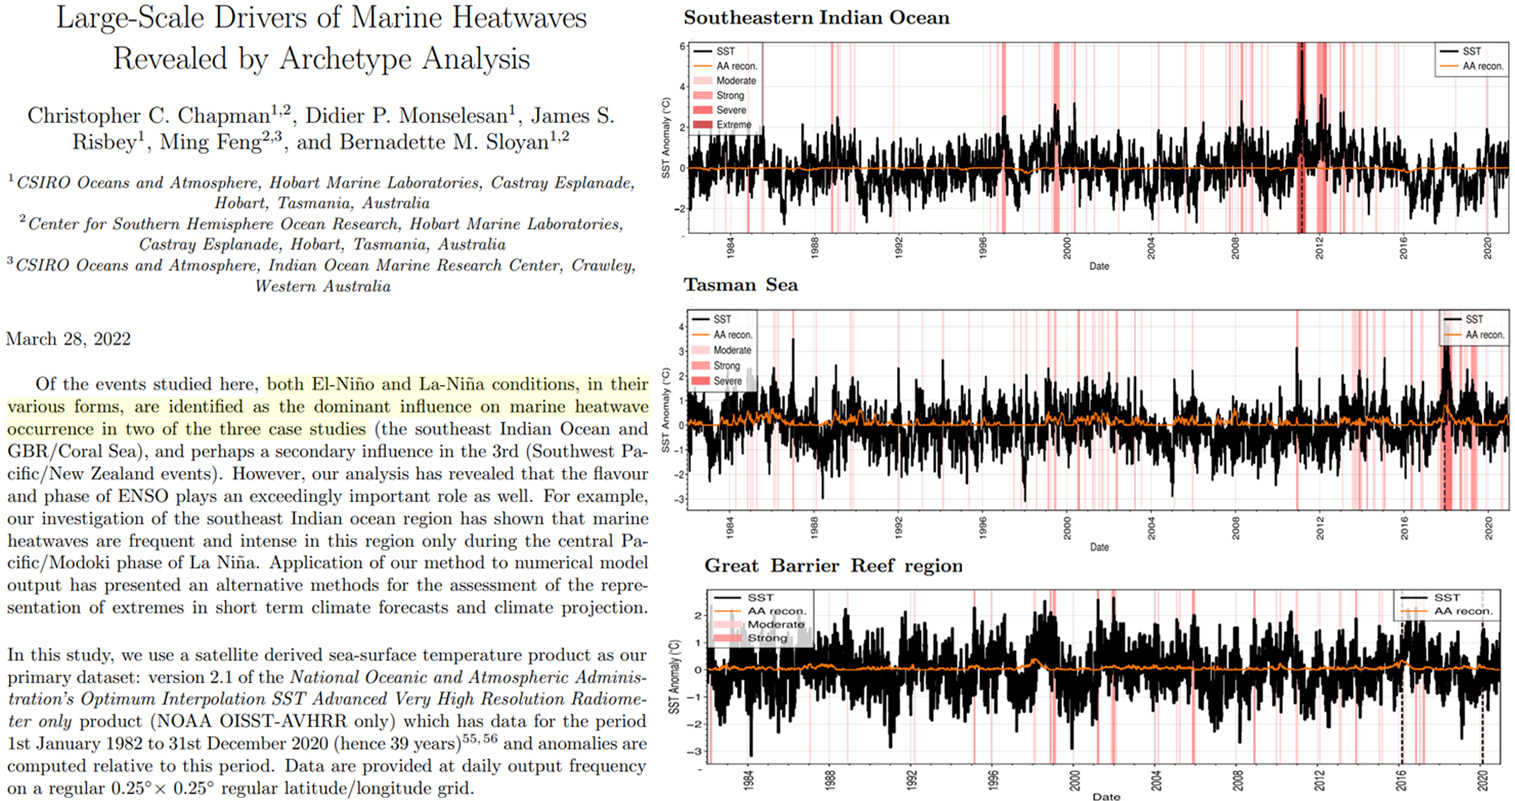
Sea surface temperature data from the Southeastern Indian Ocean, Tasman Sea, and Great Barrier Reef region indicate no net warming since 1982 (Chapman et al., 2022).

Image Source: Chapman et al., 2022

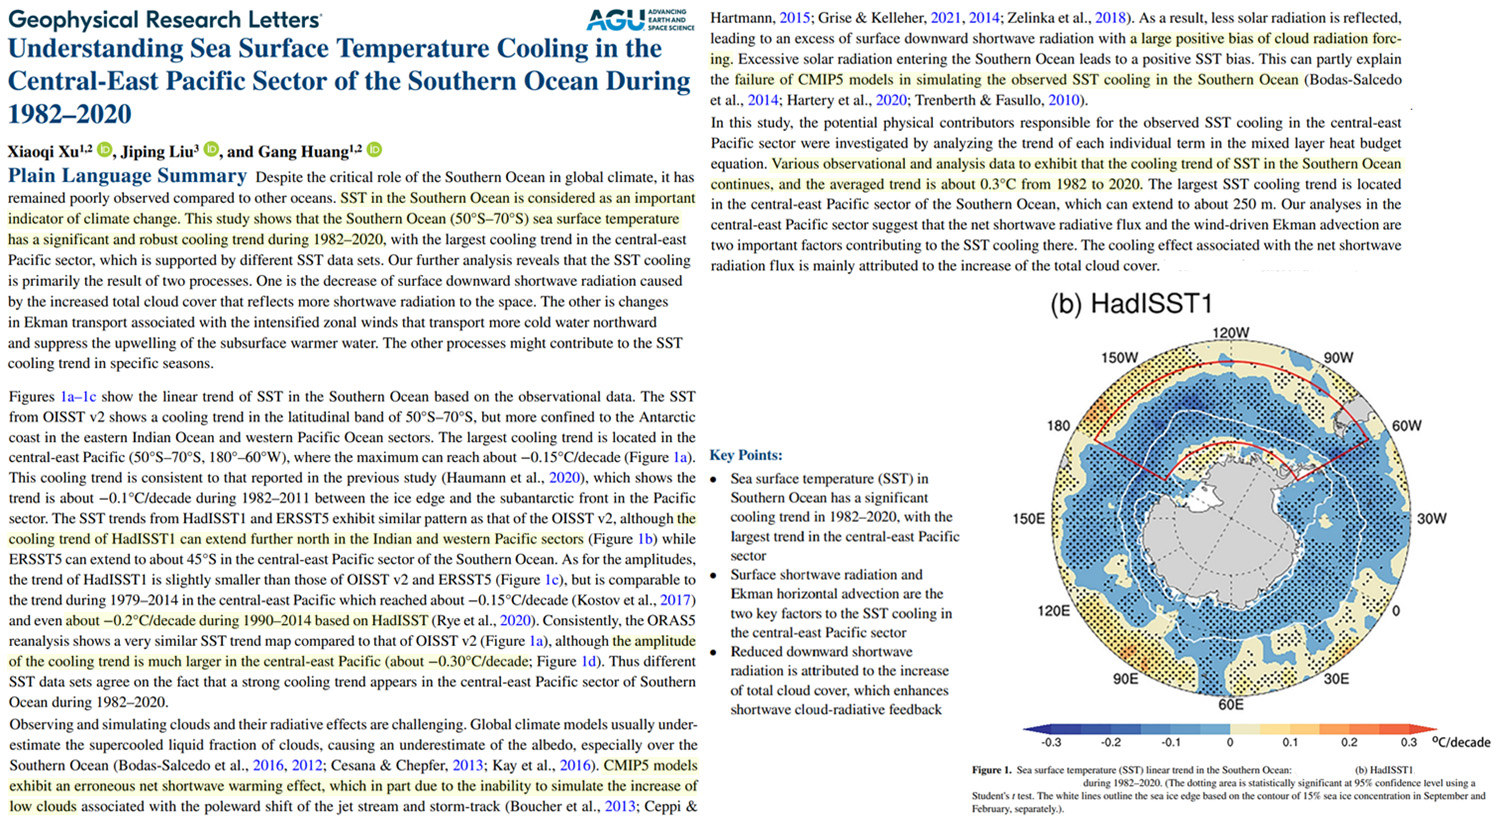
Another new study (Xu et al., 2022) suggests the Southern Ocean (50°S–70°S) has been cooling for the last 40 years, with amplitudes ranging from -0.1°C to -0.3°C per decade in some regions.

“SST in the Southern Ocean is considered as an important indicator of climate change. This study shows that the Southern Ocean (50°S–70°S) sea surface temperature has a significant and robust cooling trend during 1982–2020”

Image Source: Xu et al., 2022

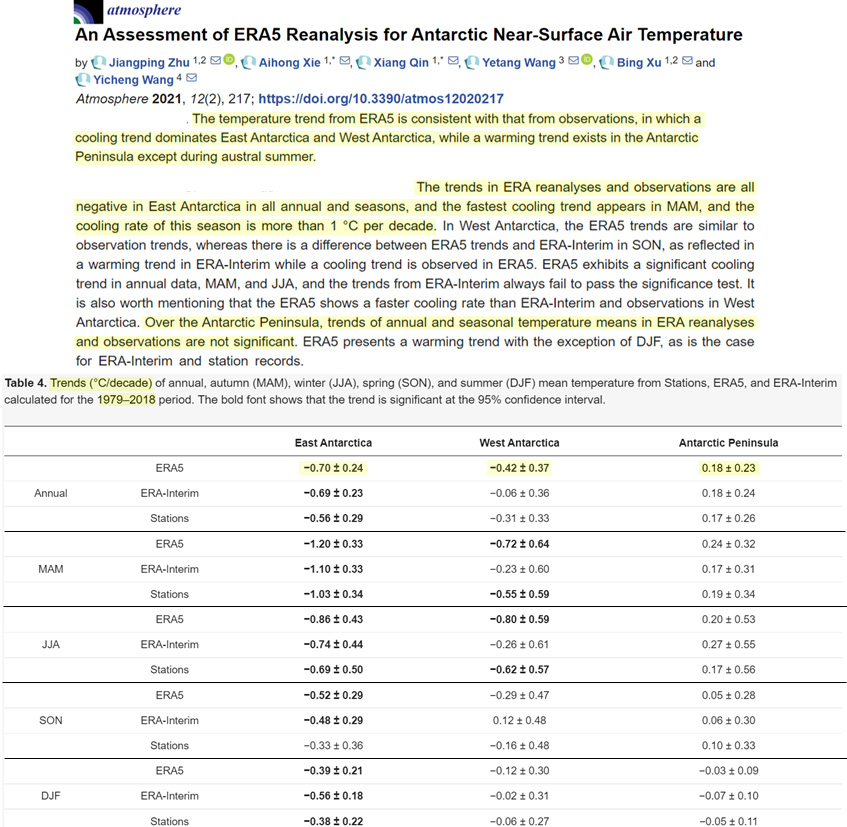
A 2021 study reported a profound cooling trend for most of Antarctica in recent decades, with amplitudes of -2.8°C for East Antarctica and -1.68°C for West Antarctica during 1979-2018.

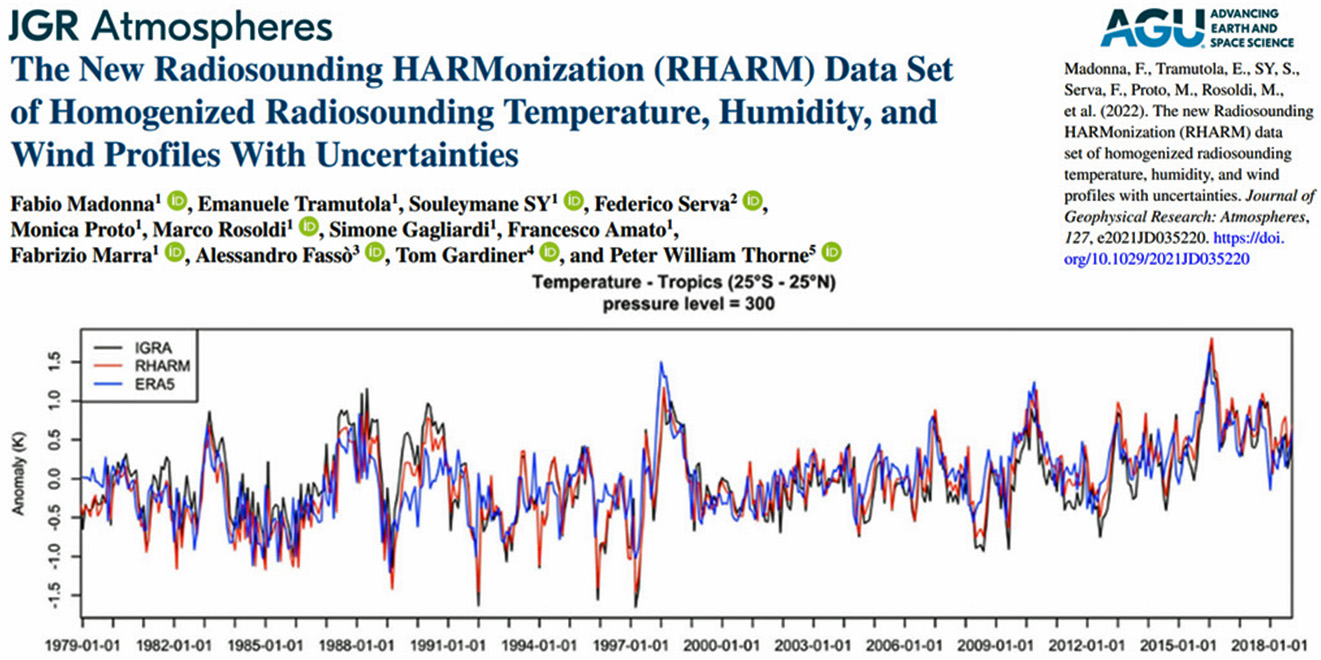
Temperature trends in the tropics (25°N to 25°S) have been mostly flat since 1979 (Madonna et al., 2022).

Image Source: Madonna et al., 2022

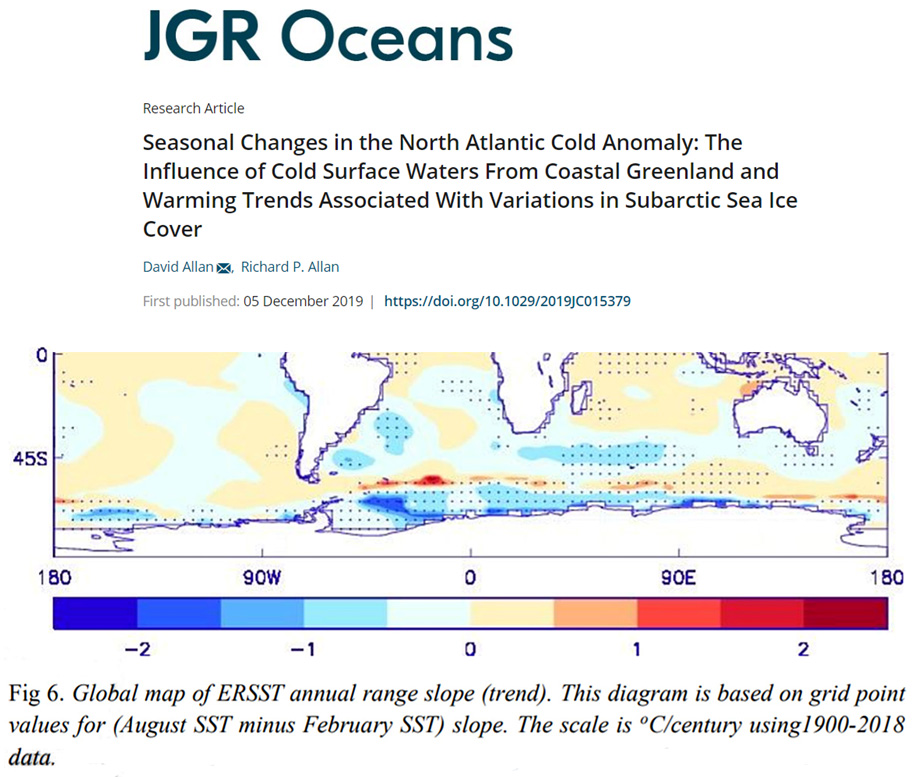
About 80% of the Southern Hemisphere’s surface is water. Sea surface temperature trends for the entire Southern Hemisphere suggest no net warming from 1900-2018 (Allan and Allan, 2019).

Image Source: Allan and Allan, 2019

If most of the Southern Hemisphere has not been warming, why is it called global warming?

Natural Oceanic Cycles Behind Heavy East Australia Rains, New Study Finds

East Australia got hit by lots of rain in February earlier this year, and the media of course blamed it all on manmade climate change.

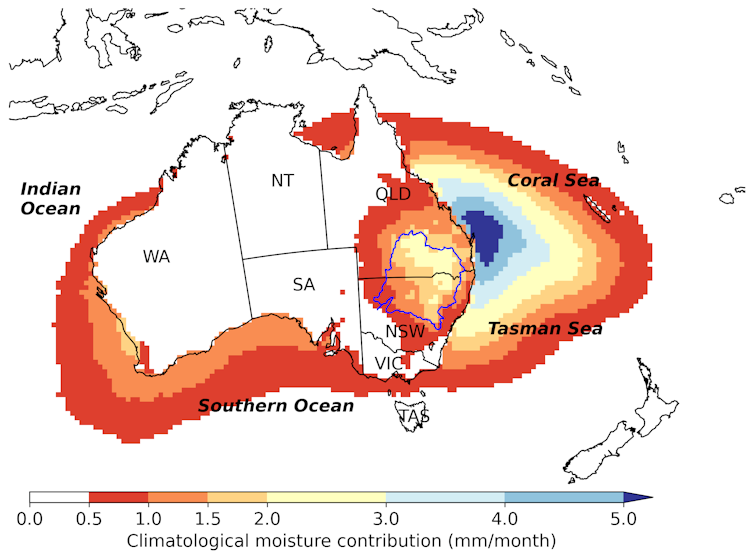
Now a new study by Holgate et al (2022) titled “The Impact of Interacting Climate Modes on East Australian Precipitation Moisture Sources” shows East Australia’s rains are directly tied to natural oceanic patterns.

Hat-tip: EIKE.

The paper’s abstract summarizes that east Australia precipitation is driven by multiple interacting climate modes and that the El Niño–Southern Oscillation (ENSO) modifies the supply of evaporative moisture for precipitation and that this is modulated by the Indian Ocean dipole (IOD) and southern annular mode (SAM).

Eastern Australian rainfall moisture supply.

Sources of moisture in eastern Australia. Source: Holgate et al, 2020

The authors describe how La Niña facilitates local precipitation generation whereas El Niños are associated with below average precipitation.

In an article appearing in the academic CONVERSATION here, the authors noted there are climate oscillations at play in the modulation of east Australia rainfall, primarily the El Niño-Southern Oscillation (ENSO), the Southern Annular Mode (SAM), and the Indian Ocean Dipole (IOD):

“Like swings in a character’s mood, each climate mode has positive, negative and neutral phases. Each affect Australia’s weather in different ways,” write the authors. “La Niña brings wetter conditions to eastern Australia. The IOD’s negative phase, and SAM’s positive phase, can also bring more rain.”

In other words, rains and dry periods depend on what the oceanic cycles are doing, and not CO2. Understanding the key natural cycles is key.

However, the authors do go on to claim that extreme La Niña and El Niño events and weather systems “are expected to worsen due to greenhouse gas emissions”, but that is speculative at best. Co2 does not drive ocean cycles and modes.

When “expected” never shows up

We remind that also Atlantic hurricanes too “are expected to worsen due to greenhouse gases”, yet the opposite has in fact been the case over the past decades. Also the Arctic was expected to be ice-free in the summer by now. But that too has not happened and late summer sea ice there has trended upwards moderately over the past 15 years.

Oceans were expected to warm as well, but as Kenneth noted yesterday, that too has not been necessarily the case. New research suggests the bottom half (2 km to the bottom) of the Pacific has been robustly cooling since 1993!

Prof. John Schellnhuber, former director of the PIK Potsdam Institute, also “expected” the Himalayas to lose their glaciers by 2030, yet that was glaringly exposed as a real doozy of a climate bluff as well.

So when it comes to weather extremes and future projections, it’s really important to separate the science from the climate scamming.


Most Of The Pacific Ocean’s Volume Has Undergone Intensifying Cooling Since 1993

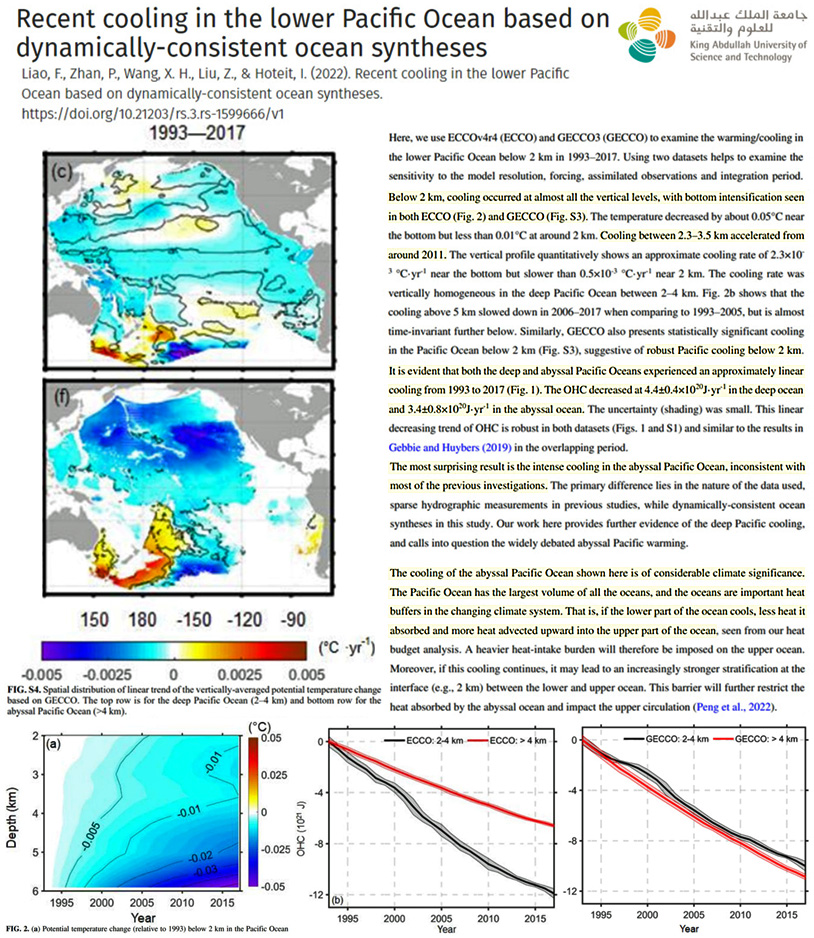
The Pacific Ocean is 5 to 6 km deep. New research indicates the bottom half (2 km to the bottom) of the Pacific has been robustly cooling since 1993. 

A new preprint details the “surprising” Pacific cooling pattern from two ocean heat content (OHC) datasets over the 1993-2017 period.

Most OHC records only extend to the first 2 km of the ocean. Analyses of trends in the deeper ocean indicate intensified cooling from 2 km to the abyssal waters, or for well more than half the Pacific Ocean’s volume.

Image Source: Liao et al., 2022
The thermal state from 1993–2017 in the lower Pacific Ocean (below 2 km) was investigated using two dynamically-consistent syntheses. We show a robust and bottom-intensified cooling. This Pacific cooling is mainly determined by the meridional heat exchange with the Southern Ocean and the vertical heat advection.”
It is evident that both the deep and abyssal Pacific Oceans experienced an approximately linear cooling from 1993 to 2017 (Fig. 1). The OHC decreased at 4.4±0.4×10²⁰J·yr-1 in the deep ocean and 3.4±0.8×10²⁰J·yr-1 in the abyssal ocean. The uncertainty (shading) was small. This linear decreasing trend of OHC is robust in both datasets (Figs. 1 and S1) and similar to the results in Gebbie and Huybers (2019) in the overlapping period.”
Below 2 km, cooling occurred at almost all the vertical levels, with bottom intensification seen in both ECCO (Fig. 2) and GECCO (Fig. S3). The temperature decreased by about 0.05°C near the bottom but less than 0.01°C at around 2 km. Cooling between 2.3–3.5 km accelerated from around 2011. The vertical profile quantitatively shows an approximate cooling rate of 2.3×10⁻³°C·yr-1 near the bottom but slower than 0.5×10⁻³ °C·yr-1 near 2 km. The cooling rate was vertically homogeneous in the deep Pacific Ocean between 2–4 km. Fig. 2b shows that the cooling above 5 km slowed down in 2006–2017 when comparing to 1993–2005, but is almost time-invariant further below. Similarly, GECCO also presents statistically significant cooling in the Pacific Ocean below 2 km (Fig. S3), suggestive of robust Pacific cooling below 2 km.”

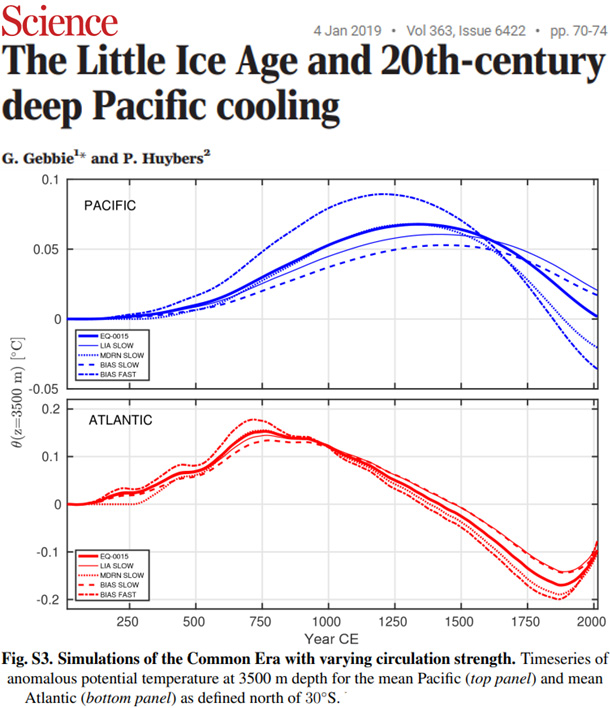
Another recent study (Gebbie and Huybers, 2019) also reported the deeper ocean cooling has been ongoing throughout the modern period in the Pacific, and it has only modestly changed course (from cooling to warming) in the Atlantic in the last century. The Medieval Warm Period was considerably warmer than modern at these depths.

Image Source: Gebbie and Huybers, 2019

By continuing to use the site, you agree to the use of cookies. more information

The cookie settings on this website are set to "allow cookies" to give you the best browsing experience possible. If you continue to use this website without changing your cookie settings or you click "Accept" below then you are consenting to this. More information at our Data Privacy Policy

Close