German climate science skeptic site wobleibtdieerderwaermung (wherestheglobalwarming) recently posted on the Arctic and Greenland, mentioning that the Arctic winter has already started there as temperatures above 80° north latitude dip below zero.
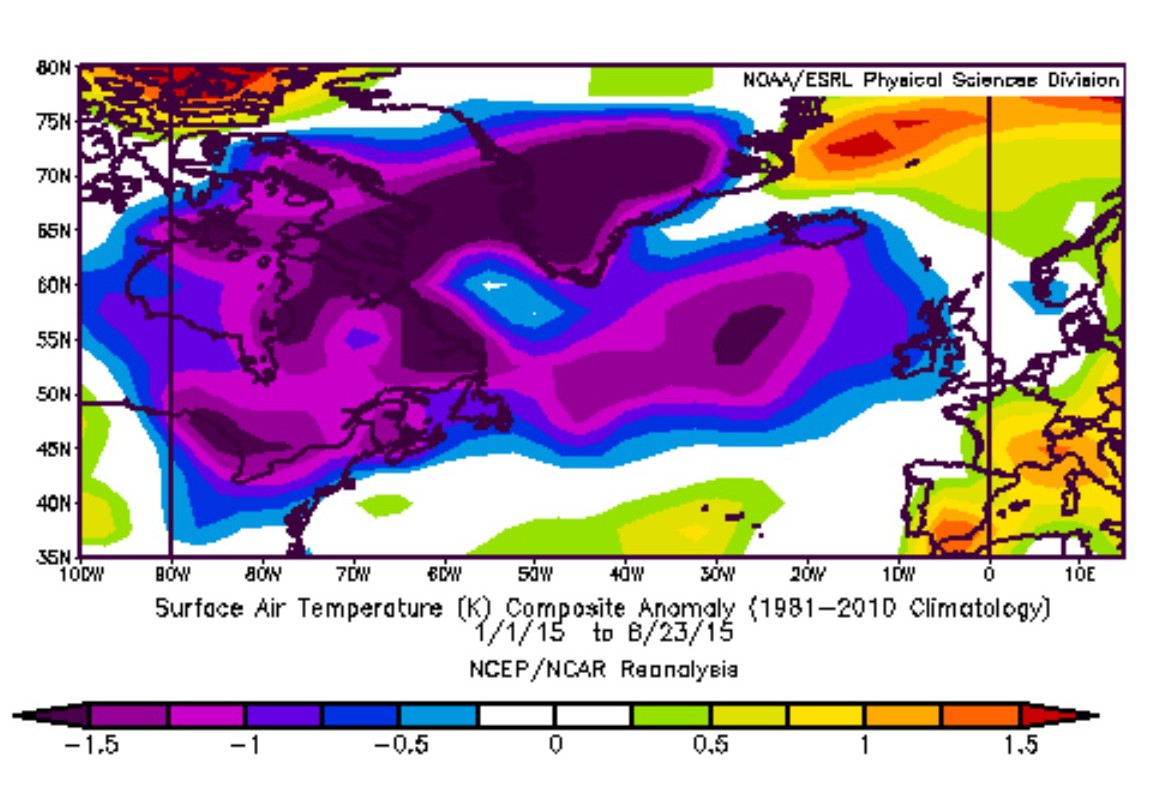
Chart above shows that a major swath of the Arctic, North Atlantic and North America has seen cold temperatures this year.
But there are some fascinating developments in the Arctic region this year: A huge area of North America and the North Atlantic, including Greenland, has been colder than normal so far this year. Remember, this area is supposed to be the canary in the coal mine. The German site writes:
The continuing cold weather in Greenland from September 1, 2014, to August 2015 has led to strongly growing sea ice, as the accumulated mass balance of the Danish Meteorological Weather Service impressively shows:”
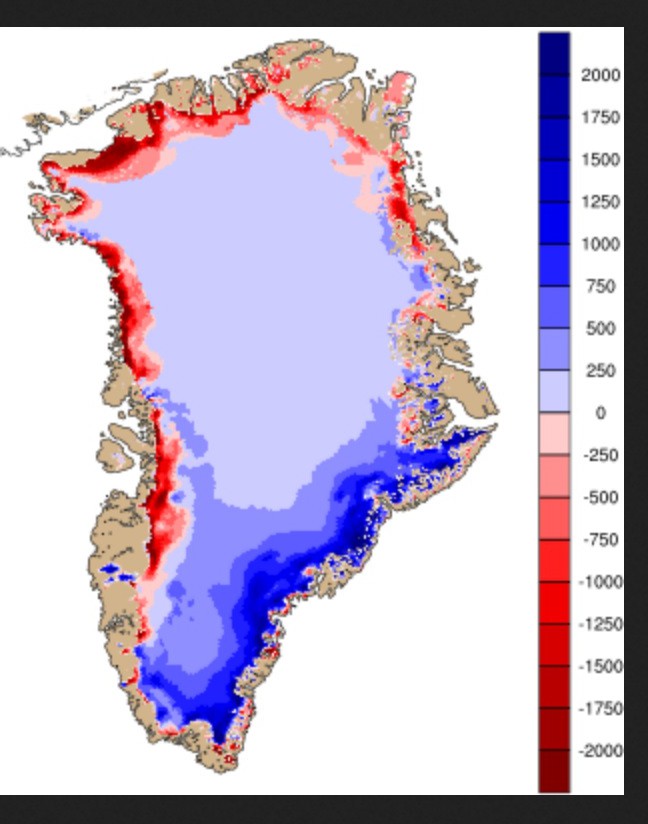
The blue areas show ice growth, while the red areas show loss and are miniscule by comparison. The DMI: “Map of the accumulated surface mass balance (in mm water equivalent) from September 1st to now”. Source: http://www.dmi.dk/mass-budget/.
wobleibtdieglobaleerwaermung writes that “the massive growth of ice on its mainland is removing global sea water.” Just how much? The site continues:
In the 2014/2015 season the daily course and accumulated ice mas development on Greenland measured in gigatons since September 1, 2014 is showing a mass growth (lower chart) of around 200 gigatons, or 200 cubic kilometers.”
The chart:
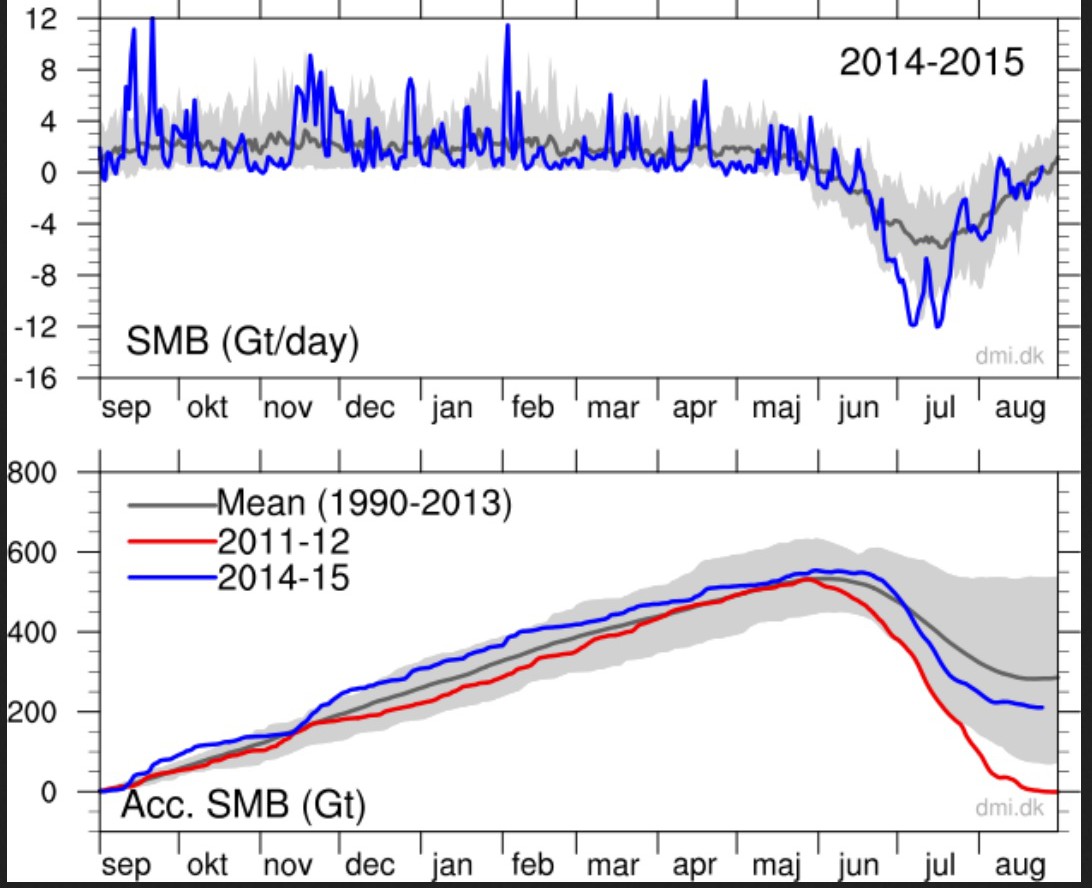
The total daily contribution to the surface mass balance from the entire ice sheet (blue line, Gt/day). Bottom: accumulated surface mass balance from September 1st to now (blue line, Gt) and the season 2011-12 (red) which had very high summer melt in Greenland. For comparison, the mean curve from the period 1990-2013 is shown (dark grey). The same calendar day in each of the 24 years (in the period 1990-2013) will have its own value. These differences from year to year are illustrated by the light grey band. For each calendar day, however, the lowest and highest values of the 24 years have been left out. Source: http://www.dmi.dk/ice-sheet-surface-mass-budget/.


[…] […]
This is total mass anomaly for Greenland:
http://www.arctic.noaa.gov/reportcard/images-essays/fig3.3-tedesco.jpg
It really takes a very special kind of person to look at that and see a mass growth rather than regression to the mean after an outlier in 2012.
A regression to the mean is identical to a mass growth. Your statement is therefore not even false – it is internally inconsistent.
Regression to the mean perhaps but exactly what natural oscillations would predict
http://landscapesandcycles.net/Will-Greenland-Begin-Accumulating-Ice-in-2015-and-Beyond-.html
200 Gt upward qualifies as noise in Greenland. Enderlin et al found the following mass loss rates:
2000-2005: -153 Gt/yr
2005-2009: -265 Gt/yr
2009-2012: -378 Gt/yr
“We estimate a total mass loss between 2000 and 2012 of 2963 ± 335 Gt. Our results agree to within the uncertainty of contemporaneous estimates from Gravity Recovery and Climate Experiment (GRACE) [Sasgen et al., 2012; Wouters et al., 2013]. The rate of loss increased from 153 ± 33 Gt/a over the period
2000–2005 to 265 ± 18 Gt/a from 2005 to 2009 and 378 ± 50 Gt/a between 2009 and 2012, giving a total acceleration of 27.0 ± 9.0 Gt/a2 since 2000. This acceleration is in good agreement with the 2003–2012 acceleration of 25 ± 9 Gt/a2 detected by GRACE [Wouters et al., 2013].”
Enderlin et al, GRL 2014
http://onlinelibrary.wiley.com/doi/10.1002/2013GL059010/abstract
Well I HOPE it all thaws away, giving us a new land to settle on, but, as I am not a lunatic, I don’t actually expect it.
Why do you warmunists want so much ice? I live in a place where we have ice every winter. Believe you me, it can be outight dangerous.
Yeah, I mean who needs our shorelines? Eff those cities.
If you don’t like ice, move to a warmer climate. Or do you expect us to heat up the entire world just because Dirk is afraid of a little ice?
Why do you prefer a frozen wasteland Greenland to one that harbors a higher biodiversity, David? Why do you hate biodiversity?
Not that it will warm (the climate models are junk). But it would be nice if it did.
The trends in the artic and antartic are cyclical, and they are approximately 180 degrees out of phase. Scientist have pretty much came to this conclusion, even the Warmists. Currently the Artic is due for a rebound and is showing signs and the anartic is due for a reduction after reaching record extents aand is showing signs. Please spare me the arguements that something strange is happening, most of us will be dead by the time future scientists are laughing at our current Warming Conclusions built on samples less than fly dung in the Pacific ocean relative the larger trends. NOBODY knows which way we are going other than 30 yr oscillations that are occasionally affected by Sun Min/Max and Stochastic events like Volcanos. If you want to find out who wins on this subject, you better find a way to extend your life. One bet I would make, is that our scientist have ZERO clues on this subject.
It really takes a very special kind of person to argue about a trend SINCE 2014 (the topic of this post) with help of a report card for the year 2014. Update your calendar Anon.
You get more information on that webpage!
The balance is depending on glacial flow!
200 mm/year flows to the edges.
Temperature above 80 north did drop a bit earlier this year but not that impressively. http://ocean.dmi.dk/arctic/meant80n.uk.php cycle through the past 10 years.
Those that think the global temperature trend of rising temperatures is still intact are behind the curve.
The cooling trend will be very evident before this decade is through.
Salvatore, your record on predictions is pretty lousy:
“…here is my prediction for climate going forward, this decade will be the decade of cooling.”
– Salvatore del Prete, 11/23/2010
http://ourchangingclimate.wordpress.com/2010/10/20/andrew-dessler-debating-richard-lindzen/#comment-8875
“I think the start of the temperature decline will commence within six months of the end of the solar cycle maximum and should last for at least 30+ years.”
– Salvatore Del Prete, 7/13/2013
http://www.drroyspencer.com/2013/07/uah-v5-6-global-temperature-update-for-june-2013-0-30-deg-c/#comment-84963
Strangely, none of your prediction failures ever cause you to reexamine your position…..
Gees are you just posting drivel for the sake of drivel?
1. “this decade will be the decade of cooling.”
We are only half way through the decade, only a total moron would say the prediction has failed.
2. We have started to cool.
https://notrickszone.com/2015/09/02/noaa-data-show-outgoing-long-wave-infrared-radiation-higher-this-decade-as-planet-cools-slightly/
You are confusing the OLR response to ENSO, including clouds, for cooling.
David, please explain in view of this:
“Increased concentrations of greenhouse gases, such as CO2, reduce the amount of outgoing longwave radiation (OLR) to space; thus, energy accumulates in the climate system, and the planet warms. However, climate models forced with CO2 reveal that global energy accumulation is, instead, primarily caused by an increase in absorbed solar radiation (ASR). This study resolves this apparent paradox. The solution is in the climate feedbacks that increase ASR with warming—the moistening of the atmosphere and the reduction of snow and sea ice cover. Observations and model simulations suggest that even though global warming is set into motion by greenhouse gases that reduce OLR, it is ultimately sustained by the climate feedbacks that enhance ASR.”
“Gees are you just posting drivel for the sake of drivel?”
Are you acquainted with the parable of the scorpion and the frog?
Like the scorpion, it’s his nature, he just can’t help himself.
If one goes back to the Holocene Optimum the question is how fast is the earth cooling?
Since the Holocene Optimum 8000 years ago the earth has been in a gradual overall cooling trend which has continued up to today punctuated by spikes of warmth such as the Roman ,Medieval and Modern warm periods.
The main drives of this are Milankovitch Cycles which were more favorable for warmer conditions 8000 years ago in contrast to today , with prolonged periods of active and minimum solar activity superimposed upon this slow gradual cooling trend giving the spikes of warmth I referred to in the above and also periods of cold such as the Little Ice Age.
Further refinement to the climate coming from ENSO, volcanic activity , the phase of the PDO/AMO but these are temporary earth intrinsic climatic factors superimposed upon the general broader climatic trend.
All the warming the article refers to which has happened since the end of the Little Ice Age, is just a spike of relative warmth within the still overall cooling trend due to the big pick up in solar activity from the period 1840-2005 versus the period 1275-1840.
Post 2005 solar activity has returned to minimum conditions and I suspect the overall cooling global temperature trend which as been in progress for the past 8000 years ago will exert itself once again.
We will be finding this out in the near future due to the prolonged minimum solar activity that is now in progress post 2005.
There is absolutely no scientific reason — none — to expect climate to cool down in the foreseeable future. Not until humans stop emitting GHGs and adding to the planet’s greenhouse effect.
Your wish to ignore greenhouse warming has no scientific merit at all.
Your belief that CO2 causes warming has ZERO scientific basis, and you know it, otherwise you wouldn’t waste your useless time being a fool on science sites.
But you need to keep up the deceit for your little science fiction column, don’t you.
“Observational determination of surface radiative forcing by CO2 from 2000 to 2010,” D. R. Feldman et al, Nature 519, 339–343 (19 March 2015)
http://www.nature.com/nature/journal/v519/n7543/full/nature14240.html
Press release: “First Direct Observation of Carbon Dioxide’s Increasing Greenhouse Effect at the Earth’s Surface,” Berkeley Lab, 2/25/15
http://newscenter.lbl.gov/2015/02/25/co2-greenhouse-effect-increase/
“Increases in greenhouse forcing inferred from the outgoing longwave radiation spectra of the Earth in 1970 and 1997,” J.E. Harries et al, Nature 410, 355-357 (15 March 2001).
http://www.nature.com/nature/journal/v410/n6826/abs/410355a0.html
“Comparison of spectrally resolved outgoing longwave data between 1970 and present,” J.A. Griggs et al, Proc SPIE 164, 5543 (2004). http://spiedigitallibrary.org/proceedings/resource/2/psisdg/5543/1/164_1
“Spectral signatures of climate change in the Earth’s infrared spectrum between 1970 and 2006,” Chen et al, (2007) http://www.eumetsat.int/Home/Main/Publications/Conference_and_Workshop_Proceedings/groups/cps/documents/document/pdf_conf_p50_s9_01_harries_v.pdf
“Radiative forcing – measured at Earth’s surface – corroborate the increasing greenhouse effect,” R. Philipona et al, Geo Res Letters, v31 L03202 (2004)
http://onlinelibrary.wiley.com/doi/10.1029/2003GL018765/abstract
“Measurements of the Radiative Surface Forcing of Climate,” W.F.J. Evans, Jan 2006
https://ams.confex.com/ams/Annual2006/techprogram/paper_100737.htm
https://ams.confex.com/ams/pdfpapers/100737.pdf
David, You are a funny man. As if these studies show anything of significance. Are you not aware that 90% or higher scientific knowledge today is completely ignored in the future for being COMPLETELY and UTTERLY misunderstood. If we truly understood the natural processes, wouldn’t we be able to predict it? I think these postulates of curiousity are great and we should continue to investigate, but please spare us that there is any certianty what so ever. There is not.
If you follow the link to the DMI website, you’ll see that it specifically states: “Satellite observations over the last decade show that the ice sheet is not in balance. The calving loss is greater than the gain from surface mass balance, and Greenland is LOSING MASS at about 200 Gt/yr.” (my caps)
This post is focusing on an eventual trend SINCE 2014, so what is your point? The chart that Anon provided a link to above, clearly shows that there might be a trend change occurring after a decade with a downward trend. And that chart does not even include year 2015.
“This post is focusing on an eventual trend SINCE 2014, so what is your point?”
A trend since 2014? What is that supposed to be?
Sea ice took a big hit again
http://neven1.typepad.com/blog/2015/09/asi-2015-update-7-to-compact-or-not-to-compact.html
and both passages are sort of open.
http://www.theguardian.com/world/2015/aug/30/my-arctic-journey-fragile-ecosystem-northwest-passage
Just remember that during the first 3/4 or so of the Holocene, the Arctic was free of sea ice most summers.
And really.. the Guardian as a reference ???.. roflmao.
Andy, as usual, has no data to support his claim.
I, however, have this:
“Reconstructed changes in Arctic sea ice over the past 1,450 years,” Christophe Kinnard et al,
Nature 479, 509–512 (24 November 2011)
http://www.nature.com/nature/journal/v479/n7374/abs/nature10581.html
And then again there’s this also:
http://www.abc.net.au/science/articles/2012/06/22/3531167.htm
and before you comment on the secondary source, just use the links to the primary sources
neither do you..
You are a science fiction writer..
Stick to that., moron. !!
Rotten Appell, I tell you facts..
It is for YOU for go and verify them.
Because it is you and I know I am totally wasting my time by giving any links, because you will never bother following them… I leave it to you to verify these facts..
I am not here to teach a brain-washed cretin how to do research.
And seriously..
Why the link to the last 1450 years when I mentioned the first 3/4 of the Holocene..
are you REALLY THAT IGNORANT ??
YES… you are !!!
With today’s science practices, doesn’t reconstruction mean, build it my way. Kind of like going to Burger King Right?
“Mod the data, twist the present, special algorithms don’t upset us. We just want to make it your way.”
This should be the Climate Scientist theme song.
Sort of open is different from open how? Like, sort of warming is to warming?
BTW; the fact that they are called PASSAGES should give you a hint. They OPEN UP.
Sod, a lousy attempt for diversion as ever. This post focuses on an EVENTUAL change in the decade long downward trend, but you want to talk about opening of the passages along the Artic coast areas, which have been named passages for a good reason a long time ago. Do yourself a favor and read up on the origin of the term passages in the Artic region. And do try to stay on topic.
“nd really.. the Guardian as a reference ???.. roflmao.”
the article contains the route the ship took.
Your hate for the guardian is turning into something absurd!
The passages are basically open again. There has been no sea ice recovery!
Yet another attempt to diverse from the topic with help of a straw man. Sod, you are the only person to talk about recovery. For inquiring minds, information like this does however raise the question of an eventual change:
http://psc.apl.washington.edu/wordpress/wp-content/uploads/schweiger/ice_volume/BPIOMASIceVolumeAnomalyCurrentV2.1.png
Answer me this, why only data from 1979 till today? Actually 2014, but did earth start on 1979? Do we not have satellite evidence from the 60’s and 70’s? AND doesn’t that show Artic extents similar to today? Don’t bother answering any of those questions, because it is not really a question. It is a scientific fact. As well as so much other facts that show sea ice is a cylclical process. It really is humorous to watch the ignorance, OR willful misrepresentations, which, if the case, is not humorous.
JaFree, not sure if your reply was really directed at me but in any case, you should up your argumentation and provide references to support your points and carefully read the posts you reply to (since you seem to have missed my point).
The usual sea ice references, available e.g. through the links at WUWT usually start from 1979. However, here’s a nice collections of old school sea ice maps (1863-1961) collected by the DMI:
http://wattsupwiththat.com/2012/05/02/cache-of-historical-arctic-sea-ice-maps-discovered/
which gives a better picture of the cyclical nature of sea ice in the Arctic than the current sea ice references.
“There has been no sea ice recovery!”
Recovery from where to where?
The coldest period of the Holocene.. of course he have less sea ice now… Beneficial for all
or
The first 3/4 of the Holocene when summer sea ice was mostly non-existent.
Tell me, little worm,
What SHOULD the amount of Arctic sea ice be?
Give scientific reasons for your answer.
[…] 4 Settembre 2015- https://notrickszone.com/2015/08/31/danish-meteorological-institute-data-show-greenland-ice-mass-bala… […]
[…] Danish Meteorological Institute Data Show Greenland ice mass balance has increased impressively Since 2014 [link] […]
[…] Danish Meteorological Institute Data Show Greenland ice mass balance has increased impressively Since 2014 [link] […]
From fig. 01 and 02 it can be concluded that the persistent presence of the polar vortex is causing the displacement. Nothing special and keeping in mind that Greenland is the main energy sinkhole for the northern hemisphere. The issue of AGW is strongly exagerated.
[…] Greenland’s ice mass has grown by some 200 cubic kilometers (48 cubic miles) just since 2014. Vikings built homes, grew […]
[…] Greenland’s ice mass has grown by some 200 cubic kilometers (48 cubic miles) just since 2014. Vikings built homes, grew […]
[…] Greenland’s ice mass has grown by some 200 cubic kilometers (48 cubic miles) just since 2014. Vikings built homes, grew […]