It’s a good time to take a look at how global sea ice is doing at both poles. We were told over and over that the poles are the canary in the coal mine for global warming.
If the sea ice melt trend accelerated, we were warned, then the planet was warming rapidly and societies would be wise to prepare quickly for long-term sea level rise.
But nothing has happened at the poles so far.
Like everything related to climate and weather, there’s a lot of volatility built into the infinitely complex system, and so short term changes should not be viewed hysterically.
It is important to keep the focus on the long term and to keep a rational head. When that is done, then we quickly see that there is nothing to worry about and that all the climate indicators are all well within the normal range of natural variability.
The following chart shows Arctic sea ice coverage anomaly from the mean since satellite measurements began in 1978:
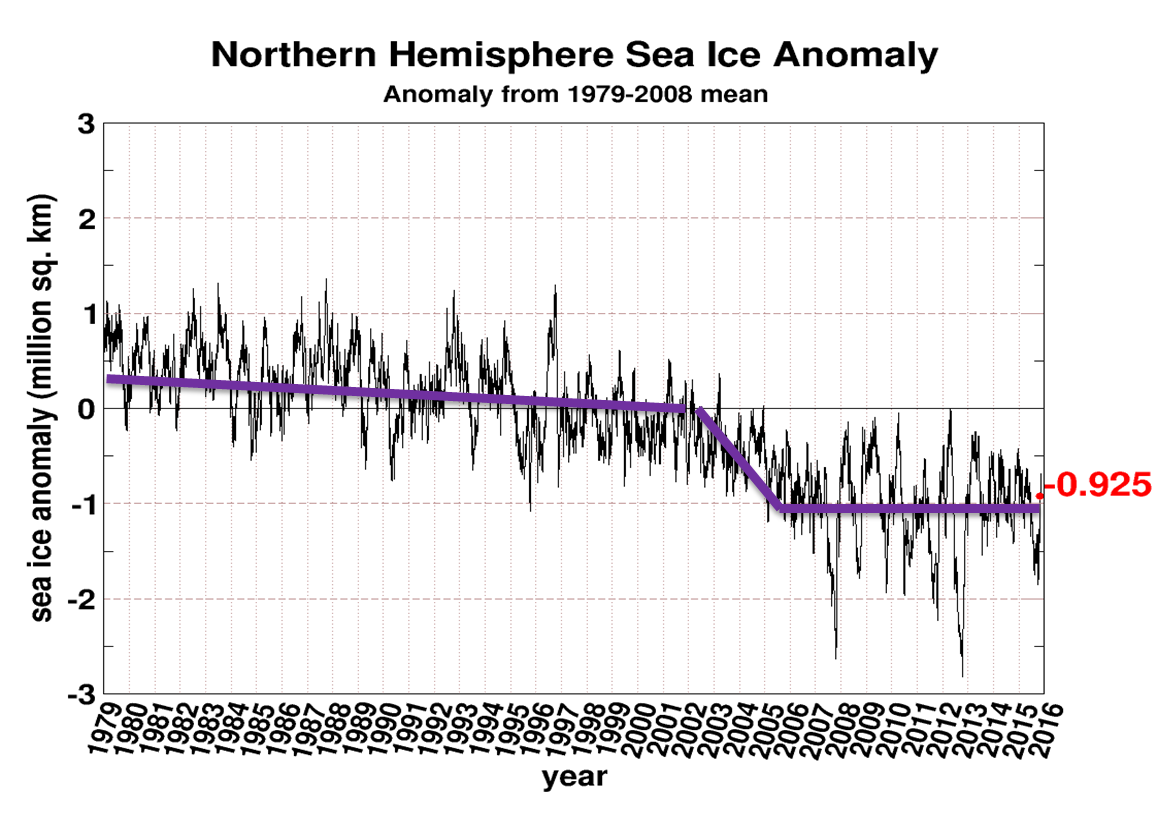
The above chart, from arctic.atmos.uiuc.edu/cryosphere, shows that the Arctic sea ice was in fact quite stable from 1979 to 2002, trending downward only slightly. Then from 2002 to 2007, a period of only 5 years, the sea ice saw almost all of its melting. Over the past 10 years, however, the Arctic sea ice has been stable, even growing some over the past 6 years.
Indeed a number of scientists are projecting the Arctic sea ice to recover as the Atlantic Multidecadal Oscillation (AMO) enters its negative mode of its typical 50-60 year cycle.
It needs to be pointed out that 35 years is a short period when attempting to derive long term sea ice trends. Let us recall it is known that the Arctic sea ice coverage moves in multidecadal cycles, impacted heavily by natural oceanic cycles.
In the 1950s photos of an ice-free north pole are famous. Old newspaper clippings from the early 20th century quoted scientists who reported “dramatic melting” in the Arctic.
Antarctic accelerating sea ice growth trend
The South Pole has been a real embarrassment for the global warming alarmists who earlier predicted a meltdown. That too has not happened. Instead the Antarctic trend has gone in the totally opposite direction:

Source: arctic.atmos.uiuc.edu/cryosphere
The above chart shows that Antarctic sea ice cover has in fact been accelerating upwards. Over the past several months the sea ice has fallen from its record high levels and is now dead normal – for the first time in more than 3 years!
Looking at both north and south polar sea ice combined, using data from the National Snow and Ice Data Center, we see absolutely nothing to worry about:
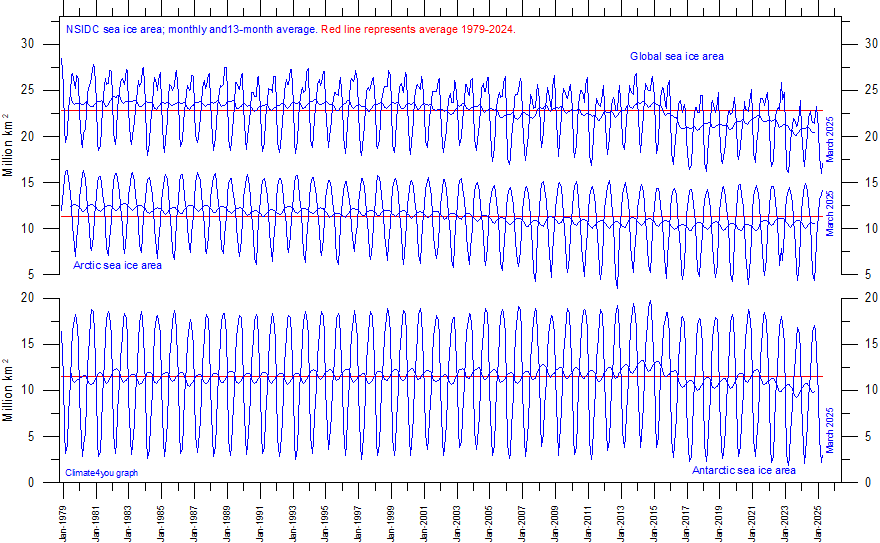
Everything is completely normal and there is no reason to let yourself go into fits of hysteria.


It is my understanding that not only the sea ice extent is increasing, but also the amount of multi-year ice. Greenland glacial ice is also supposed to be increasing.
All this, of course, is due to global warming… Right!
Hm. So you are dividing the trend in the arctic into 3 random parts that fit your story line, while in the antarctic you decided for a single exponential curve? Wow, just wow!
How would it look, if you did it the other way round? exponential downward for the arctic and 3 “steps” for the antarctic, with the last one being a steep decline over the last year?
sod, ever hear of best fit??
please show me the math for the points chosen for the start of different trend lines!
Then explain how the arbitrary fit shown in the first graph is “best fit.”
Fact: Since 1/1/2006, the linear trend in daily Arctic sea ice extent as measured by NSIDC is -18,500 km2/yr.
sod,
I fail to grasp the choice of “random” in your comment. To me there appears to have been (what folks call) a step-change from about 2002-2006 (or so; hard to read). Year to year values may be random about the down trend before the step change and after it when there appears to be no trend. If that set of numbers looks like a negative exponential curve to you – perhaps you need to visit an optometrist.
For the Southern Hemisphere I note the multiple crossings of the zero (or mean) line and do not see a step-change so the 3-thingy is a no go. There does seem to be a bit less ice there this summer than over the last 2 years. As yet this doesn’t seem to mean anything. But I’ll get the popcorn ready.
What is a “step change” and how do you identify it?
What mechanism in nature is causing “step changes”, apart from volcanoes?
The “step” in the arctic data is a loss of about 1 million square km over several years. The same happens multiple time in the antarctic, over shorter time spans.
Your analysis doesn t make any sense!
It is you are making absolutely no sense at all. It isn’t our fault if you cannot grasp something this simple
sod 15. November 2015 at 12:00 PM | Permalink | Reply
“What mechanism in nature is causing “step changes”, apart from volcanoes?”
Apart from avalanches? Apart from thunderstorms? Apart from tornadoes, hurricans, convective fronts, rainfall, (a step change from totally dry to very wet). Apart from freezing of lake durfaces. A step change from liquid to solid. Apart from preparing meals (a step change from liquid to boiling).
Heat. Cold. Electricity. Kinetic energy. Those all cause stepchanges.
Did I mention earthquakes.
Which of the things you mentioned will cause a step change in sea ice (that is, what we are talking about here)?
“What is a “step change” and how do you identify it?
I have found (at least) three terms that seem to be used interchangeably when folks are writing about data series regarding Earth’s systems.
These are: shift, transition, and step-change.
Somewhat related are “swings” and “drifts.”
The above terms are all mentioned here:
http://horizon.ucsd.edu/miller/download/climateshift/climate_shift.pdf
Insofar as I can tell these have the same precision of definition as do snafu, and WAG. I have not found it necessary to investigate further. I once thought boondoggle was ill defined, but was wrong, so I could be wrong about “step”, also.
boondoggle
Warmunists are quick to blame Paris terror attacks on their refuted Global Warming theory.
http://www.breitbart.com/big-government/2015/11/14/bernie-sanders-climate-change-directly-related-terrorism/
What about the PNAS paper on links between the Syrian drought and unrest there do you disagree with, specifically?
“So you are dividing the trend in the arctic into 3 random parts that fit your story line, while in the antarctic you decided for a single exponential curve? Wow, just wow!”
Mr. wind turbine salesman, today you learn about something called a “step change” or a “state”. Warmunists have introduced such a concept themselves in the past, calling it a “tipping point”. And yes, it is one possible model. (as a trend is always a model)
Did you go “wow just wow” when archwarmunist Schneider blathered about his tipping point?
Prove this “step change” is the best fit.
With mathematics.
It would make no difference to anyone who cam think.
As you well know, the representation does not affect the numbers and the said numbers are a major hammer blow to the hysterical whining of people like your goodself
That’s one heck of a death spiral!
I obtained a similar picture using annual Arctic ice extent averages. Plus, there is a well-documented reason for the decline following 1994 to 2007.
https://rclutz.wordpress.com/2015/10/06/arctic-ice-made-simple-2/
do I see a hockey stick?
The Beeb’s being impartial again.
http://www.bbc.co.uk/programmes/b06p7d29
Last episode, first day of the UN climate change conference in Paris.
Here’s a good summary of the recent melt pattern in the Arctic:
“The Arctic sea ice decreased to a record low level in 2007, since satellite observations began in 1979. The decline in the Arctic sea ice from 2005 to 2007 was caused by winds, according to a NASA study. Atmospheric pressure conditions set up wind patterns that compressed the old thick sea ice, loaded it into the Transpolar Drift Stream and then increased its flow rate out of the Arctic along East Greenland. By this the perennial thick sea ice in March 2007 essentially was confined by winds to the Arctic Ocean north of Canada. Consequently, most of the Arctic Ocean was dominated by thinner seasonal ice than usual, melting faster. In addition, this thin ice is more easily compressed and responds more quickly to being pushed out of the Arctic by winds. This thinner seasonal ice conditions facilitated ice loss, leading to the 2007 record low amount of total Arctic sea ice.”
http://www.climate4you.com/
The real shift in Arctic ice was 2002 to 2006. There was no response to the El Nino event in 1998. Is it possible that the ’02 – ’06 is the El Nino event, delayed due to a 4-year time to move warm water from the Pacific through the Bering Straits?
The Arctic melt patterns deserve far for attention than has been given to the simple ice-loss number or percentage. I understand the post-06 high variability is due to thin/non-multi-year ice melting and forming quickly, but the several periods of decreasing and increasing merit answers. The high heat anomaly at the Pacific entrance to the Arctic always intrigues me. So much of “global” warming shows up as regional, I wonder how much is due to ocean circulation changes from the Pacific to the Arctic.
It seems that the warmists accept “local” changes for growth of Antarctic ice, but only global ones for the Arctic loss. I’m hoping this ideological aversion to treating all areas equally reveals an ideology (CAGW) based not in truth (or even physics) but the exception reporting of blinkered, nervous nellies.
According to this flow diagram from Dr. Bernaerts, the Bering inflow in 0.6 Sverdrups (sv) compared to 10 Sverdrups coming from North Atlantic (1 sv is 3.6 km3/hour). That suggests most of the warm water influence comes up the European side.
https://i1.wp.com/www.arctic-heats-up.com/img/c2-p1.jpg?zoom=2
“It seems that the warmists accept “local” changes for growth of Antarctic ice, but only global ones for the Arctic loss.”
How is changes in winds coming off the continent a “local” explanation?
The scientific case for Atlantic water inflow driving Arctic ice variability is getting stronger.
https://rclutz.wordpress.com/2015/11/15/inside-barents-ice-crystal-ball/
The Antarctic demonstrates interesting data, since 1978 not only the sea ice increases but the RSS temperature is almost flat, -0,02/decade. NASA reports a net effect of ice mass over the same time. CO2 increases over that period of time by 60 ppm, taken in account that water vapor is negligible one should expect to see some fingerprint(+dT) by the CO2.
JJM Gommers wrote:
“The Antarctic demonstrates interesting data, since 1978 not only the sea ice increases but the RSS temperature is almost flat, -0,02/decade.”
Completely false.
The RSS LT trend since 1978 (the beginning of its dataset) is +0.12 C/decade.
http://data.remss.com/msu/graphics/TLT/time_series/RSS_TS_channel_TLT_Global_Land_And_Sea_v03_3.txt
[…] From NoTricksZone, by P Gosselin […]
Don’t let such important factual evidence get in the way of the great big talkfest about to unfold in Paris n order to achieve a global agreement on controlling fossil fuel energy use. The United Nations has gone well beyond science and into the realms of fantasy, myth and propaganda to convince everyone about a problem that simply does not exist.
I watched a video that proposed the moon’s orbit oscillates slightly between the northern hemisphere and the south. As it ranges north, it drags the ocean currents up into the artic. This results in a multidecadal cycle of ice loss when the orbit is north and growth when it returns south. There is a few years lag, but a good correlation. Sorry, can’t find the link, but the author seemed very knowledgeable.
If it’s on the Internet, it must be true, right?
Off-context, but still on topic. Unfortunately only in German.
Prof. Ewert has analyzed the data published by GISS/NASA. He has now the proof, that historic temperature data was manipulated after 2010 to artificially increase warming in recent years.
http://www.achgut.com/dadgdx/index.php/dadgd/article/sind_die_klimadaten_manipuliert#When:15:45:00Z
Thanks! That’s a good one. Will try to write on this tomorrow.
Well that’s what Gavin gets payed for.
If NASA wanted real temperatures they would use satellites. They’re NASA, they have them. (One sensor, complete coverage)
Interesting. In what peer reviewed journal can I read his paper?
Your first graph is the most ridiculously laughable, pathetic thing I’ve seen today.
Do you really not understand how such shenanigans make deniers look ridiculous?
Reminds me of this:
http://www.skepticalscience.com/graphics.php?g=47
[…] Fonte : https://notrickszone.com/2015/11/14/scientists-surprised-global-sea-ice-unexpectedly-stable-over-past… […]
How about paying attention to what is happening in the biosphere, you know the real world that we all have to live in, the oceans, rivers, agriculture etc.
An interesting study that just came out, based not so much on temperature figures, but Natures response to a warming world.
Blind faith in technology and ignoring Nature is a recipe for disaster.
http://phys.org/news/2015-11-climate-evidence-global-shift-1980s.html#jCp
P.S the comment re arctic sea ice and el nino’s there is a correlation. a delay of up to two years or more.
I will post the link to the Sea Ice extent service of JAXA, select the years etc.
I am assuming only one link per comment
Sea Ice.
However not just that but warming ocean, especially on the ESS, was 50 methane plumes only a few years ago, now many hundreds, also multiplying methane plumes off the coast of Oregon, Washington, NZ etc as the oceans are warming.
Plus massive forest fires in Siberia, Alaska and Canada in Boreal fires that have not experienced fire in at least 5,000 years due to heat and drying peat bogs and melting permafrost.
But back to sea ice, the important part as most indicative of GHG influence is the winter maximum.
https://ads.nipr.ac.jp/vishop/vishop-extent.html?N
Choose which pole and which years to display
“But back to sea ice, the important part as most indicative of GHG influence is the winter maximum.”
Please provide some evidence for this claim!
In the Arctic, the most relevant point obviously is summer sea ice volume (as an indicator of how much “thick” ice made it through the winter)