Germany temperatures 2000-2015: 7 months warmer, 5 months colder
By Dr. Sebastian Lüning and Josef Kowatsch
(Translated by P. Gosselin)
We keep hearing from the media that also in Germany climate change is galloping away. Climate skeptics, however, point out single months where the official temperature data show cooling taking place. Climate alarmists claim that the skeptics carefully cherrypick the time period. A predictable and fruitless course of discussion is the result.
After our latest analysis of Germany and global temperature for 2015, we received an e-mail from a climate activist and we would like to lift the discussion to a whole new level. The basis for the accusations and counter-accusations disappears when transparent data get provided. Actually preparing trends for various periods and months and presenting them to the public in an unbiased manner ought to be the job of the German National Weather Service (DWD). Unfortunately this does not get done – whatever the reason for that may be. The DWD data for the monthly mean temperatures in Germany are however freely available at Wikipedia, and so anyone can plot the charts. This is precisely what we have done.
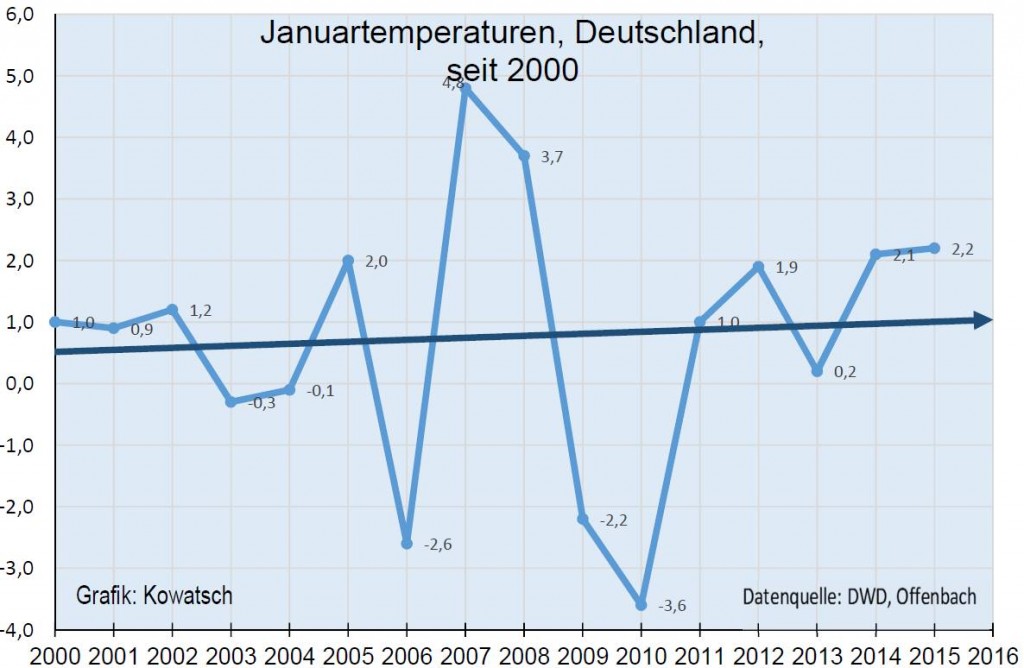
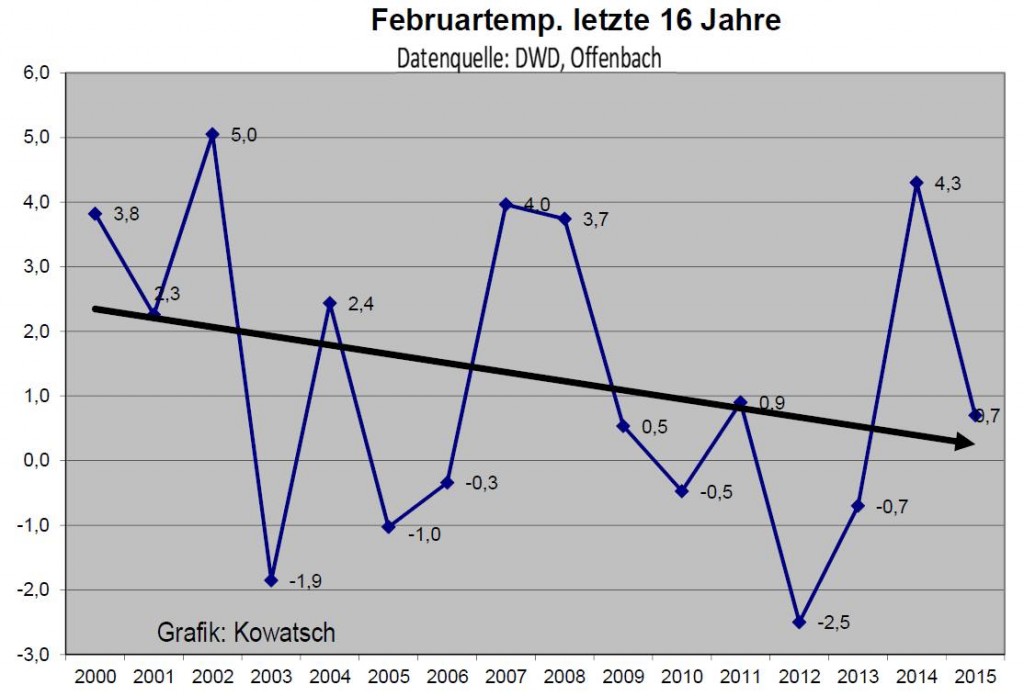
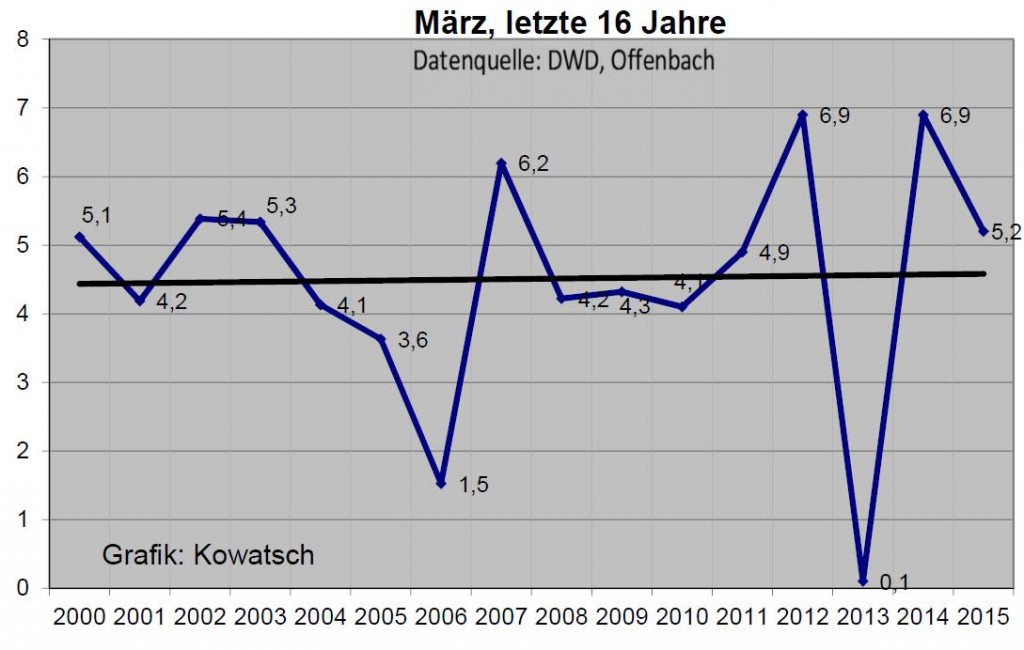
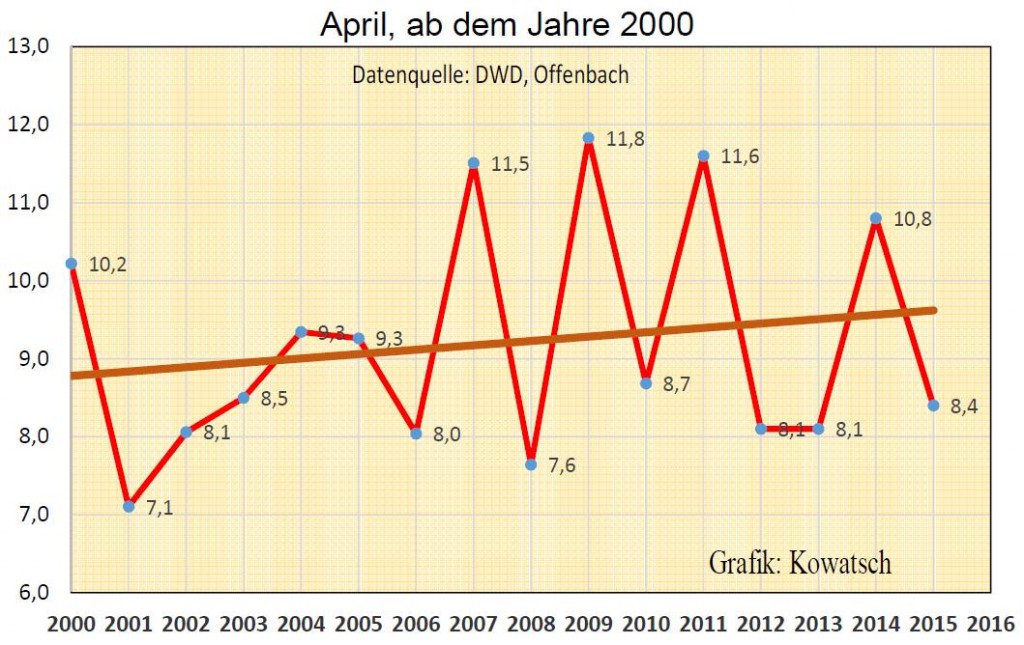
Our partner Josef Kowatsch did the job. Over the coming weeks we will assess and present a series of time periods. To begin, we plot the data for each month over the past 16 years, 2000-2015. The diagrams are depicted below. Shown are the mean temperatures in Germany for each month and the corresponding linear trend for the examined period.
The results shows 7 months with a warming trend:
January, March, April, July, September, November, December
5 months have a cooling trend:
February, May, June, August, October
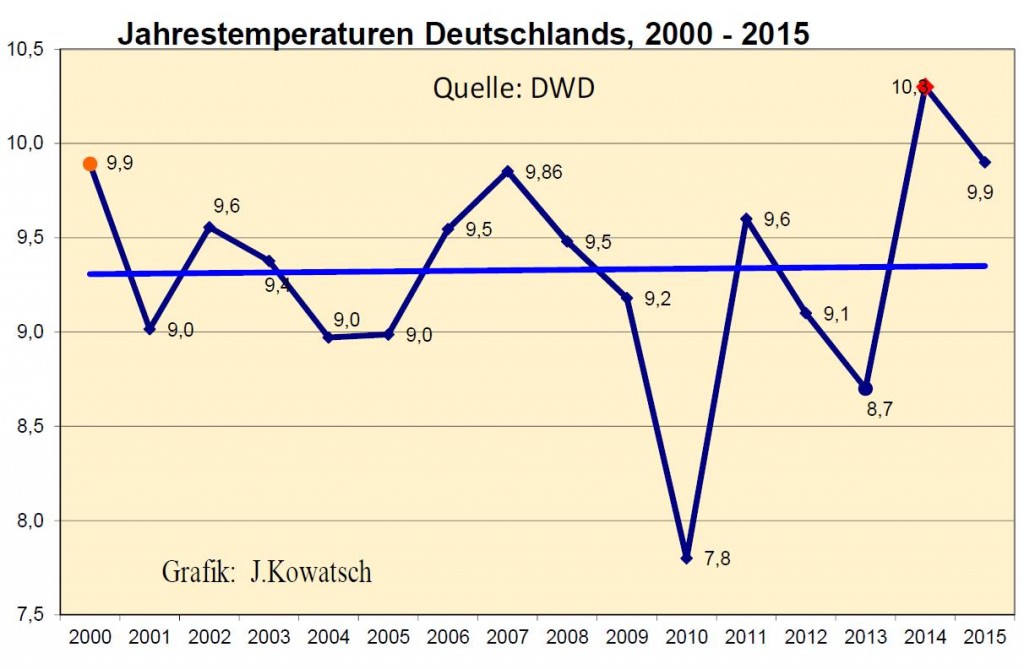
The relationship between warming and cooling is very much balanced. The warming trend for January, March, and September is minimal. This also gets reflected by the overall annual mean temperature trend, which shows a minimal warming trend. However no significant rise is detectable.
Germany mean monthly temperature from 2000-2015 for January:
Germany mean monthly temperature from 2000-2015 for February:
Germany mean monthly temperature from 2000-2015 for March:
Germany mean monthly temperature from 2000-2015 for April:
Germany mean monthly temperature from 2000-2015 for May:
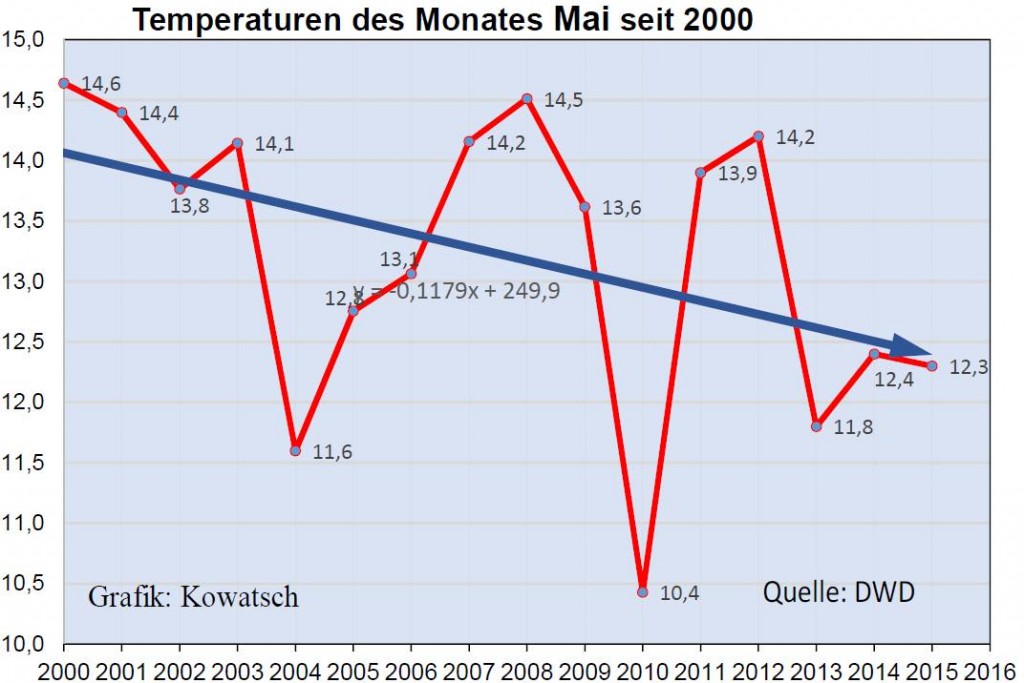
Germany mean monthly temperature from 2000-2015 for June:

Germany mean monthly temperature from 2000-2015 for July:
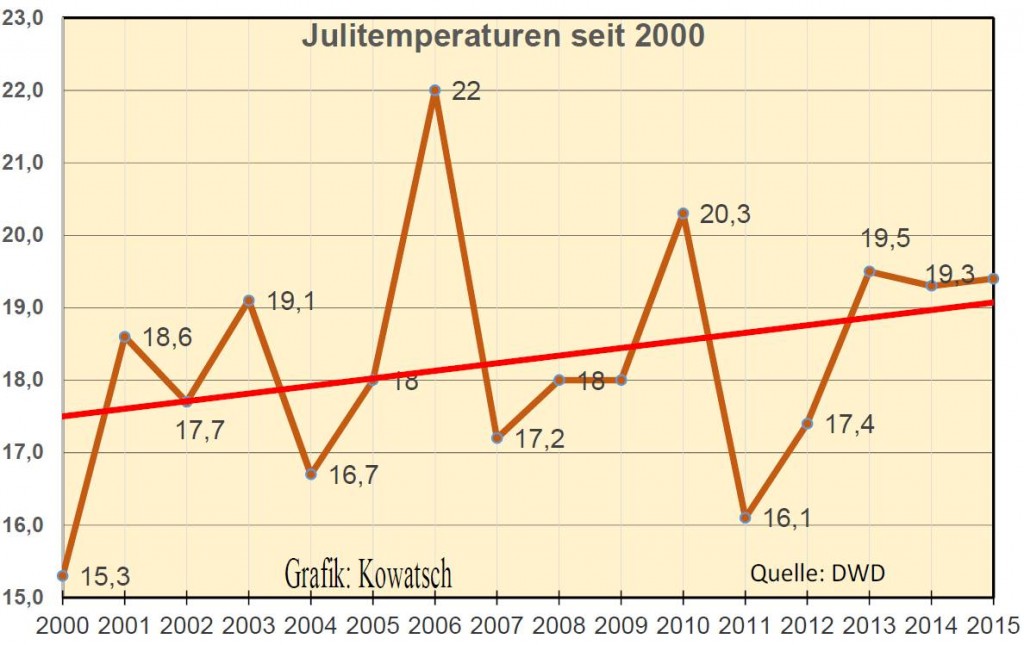
Germany mean monthly temperature from 2000-2015 for August:
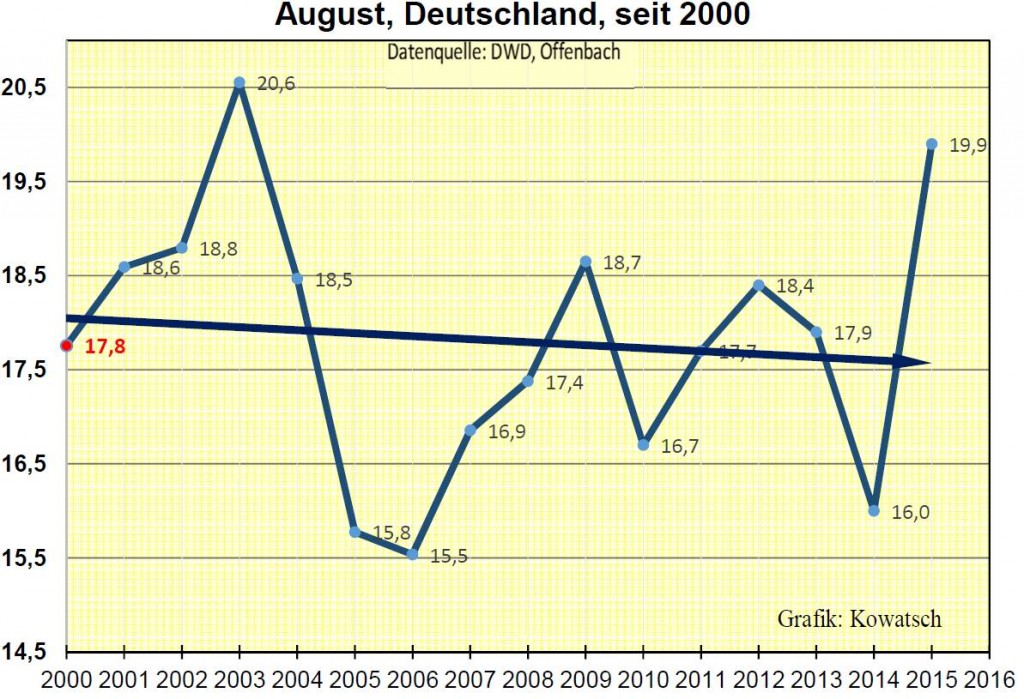
Germany mean monthly temperature from 2000-2015 for September:
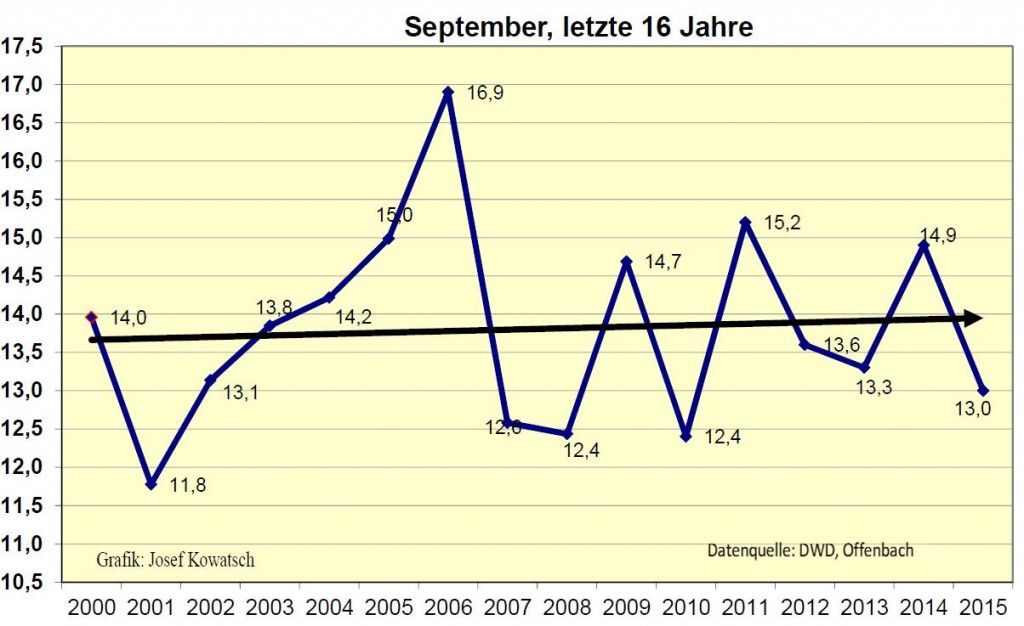
Germany mean monthly temperature from 2000-2015 for October:
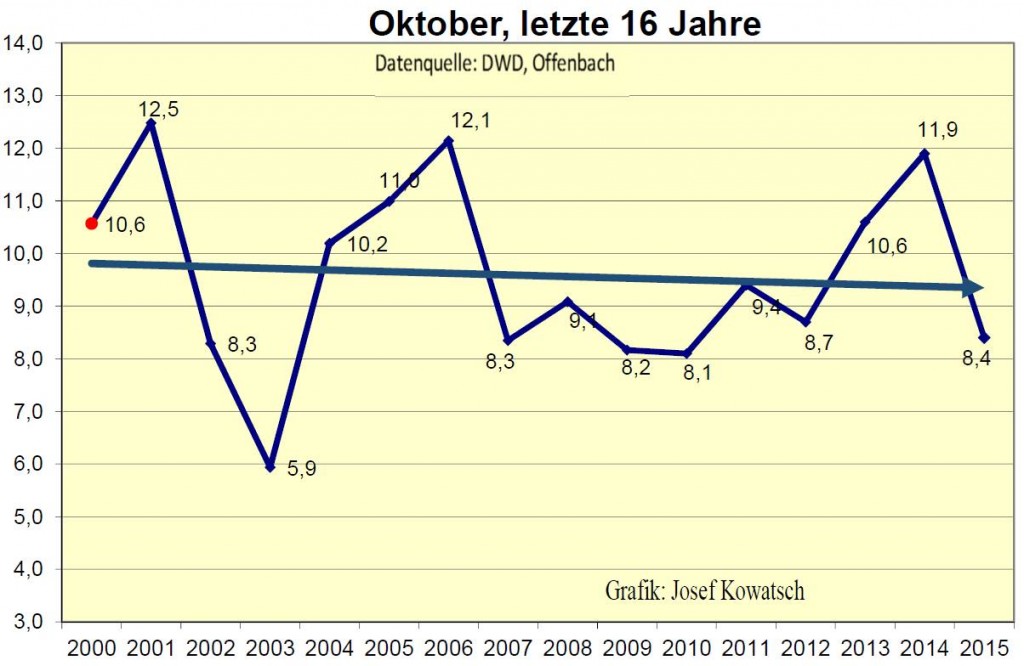
Germany mean monthly temperature from 2000-2015 for November:

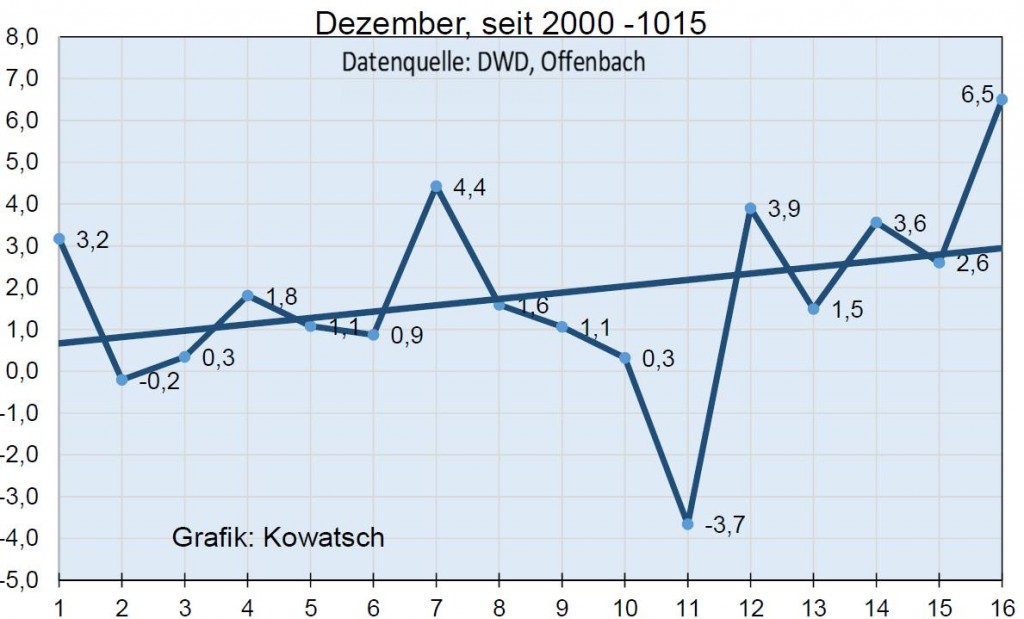
Germany mean monthly temperature from 2000-2015 for December:
(1=2000, 16=2015)
Germany mean temperature from 2000-2015, ANNUAL:


Calculating standard deviations should be easy. It appears that the variation among years is significant. Sixteen years is a reasonable sample for discussion purposes. 30+ years would be better. Real data matters!
Easy,, but a bit of a pain.
Crunching the data from the plots above, I get (NOT ROUNDED TO SIGNIFICANT DIGITS)…
Mean y (ȳ): 9.33375
Regression line equation: y=9.29925+0.0040588235294107x
Correlation coefficient (r): 0.032601332442
STD = 0.570391895
=> Spending trillions of dollars to “fix” this is, as you know, insanity.
16 years is too short to make conclusions about climate change.
Whenever I propose an “international temperature monitoring agency” which would be tasked solely with the most accurate truly global measurement that can be reasonably obtained – I always envisage it will be run by Germans – because for all your failings the one you seem to have least of (compared to e.g. the UK & US) is our appalling attitude toward quality and adjusting data to suit some political end.
Thank you, very informative
I see that 5/7 of that data is defective, and requires “adjustment.”
5/12 – D’OH!
sorry, but those lines are meaningless. It does not matter, whether it is up or down. You need to do some statistical analysis.
Please put the data into some tool like this one and copy us the results.
http://vassarstats.net/corr_stats.html
sod, a linear trend is a statistic. An average is a statistic. An integral is. And so on.
Stay with us and eventually even your brain will notice one thing or the other.
by the way, 16 years is a very strange choice of a time frame.
There is no real explanation for this choice, beyond the fact that 9 of 12 month are (significantly) higher in 2000 than in 2001.
https://de.wikipedia.org/wiki/Zeitreihe_der_Lufttemperatur_in_Deutschland#Messwerte_in_Dekaden
The tricks should be less obvious, at least!
“There is no real explanation for this choice,…” – sod
So, what data from the LAST century do you think they should add to make this statement more true?
“Germany Sees No Statistically Significant Warming This Century, Analysis Shows” – ARTICLE TITLE
Why must you always make comments like this? It would have been fair enough if he’d started the analysis from the previous El Nino peak. You just make yourself look foolish.
sod, why has Global Warming stopped since 2000? This should not have happened. CO2 rose. The models are crap.
The Green Party peddles lies. Which is of course nothing new. Greens are all snakeoil salesmen. The dictator of Greenpeace, the late David McTaggart, sold Dioxin-laced olive oil as “organic”.
[…] https://notrickszone.com/2016/01/26/germany-sees-no-statistically-significant-warming-this-century-an… […]
[…] From No Tricks Zone […]
Interesting,
Down here using UAH(Australia)
The yearly trend this century is 0.0014C/year
http://s19.postimg.org/539zid2yb/Australia.jpg
7 months show negative trends.
Since they began recording data in 12/1978, UAH shows a trend of +0.24 C/decade for Australia LT.
data here:
http://vortex.nsstc.uah.edu/data/msu/v6.0beta/tlt/uahncdc_lt_6.0beta4
Also, for the USA, this century…..
RSS trend is -0.008ºC/yr
UAH.USA48 is -0.001ºC/yr
A cherry pick, defined as choosing a time interval to get the result you what, whether the interval is climatologically meaningful or not. (15 years is not.)
Anyone here who has statistical data that shows a statistically significant pause?
Ah, sod, you’re STILL here. How about you take the opportunity to acquaint yourself with the concept of the NULL HYPOTHESIS!
How about you take the opportunity to acquaint yourself with the concept of the NULL HYPOTHESIS!”
Sorry, but the NULL Hypothesis (at best for your approach) is the business as usual scenario. That should be warming, as we are “recovering from the little ice age”, are we not?
It is not your position to decide what is NULL and what is not.
But the simple fact is, you know that the numbers and statistics simply do not work to support your point of view.
Sorry, but this entire post is nothing but numerology — 15 years is simply too short of a time interval from which to make conclusions about climate.
Instead, you’re discussing the noise.
[…] https://notrickszone.com/2016/01/26/germany-sees-no-statistically-significant-warming-this-century-an… […]
RSS is in at 0.633°C, hottest January on record.
will the false claim about global temperature in this post get corrected or at least have the satellite records added?