Greenland Ice Changes Due To Natural Factors, Studies Show
By Kenneth Richard
According to a just-published (2016) Nature scientific paper, large portions of the Greenland Ice Sheet (GIS) are significantly melting from below due to massive geothermal heat flux forcing. A natural explanation for ice sheet loss is not consistent with the paradigm that says the melting of the GIS is largely due to changes in atmospheric CO2 concentrations.
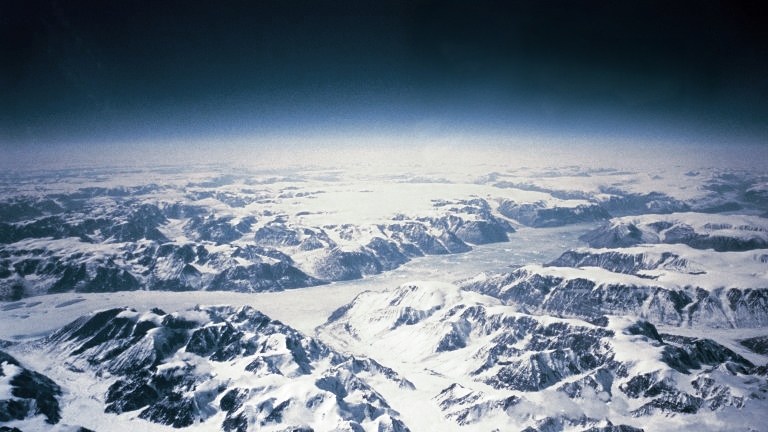
View of Greenland: Source Ringomassa, CC BY-SA 3.0
Brand new paper at Nature:
Melting at the base of the Greenland ice sheet explained by Iceland hotspot history
Ice-penetrating radar and ice core drilling have shown that large parts of the north-central Greenland ice sheet are melting from below. It has been argued that basal ice melt is due to the anomalously high geothermal flux that has also influenced the development of the longest ice stream in Greenland. Here we estimate the geothermal flux beneath the Greenland ice sheet and identify a 1,200-km-long and 400-km-wide geothermal anomaly beneath the thick ice cover. We suggest that this anomaly explains the observed melting of the ice sheet’s base, which drives the vigorous subglacial hydrology and controls the position of the head of the enigmatic 750-km-long northeastern Greenland ice stream. Our combined analysis of independent seismic, gravity and tectonic data, implies that the geothermal anomaly, which crosses Greenland from west to east, was formed by Greenland’s passage over the Iceland mantle plume between roughly 80 and 35 million years ago. We conclude that the complexity of the present-day subglacial hydrology and dynamic features of the north-central Greenland ice sheet originated in tectonic events that pre-date the onset of glaciation in Greenland by many tens of millions of years.”
Below are four older scientific papers also indicating that the source of the rapid melt water production in northern and central Greenland is significantly related to high geothermal heat origins:
1. High Geothermal Heat Flow, Basal Melt, and the Origin of Rapid Ice Flow in Central Greenland
Age-depth relations from internal layering reveal a large region of rapid basal melting in Greenland. Melt is localized at the onset of rapid ice flow in the large ice stream that drains north off the summit dome and other areas in the northeast quadrant of the ice sheet. Locally, high melt rates indicate geothermal fluxes 15 to 30 times continental background. The southern limit of melt coincides with magnetic anomalies and topography that suggest a volcanic origin.”
Introduction: [T]here is a growing body of evidence suggesting more extensive basal melting in the central region of northern Greenland. Fahnestock et al. [2001a] determined age-depth relationships and basal melt rate from ice-penetrating radar in northern Greenland and detected high basal melt, in places up to 0.2 m/yr, under the onset region of the Northeast Ice Stream and its southern tributaries. This basal melt requires a geothermal heat flux much greater than the estimated continental background of 57 mW/m2 [Sclater et al., 1980],and Fahnestock et al., [2001a] speculate that the inferred large heat flow may be of volcanic origin. Similarly, at the base of the NGRIP deep ice core, drilled on the ice divide 170 km northwest of the onset region of the Northeast Ice Stream, the observed basal temperature is at the pressure-melting point [Anderson et al., 2004; Dahl-Jensen et al., 2003]. The basal melt rate at NGRIP reaches 7.5 mm ice per year, and the modeled geothermal heat flux is between 90 and 160 mW/m2 along the flow line originating 50 km upstream of the drill site [Dahl-Jensen et al., 2003]. Again, the origin of the large geothermal heat flux remains unidentified. Ice-penetrating radar profiles show bright bed reflections in many locations in northern Greenland, indicating the presence of lubricating meltwater at the glacier base.”
3. Estimating the basal melt rate at NorthGRIP using a Monte Carlo technique
From radio-echo sounding (RES) surveys and ice core data it can be seen that the ice sheet is melting at the base in a large area in Northern Greenland. The RES images reveal internal layers in the ice. The layers are former deposition surfaces and are thus isochrones. Undulations of the isochrones in regions where the base is smooth suggest that the basal melt rate changes over short distances. This indicates that the geothermal heat flux is very high and has large spatial variability in Northern Greenland.… Combining the estimated basal melt rates with the observed borehole temperatures allows us to convert the basal melt rates to geothermal heat flow values. From the two-dimensional model we find the basal melt rate and geothermal heat flux at NorthGRIP to be 6.1 mm a−1 and 129 mW m−2, respectively.”
4. Basal melt at NorthGRIP modeled from borehole, ice-core and radio-echo sounder observations
From temperature measurements down through the 3001 m deep borehole at the North Greenland Icecore Project (NorthGRIP) drill site, it is now clear that the ice at the base, 3080 m below the surface, is at the pressure-melting point. This is supported by the measurements on the ice core where the annual-layer thicknesses show there is bottom melting at the site and upstream from the borehole. … The results show the geothermal heat flow varies from 50 to 200 mW m-2 along the 100 km section of the modeled flowline. The melt rate at the NorthGRIP site is 0.75 cm a-1, but the deep ice in the NorthGRIP core originated 50 km upstream and has experienced melt rates as high as 1.1 cm a-1.”


They are measuring the heat flux in milli-watts, not watts like the sun/co2 contribution.
“They are measuring the heat flux in milli-watts, not watts like the sun/co2 contribution.”
You did rather well until your “sun/co2” contribution… because the Greenhouse Effect is, according to the warmunists themselves, to 95% caused by water vapor. So why do you mention the bit player CO2? So now compute the Greenhouse effect “forcing” by water vapor, divide by 20, and divide that again because we are talking at best about a fraction of the CO2 “forcing” as we are talking only about an increase of about 100ppm, not the whole CO2 “forcing” caused by the whole 400ppm. Do we arrive at milli-Watts already?
Next: How do you think does infrared backradiation cause BASAL melting in a glacier? Now that’s a real puzzle for me but IANACS. (I Am Not A Climate Scientist.)
They call CO2 the heat-trapping gas. And it emits on two bands at 15 micometer and at 4.3 micrometer. These correspond to Planck temperatures of 200 K and about 600K or 440 centigrade.
Now I can understand that a CO2 molecule after thermalization achieves a temperature of 200K or about -70 centigrade and dethermalizes by emitting a 15 micron photon. Not that it would melt any ice.
But how in the world is the molecule expected to achieve 440 centigrade without immediately cooling down in the rather frigid air over Greenland to dethermalize with a hot 4.3 micrometer photon and cause instant devastation on the ice sheet?
I still don’t quite grasp the devastating IR backradiation. If I would, I think I would have already built a forge run by backradiation.
“If I would, I think I would have already built a forge run by backradiation.” – DirkH
Maybe you could submit a grant proposal. If you choose your words carefully from the AGW Lexicon, make outrageous enough claims about projected success and how much the world will benefit; I’m sure you’ll have no trouble getting Green investors and governments to send a few million$ your way.
Thanks for pointing that out. I’ve deleted that paragraph, as instructed by Kenneth.
My apologies, cbr. I missed that you just pointed out a mistake.
Oh, this is trivial to explain. CO2 is 37.5% heavier than O2, and 50% heavier than N2. Obviously with all the CO2 that’s been emitted, the cumulative increased weight of the atmosphere is causing an increased pressure at the base of the ice, so naturally there will be more melting. //S// 🙂
(57% heavier than N2 – sorry.)
https://www.researchgate.net/publication/222622330_The_climatic_effect_of_CO2_A_different_view
One of the early explanations of surface warming due to increased CO2 was that this would cause further spreading of the 15-micron absorption band of CO2, narrowing the atmospheric window and, as a consequence, the surface would warm until it radiate the same amount of energy up through the narrowed window. However, current estimates are that only about 7% of the surface emitted IR escapes through the window to space without reabsorption by the overlying atmosphere (Luther and Ellingson, 1985, Fig. 2.8), so this effect must be a minor part of the greenhouse warming mechanism. But the atmosphere itself also radiating in the IR – and in all directions, including up toward outer space and back toward the surface. At satellite altitude, most of the radiation observed coming from the planet Earth originates not from the planet’s surface but from some higher level in the atmosphere.
This is a simplistic but physically valid explanation of how the atmosphere acts as a blanket or greenhouse to keep the planet warmer than it would be without an IR absorbing atmosphere. That is, the Earth does not lose energy by IR radiation from its surface, as would a bare black body. Rather, its black body radiation to space is actually emitted from the top of the greenhouse blanket, located on average, about 6 km above the surface, where temperature is some 33°C (59°F) colder than at the surface. The IR opacity of the atmosphere, which produces the greenhouse blanket, is due to liquid and solid particles, including clouds, and the IR absorbing gases; water vapor (20.6) carbon dioxide (7.2), ozone (2.4), nitrous oxide (1.4), methane (0.8), and freons (<0.8). (The numbers in parentheses are the individual contributions in degrees C to the total greenhouse effect of each gas calculated by Kondratyev, 1986, p. 50). [CO2 accounts for 22% of the greenhouse warming effect, or 7.2°C of the 33°C].
If additional greenhouse gases are added to the atmosphere, it is logical to expect that the greenhouse blanket will thicken; i.e., the average altitude from which the atmosphere emits energy to space will rise above its present level of 6 km. But, since the absorbed solar energy which has to be rejected remains essentially unchanged, the radiating temperature also must remain the same. That is, the average atmospheric temperature at the new higher level of the top of the greenhouse blanket must warm to the temperature existing now at the present top of the greenhouse blanket. And if the lapse rate remains the same, then the temperature of the Earth's surface will also warm. This is a somewhat simplistic but physically valid picture of the mechanism by which increases in the greenhouse gas content of the atmosphere will lead to climatic warming.
Unfortunately, this simple picture of how the greenhouse effect operates is of little help in quantifying the amount of warming to be expected. To see why this is so, examine Fig. 3 [p. 7]. This shows a terrestrial IR spectrum taken by Nimbus IV near Guam on 27 April 1970 on a background of temperature-labeled black body curves and with the wave length range of the principal atmospheric IR absorbers (emitters) indicated. It is obvious that water, including the dimer, (H2O)2 – believed to be responsible for the continuum absorption (and emission) of water vapor, is the principal emitter, without even considering the effect of clouds, which are also composed of water. And since this spectrum is taken at latitude 15.1°N, it appears quite credible that the global average temperature of this emitter is 255 K. On the other hand, the IR flux from the CO2 band centered near 15-microns, is both a small fraction of the total and is coming from an emitter with a temperature near 220 K (-50 to -55°C). Returning to Fig. 2, this temperature range is found in the altitude range 12 to 20 km. If the top of this CO2 greenhouse blanket were to be raised by the addition of CO2 and maintained at constant temperature, this would have little or no effect on the temperature at the surface and, if anything, might cause the surface to cool (i.e., if this radiating layer were pushed above 20 km without changing its temperature).
Nice find! Thanks!
“… Greenland’s passage over the Iceland mantle plume between roughly 80 and 35 million years ago.”
Interesting things happen on this old rotating sphere. Background here.
50 M years ago the Yellowstone Hot Spot deposited material at a location that is now off the Washington State coast. The North American Plate moved west about 700 miles (that is, the hot spot is now 700 miles east of the Oregon coast. Washington is now about 300 miles north of where it was then. That’s the simplest, in a nut shell, story.
Thanks, Kenneth Richard.
[My mother had 3 boys: Kenneth, Richard, me.]
Piers, Bishop-Hill and GWPF are reporting Die Welt’s story from 30/3/2016
EU Steel sector fears that reform of the emissions trading
A significantly tighter Emissions Trading, as it provides for Brussels from 2021 could lead in a few years to a rapidly progressing deindustrialisation in important parts of the value chain. Because anything like spend it anywhere else in the world. “The consequences for the German economy would be severe,” Kerkhoff said.
The context is the news this week that the main owner of UK steelplants is pulling out ..and It’s looking likely Much plant will be closed. It’s said UK industrial energy prices are around twice that of their competitors not hampered by green laws.
[…] No Tricks Zone by Kenneth […]
Did this basal melt start yesterday?
No, it did not. So it can’t account for the acceleration in Greenland ice decline.
“it can’t account for the acceleration in Greenland ice decline.”
Acceleration relative to when? The 1961-1990 baseline SMB period, when the Greenland ice sheet cooled relative to the 1920s-1940s? The GIS surface mass balance was similar to recent decades during the 1930s. Then it cooled from the 1940s to the 1990s. Then it warmed from about 1993 to 2007, and it’s been flat since. These warming-cooling-warming patterns are consistent with strong correlations with the North Atlantic Oscillation.
Or were you comparing the recent “acceleration” to the rest of the Holocene? Because the vast interior of the Greenland ice sheet melted faster in 95% of the last 9,000 years than it has in the last few decades. In other words, there’s been a long-term deceleration in ice mass loss for the GIS.
In sum, what’s happening in Greenland is the continuance of a long-term oscillatory pattern that is still well within the range of natural variability.
—
http://polarmet.osu.edu/PolarMet/PMGFulldocs/box_yang_jc_2009.pdf
Meteorological station records and regional climate model output are combined to develop a continuous 168-yr (1840–2007) spatial reconstruction of monthly, seasonal, and annual mean Greenland ice sheet near-surface air temperatures. The annual whole ice sheet 1919–32 warming trend is 33% greater in magnitude than the 1994–2007 warming.
—
http://www.the-cryosphere.net/2/117/2008/tc-2-117-2008.pdf
These estimates show that the high surface mass loss rates of recent years are not unprecedented in the GrIS [Greenland Ice Sheet] history of the last hundred years. The minimum SMB rate seems to have occurred earlier in the 1930s and corresponds to a zero SMB rate… The results show that the GrIS surface mass loss in the 1930s is likely to have been more significant than currently due to a combination of very warm and dry years.
—
http://www.nature.com/nature/journal/v361/n6410/abs/361335a0.html
Absence of evidence for greenhouse warming over the Arctic Ocean in the past 40 years [1950-1990]… In particular, we do not observe the large surface warming trends predicted by models; indeed, we detect significant surface cooling trends over the western Arctic Ocean during winter and autumn.
—
http://link.springer.com/article/10.1023%2FB%3ACLIM.0000018509.74228.03
Since 1940 … the Greenland coastal stations data have undergone predominantly a cooling trend. At the summit of the Greenland ice sheet the summer average temperature has decreased at the rate of 2.2 °C per decade since the beginning of the measurements in 1987.
—
http://onlinelibrary.wiley.com/doi/10.1002/joc.852/abstract
Trends over the 1901–2000 century in southern Greenland indicate statistically significant spring and summer cooling. General periods of warming occurred from 1885 to 1947 and 1984 to 2001, and cooling occurred from 1955 to 1984. The standard period 1961–90 was marked by 1–2°C statistically significant cooling.
—
http://www.nature.com/nature/journal/v509/n7499/full/nature13260.html
We find that the most prominent annual mean surface and tropospheric warming in the Arctic since 1979 has occurred in northeastern Canada and Greenland. In this region, much of the year-to-year temperature variability is associated with the leading mode of large-scale circulation variability in the North Atlantic, namely, the North Atlantic Oscillation. Here we show that the recent warming in this region is strongly associated with a negative trend in the North Atlantic Oscillation, which is a response to anomalous Rossby wave-train activity originating in the tropical Pacific. Atmospheric model experiments forced by prescribed tropical sea surface temperatures simulate the observed circulation changes and associated tropospheric and surface warming over northeastern Canada and Greenland. Experiments from the Coupled Model Intercomparison Project Phase 5 (ref. 16) models with prescribed anthropogenic forcing show no similar circulation changes related to the North Atlantic Oscillation or associated tropospheric warming. This suggests that a substantial portion of recent warming in the northeastern Canada and Greenland sector of the Arctic arises from unforced natural variability.
—
http://science.sciencemag.org/content/351/6273/590
Recent peripheral thinning of the Greenland Ice Sheet is partly offset by interior thickening and is overprinted on its poorly constrained Holocene evolution. On the basis of the ice sheet’s radiostratigraphy, ice flow in its interior is slower now than the average speed over the past nine millennia.
http://www.eurekalert.org/pub_releases/2016-02/aaft-gis020116.php
“[T]he interior of the GrIS is flowing 95% slower now than it was on average during the Holocene.”