
Graph adapted from Climate4you
Last week, Edinburgh and Day (2016) used historical monitoring records to conclude that “the [Antarctic sea ice] levels in the early 1900s were in fact similar to today“. Apparently this was a surprising finding for those who assume anthropogenic greenhouse gases largely determine net changes in polar sea ice.
Perhaps it may also be surprising for those who only focus on the 1979-to-present satellite era to learn that Arctic sea ice has also remained essentially unchanged since the 1930s and 1940s too, and is overall still quite high relative to recent centennial- and millennial-scale historical periods. Even for the last few decades, the trends are not unusual.
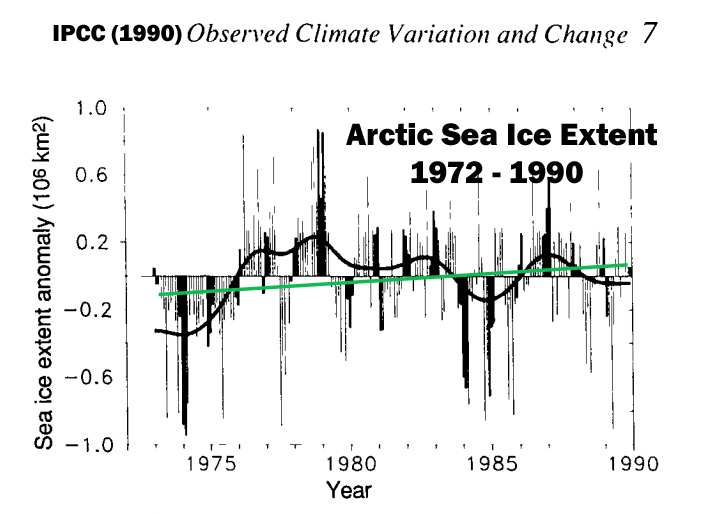
For example, the IPCC referenced NOAA satellite data that extended back to 1972, not 1979, in the first UN report (1990). It showed that there had been a slight increasing trend in sea ice for 1972-1990 due to the low extent recorded during the early 1970s, and the very high extent in the late 1970s, when the current satellite datasets begin. Now, the IPCC (and NOAA, NSIDC) discard the 1972-1978 data from the sea ice record, instead using 1979 as the starting point, or the year with the highest sea ice extent since the early 20th century. This way, the decline in sea ice extent to the present can be steepened considerably in modern graphics.
Between 1990 and 2006, Arctic sea ice declined rapidly. Since 2006, however, the sea ice decline has undergone a pause, as shown in NSIDC data (using WoodForTrees.org interactive graphs):

Graph generated using WoodForTrees.org
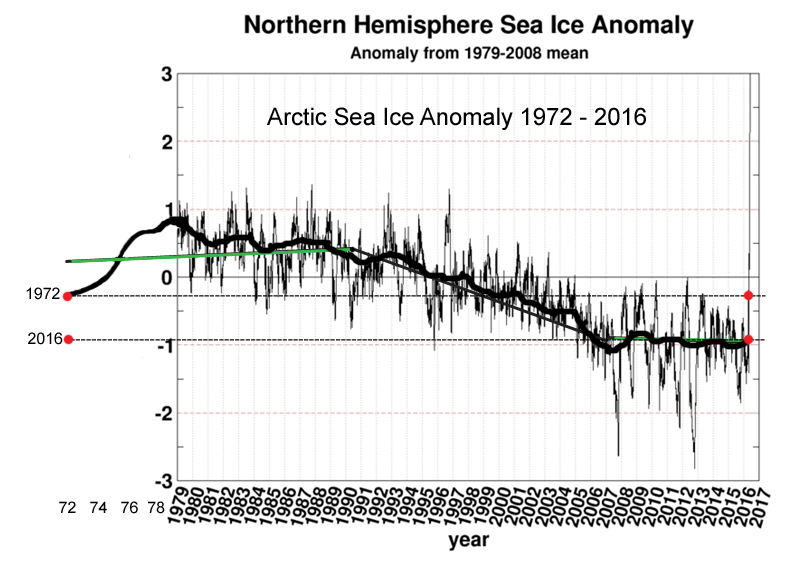
Including the 1972-1978 trend with the 1979-2016 anomaly data (with added trend line) looks like this:
University of Illinois graph:
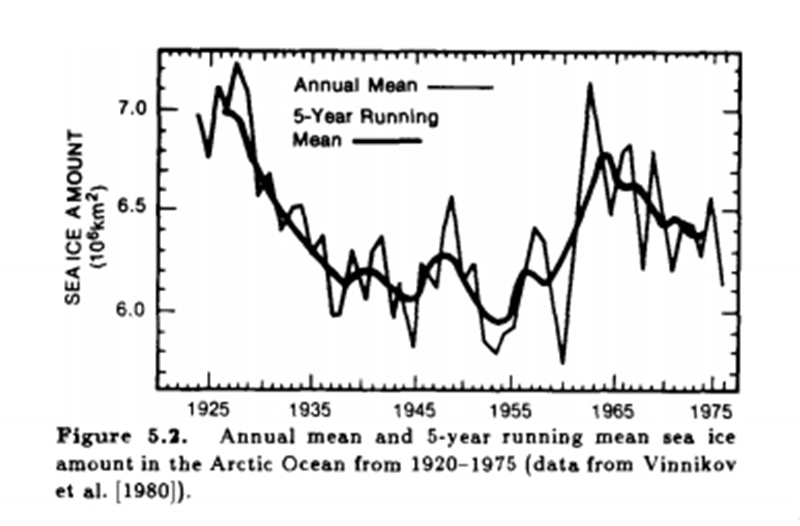
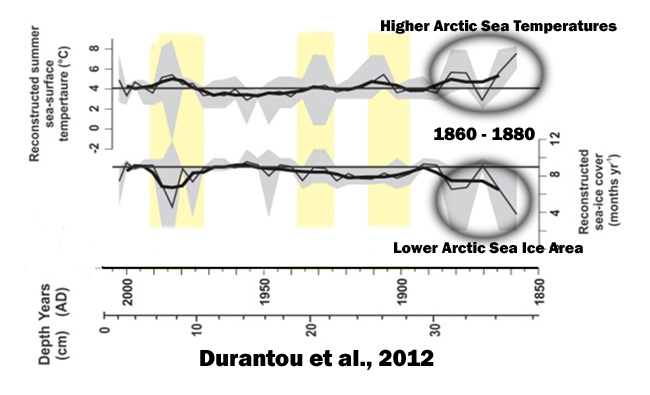
For the early 20th century, there was a dramatic decline in Arctic sea ice between the 1920s and 1940s that was concomitant with the as-warm-as-present Arctic surface temperatures (top graph). After this abrupt warming trend ended, the Arctic cooled for several decades and a subsequent increase in sea ice occurred through the late 1970s. Hoffert and Flanney (1985) furnish a graph with recorded sea ice trends for 1920-1975.
Introduction: As described m ore fully in the accompanying state-o f-the-art report on the Detecting the Climatic Effects of Increasing Carbon Dioxide (see Chapter 4 by Wigley et al. 1985), there is no clear indication of a monotonic warming over this period [1880-1980], as would be anticipated from the observed build up of CO2 in the atmosphere. Instead, these data sets indicate a complex picture including interannual variability and, perhaps, some systematic trends. Indeed, the global temperatures seem to have increased from 1885- 1935, and the extent of Arctic sea ice decreased from 1925-1945. This was followed, however, by a leveling off and then a subsequent decrease in temperature.
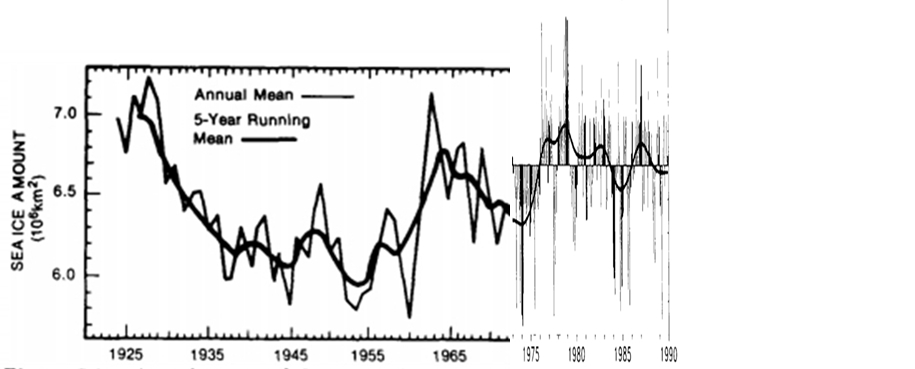
If we were to add the IPCC’s 1972-1990 trend data to the Hoffert and Flannery (1985) graph of the early 20th century, we would see a clear oscillatory pattern in Arctic sea ice (below), not a linear trend that aligns with the increase in anthropogenic CO2 emissions. In fact, Arctic sea ice experienced a rather steep recovery from the 1940s lows to the late 1970s highs, during the same period that anthropogenic CO2 emissions rates were quadrupling in intensity. The pause in Arctic sea ice decline (since 2006) also does not correlate with the rapid increase in anthropogenic CO2 emissions during this period.
Extending the sea ice record back centuries, we also see that there is nothing unusual about the recent Arctic sea ice extent changes.

Sea surface temperature [Arctic Ocean] between ∼ AD 1885–1935 are warmer by up to 3°C with respect to the average modern temperature at the coring site. For the period ∼ AD 1887–1945, reconstructed sea ice cover values are on average 8.3 months per year which is 1.1 months per year lower than the modern values.
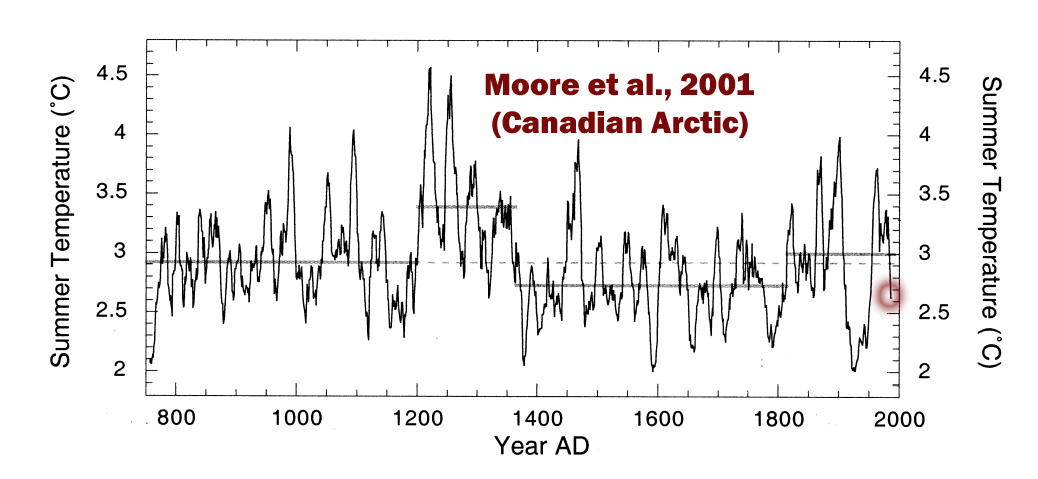
Summer temperatures at Donard Lake [Canadian Arctic] over the past 1250 yrs averaged 2.9 °C. At the beginning of the 13th century, Donard Lake experienced one of the largest climatic transitions in over a millennium. Average summer temperatures rose rapidly by nearly 2 °C from 1195–1220 AD [+0.80 C per decade], ending in the warmest decade in the record (~4.3 °C). A dramatic warming event is seen around the same time (~1160 AD) in a tree-ring width record from Fennoscandia (Briffa et al., 1990). The rapid warming at Donard Lake was followed by a period of extended warmth, with average summer temperatures of 3.4 °C. This time of warm summer temperatures corresponds to the period when Thule Inuit moved into the Canadian Arctic from Alaska using open boats and hunting whale. A ~150–200 yr period of increased temperature around the same time is also seen in historical records of mild conditions allowing the expansion of settlements in Greenland (McGovern, 1991), and radiocarbon-dated records of glacial advance and retreat from numerous glaciers throughout the Kenai peninsula in Alaska (Wiles & Calkin, 1995), as well as humifaction records from Irish peat bogs (Blackford & Chambers, 1995).
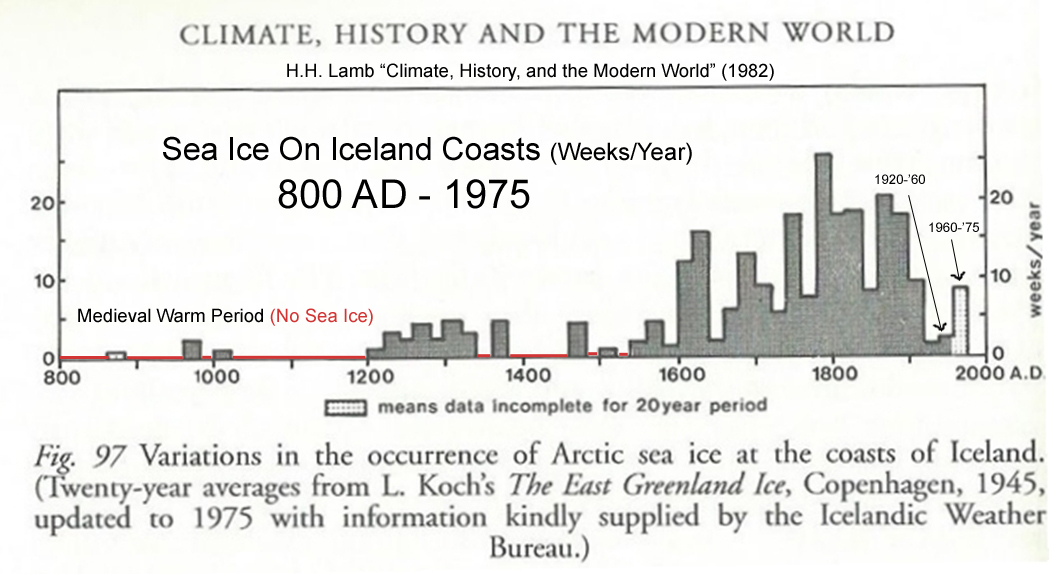
H.H. Lamb (1982) “Climate, History, and the Modern World” (book)
Finally, many scientists acknowledge that Arctic sea ice trends are naturally determined, and anthropogenic CO2 emissions have little to do with decadal-scale variations. Below are just a few examples.
Since the decadal variation of the AO is recognized as the natural variability of the global atmosphere, it is shown that both of decadal variabilities before and after 1989 in the Arctic can be mostly explained by the natural variability of the AO not by the external response due to the human activity.
Solar forcing as an important trigger for West Greenland sea-ice variability over the last millennium … Here, we use diatom assemblages from a marine sediment core collected from the West Greenland shelf to reconstruct changes in sea-ice cover over the last millennium. The proxy-based reconstruction demonstrates a generally strong link between changes in sea-ice cover and solar variability during the last millennium. Weaker (or stronger) solar forcing may result in the increase (or decrease) in sea-ice cover west of Greenland. In addition, model simulations show that variations in solar activity not only affect local sea-ice formation, but also control the sea-ice transport from the Arctic Ocean through a sea-ice–ocean–atmosphere feedback mechanism.
A better understanding of the future climate pattern developments in the Arctic may only follow a better reconstruction of the past patterns of natural oscillations and the determination of the forcing and the resulting oscillations occurred in the climate parameters over different time scales. The proposed information for the past demonstrates the Walsh & Chapman reconstruction claiming a flat sea ice 1870 to 1950 is too simple. The Arctic sea ice experienced a drastic reduction that was phased with warming temperatures 1923 to 1940. This reduction was followed by a sharp cooling and sea ice recovery. This permits us to also conclude that very likely the Arctic sea ice extent also has a quasi-60 years’ oscillation. The recognition of a quasi-60 year’s oscillation in the sea ice extent of the Arctic similar to the oscillation of the temperatures and the other climate indices may permit us to separate the natural from the anthropogenic forcing of the Arctic sea ice. The heliosphere and the Earth’s magnetosphere may have much stronger influence on the climate patterns on Earth including the Arctic sea ices than has been thought.
Multi-decadal variation of the East Greenland Sea-Ice Extent: AD 1500-2000 … The extent of ice in the North Atlantic varies in time with time scales stretching to centennial, and the cause of these variations is discussed. We consider the Koch ice index which describes the amount of ice sighted from Iceland, in the period 1150 to 1983 AD. This measure of ice extent is a non-linear and curtailed measure of the amount of ice in the Greenland Sea, but gives an overall view of the amounts of ice there through more than 800 years. [W]e find that the recently reported retreat of the ice in the Greenland Sea may be related to the termination of the so-called Little Ice Age in the early twentieth century. We also look at the approximately 80 year variability of the Koch [sea ice] index and compare it to the similar periodicity found in the solar cycle length, which is a measure of solar activity. A close correlation (R=0.67) of high significance (0.5 % probability of a chance occurrence) is found between the two patterns, suggesting a link from solar activity to the Arctic Ocean climate. … The ’low frequency oscillation’ that dominated the ice export through the Fram Strait as well as the extension of the sea-ice in the Greenland Sea and Davis Strait in the twentieth century may therefore be regarded as part of a pattern that has existed through at least four centuries. The pattern is a natural feature, related to varying solar activity. The considerations of the impact of natural sources of variability on arctic ice extent are of relevance for concerns that the current withdrawal of ice may entirely be due to human activity. Apparently, a considerable fraction of the current withdrawal could be a natural occurrence.


The referenced study by Edinburgh and Day found Antarctic ice today compares with a century ago.
A comparable Arctic study is Accounts from 19th-century Canadian Arctic Explorers’ Logs Reflect Present Climate Conditions (here) by James E. Overland and Kevin Wood.
Synopsis here:https://rclutz.wordpress.com/2016/11/27/todays-arctic-compares-with-150-years-ago/
“Extending the sea ice record back centuries, we also see that there is nothing unusual about the recent Arctic sea ice extent changes.”
Or maybe there is. Looking at the graphic of “simulated and Reconstructed September Arctic SIE Anormaly”
Looking at each of the minimums Wolf, Sporer, Maunder and Dalton, the sea ice appears not to be affected by these event happening, certainly not at their start. In fact 2 appear to have minimum Ice just as the cooling kicks in — Wolf and Maunder (and maybe the Dalton).
So what? Well, if the ice can be at a minimum just before a major cooling event, isn’t that just what we have now?
Don’t get me wrong, I’m not saying the current conditions indicate anything. I’m just pointing out that as a proxy for ‘climate’ Arctic ice does not appear to cut it as a direct link.
Ice advances and recedes as sea temperature and solar heating dictate. Hansen was and is wrong again!
Ice mass must work as an integrator of temperature. So it must be 90 degree phase shifted to temperature in all frequencies. This can be shown to be trivially true by looking at the annual minimum and maximum: The dates are a quarter year after insolation min/max.
Warmunists ignore this phase shift: They ignore more science than they ever pretend to do.
They actually ignore the entirety of signal processing. And most of mathematics. An AMAZING display of ignorance by so called scientists.
“An AMAZING display of ignorance by so called scientists.” – DirkH
At least they are “well versed” in that aspect of it. :- )
Yes it shows variation in temperature and appears as a lagging indicator mostly of the sea cycle but also its affected by the local wind effects.
As an indicator of climate trends, monitoring Arctic ice woeful.
Nothing unusual this year.
https://s19.postimg.org/53ihz8q2b/sea_ice_2011_2016.png
Mid ice is increased above last 5 years, but new ice is struggling because of the temporary less cold patch over the Arctic.
But the North Russia freeze is gradually working it way to the Kara sea area. When it gets there the ice will grow like crazy !!
I tried to post this once, all gone ? ! ?
https://s19.postimg.org/53ihz8q2b/sea_ice_2011_2016.png
Shows that mid thickness sea ice is greater than the last 5 years
Only the new ice that is struggling a bit, but the Northern Russia freeze is moving towards the Kara Sea.
When it gets there, sea ice levels will climb rapidly.
It would not surprise me if they top-out above the last several years.
This post again is totally false.
In fact, we have a significant change even this year.
This graph is totally insane, as everyone can see at once:
http://www.snopes.com/global-sea-ice-at-a-record-breaking-low/
So what year did carbon dioxide begin melting sea ice, sod? What’s the starting point for the CO2 influence? And why did the Arctic cool down by about -2.0 C between the 1940s and 1970s, when CO2 emissions from humans were skyrocketing? Does CO2 cause both the cooling and warming, or just the warming?
Why hasn’t sea ice extent changed since the 1800s in Antarctica? Does CO2 not work down there?
Snopes is a Soros-funded website, sod. Do you have a source that is not funded by an oligarch?
He said, Dirk, that the snopes-graph is totally insane.
Actually, the poor chump/chimp/sop is so mixed up, he probably doesn’t even know what he was referring to. !
Sorry you have to go to a far-left anti-fact site to get your pseudo-science..
Also sorry you are unable to follow the actual facts put in front of you.
We expect nothing better from you.
The sea ice is NOT at record breaking low.
During most of the first 3/4 of the Holocene, there was regularly ZERO summer sea ice.
Your and your fellow zero-knowledge twerps always want to use just the last 38 or so years, which has been a highly beneficial drop from EXTREME levels of 1979, which were nearly as high as during the LIA.
REAL FACTS prove you wrong, time and time and time again, sop.
You should try finding those real facts before commenting, to avoid making an even more abject fool of yourself.
“This post again is totally false.”
Yes, your post was totally false.
No need to draw attention to that fact but using it as a header.
“sod” is dumb enough to believe snopes.
Is anyone surprised?
I think it is you that is totally insane SOD
sod,
And that shows that the ice varies — so what.
As show above it does not indicate long term climate trends.
sod, you are not well.
O/T Warmunism used as excuse to funnel 5 million USD German taxpayer money into the coffers of the Clintons. Admitted by German govt, reported by German MSM.
https://dirkhblog.wordpress.com/2016/11/29/warmunism-coverup-for-funding-clinton-with-german-tax-money/
Note, this graph of Icelandic sea ice…
https://s19.postimg.org/bkgbf2prn/Icelandic_sea_ice_index_2.png
is probably a better graph than the one used above.
A direct comparison of Arctic Sea Ice from 2011..
https://s19.postimg.org/53ihz8q2b/sea_ice_2011_2016.png
As you can clearly see, the mid-level sea ice is greatly increased over previous years, its just the new ice that is struggling a bit because of the WEATHER patterns trapping some anomalous “less cold” over the Arctic.
But once the freezing blob over Northern Russia makes its way to the Kara Sea, the current sea ice level will take off like a rocket.
You can not “extend” the record back. we have a completely different sort of data.
Yes you can.
sod,
Ever heard of the hockey stick temperature graph?
“You can not “extend” the record back. we have a completely different sort of data.”
Exactly. Just like we cannot “extend” the satellite alimetry data back to earlier than 1993. The satellite alimetry data are modeled results that artificially “adjust” sea level rise rates up by a factor of 3 so as to confirm the biases of climate modelers.
The tide gauge data have shown that sea level rise has decelerated (relative to the 1920-1950 period) to about 1 mm/yr or less since the 1950s. Since a decelerating sea level rise rate doesn’t advance the cause, it was decided to make up a whole new means of presenting sea level data. So we get the new dataset (devised in the early 2000s) to claim sea levels are rising at over 3 mm/yr now and accelerating, and we return to using tide gauges to say that historically sea levels rose much less rapidly than now. So we use two completely different set of data: one obtained from tide gauges, the other from satellites. And then it is claimed the tide gauges are right until 1992, but wrong afterwards — because they show no acceleration after 1992 either. So, after 1992, the satellite data are used, and the tide gauges that don’t advance the cause are discarded. That’s exactly what your side does, sod. It’s called data manipulation.
http://link.springer.com/article/10.1007/s12665-015-4050-2
The worldwide average tide gauge data show that sea level is consistently slowly rising, without any acceleration component over the last decades as it is in North Carolina. Here, we review the relevant data, both worldwide and for the specific area of North Carolina. The acceleration-free long-term tide gauge results reported here show that relative sea levels are only oscillating worldwide. … If we want to study the changes in the rate of sea levels over the satellite altimeter era, we have to consider only the tide gauges that were already satisfying the minimum 60 years length requirement 20 years ago. There are 100 tide gauges of PSMSL [Permanent Service for Mean Sea Level] having length more than 80 years at the present time, and the average rate of rise for them is 0.24 ± 0.15 mm/year [~1 inch per century]. For these 100 tide gauges, the rate of rise has been moving up and down over the last 20 years without any sign of positive or negative accelerations.
https://link.springer.com/article/10.1007/s12517-014-1739-6
The global mean sea level (GMSL) changes derived from modelling do not match actual measurements of sea level and should not be trusted. Compilations of individual tide gauges of sufficient quality and length provide much more reliable information. The present work is a contribution towards a better understanding of the observed of sea levels in India and its relation to worldwide observations. The latest average relative rate of rise of worldwide sea levels from a compilation of 170 stations with more than 60 years of data returns an average relative rate of rise +0.25 mm/year. The individual rates of rise are about constant in between subsequent updates suggesting the absence of any acceleration. Observation in key sites suggests a similarly stable pattern. Along the coastline of India, the average rate of rise of sea level is +1.06 mm/year computed by considering the 11 longest tide gauges of average length 51 years.
http://pure.qub.ac.uk/portal/files/1844373/Gehrels_etal_2012_EPSL.pdf
Between 1900 and 1950 relative sea level rose at an average rate of 4.2±0.1 mm/yr. During the latter half of the 20th century the reconstructed rate of relative sea-level rise was 0.7±0.6 mm/yr.
sod 29. November 2016 at 6:53 PM | Permalink | Reply
“You can not “extend” the record back. we have a completely different sort of data.”
You are straying from the tenets of the warmunist church. Your wrongthinking attitude would make it impossible to achieve warmunist propaganda pieces like Marcott & Shakun.
http://dotearth.blogs.nytimes.com/2013/03/07/scientists-find-an-abrupt-warm-jog-after-a-very-long-cooling/#more-48664
http://climateaudit.org/2013/03/16/the-marcott-shakun-dating-service/#comments
And, sod, it’s even worse if you try to extend ANY of it FORWARD, whether ours, or especially yours.
[…] There Has Been No Significant Net Change In Arctic Sea Ice Extent In The Last 80+ Years […]
So what about that satellite image of the Artic shrinking up to the present? Is this the new ice shrinking but older ice not?
I’m new to this whole thing!
Only just started trying to investigate the ‘non-consensus’ view.
Martin: It’s an oscillatory cycle, driven by natural heat distribution changes in the North Atlantic and Arctic region (NAO [North Atlantic Oscillation], AO [Arctic], AMO, AMOC…). Since the late ’80s/early ’90s, the oscillation has been in the warm mode. Prior to that (’50s to ’80s), it the Arctic was in its cool stage (see the top graph of Arctic temperatures). Within about 10 years, the current pause in sea ice extent will morph into an advancement as the Arctic returns to its cooling cycle. Anthropogenic CO2 emissions only correlate if we cherry-pick short-term start and end dates rather than look at the larger picture of the past century to the past few thousand years, as the above graphs show.
And by the way, there is no “consensus view” that Arctic sea ice is predominantly shaped by parts per million (0.000001 = 1 ppm) changes in atmospheric CO2 concentrations. That’s a made-up conceptualization.
“It’s an oscillatory cycle, driven by natural heat distribution changes in the North Atlantic and Arctic region ”
No, it is not.
If it was an oscillation, Kenneth would tell you, when it will peak and how low it will get on what year. He can not. Instead he is looking at old data of very much worse quality than satellite data is today and is interpreting ups and downs in the past as a cycle that explains what is happening today. Serious scientists have a real explanation, a massive change to the atmosphere and the arctic ice is reacting like we expect.
“And by the way, there is no “consensus view” that Arctic sea ice is predominantly shaped by parts per million (0.000001 = 1 ppm) changes in atmospheric CO2 2
there actually is exactly that. a parts per million change of your body substance with the right chemical will change your status from alive to dead. He also ignores that the “ppm” is over a couple of km of atmosphere thickness.
sod:
Um, sod, NO ONE can predict with any precision what the sea ice extent limit will be for any given year. For that matter, NO ONE predicted that the Greenland Ice Sheet would be setting records for ice growth in recent weeks either – http://beta.dmi.dk/uploads/tx_dmidatastore/webservice/b/m/s/d/e/accumulatedsmb.png
Just because we don’t have that predictability precision doesn’t have anything to do with whether or not there is a 60-year oscillation in the Arctic record. As can be clearly seen in the top image from this essay – https://notrickszone.com/wp-content/uploads/2016/11/Arctic-Surface-Temps-Since-1920-copy.jpg – the temperature data show that the Arctic was just as warm in the 1920s – 1940s as it has been since the 1990s, and that, between the two periods, the Arctic cooled by about -2C. This is what’s known as an oscillation. And it’s why scientists are predicting the Arctic will begin a cooling trend in the next decade or so. The North Atlantic has already begun: http://www.climate4you.com/images/NODC%20NorthAtlanticOceanicHeatContent0-700mSince1979%20With37monthRunningAverage.gif
Robson et al., 2016
http://www.nature.com/ngeo/journal/vaop/ncurrent/full/ngeo2727.html
In the mid-1990s the North Atlantic subpolar gyre warmed rapidly, which had important climate impacts such as increased hurricane numbers and changes to rainfall over Africa, Europe and North America. Evidence suggests that the warming was largely due to a strengthening of the ocean circulation, particularly the Atlantic Meridional Overturning Circulation. Since the mid-1990s direct and indirect measurements have suggested a decline in the strength of the ocean circulation, which is expected to lead to a reduction in northward heat transport. Here we show that since 2005 a large volume of the upper North Atlantic Ocean has cooled significantly by approximately 0.45 °C or 1.5 × 10²² J, reversing the previous warming trend. … The observed upper ocean cooling since 2005 is not consistent with the hypothesis that anthropogenic aerosols directly drive Atlantic temperatures.
http://onlinelibrary.wiley.com/doi/10.1002/2014GL060420/full
The forecasts that were initialized between 2008 and 2012 (crosses) all show a general trend for further decreases in temperature [for the North Atlantic], continuing the observed [cooling] trend. The 2012 forecast spread suggests that the chance of the observed warm SPG mean temperature anomaly of 2003–2007 (0.53) occurring again in 2013–2017 is less than 6%. … To gain further confidence in this forecast we examine the physical mechanisms that control SPG [North Atlantic Ocean] temperatures. Previous studies showed that the 1990s SPG warming was driven by increased convergence of ocean heat transport resulting from an increase in the AMOC [Robson et al., 2012b; Yeager et al., 2012], and the 1960s cooling was driven by reduced ocean heat transport convergence following a reduced AMOC [Robson et al., 2014b]. The hindcasts show changes in ocean heat transport convergence, consistent with these earlier events. We find that changes in ocean heat transport convergence are skilfully predicted by the hindcasts (Figure 1b, diamonds; r = 0.86, p << 0.001, assessed against the convergence in the assimilation). The forecasts show a continued decrease in ocean heat transport convergence, consistent with a cooling SPG.
http://sciencedomain.org/abstract/8837
Observations reveal multidecadal variations in Arctic surface air temperature (SAT), and amplified Arctic warming similar to that observed in recent decades also occurred during 1930–1940. Both observations and climate modeling results suggest that the reduced Arctic sea ice is crucial for the early twentieth century Arctic warming, and internal variability is a very likely cause for that event. … The estimated increase in the Atlantic heat transport into the Arctic since 1979 is consistent with the strengthening of AMOC since the mid 1970s implied by indirect evidence such as the AMOC fingerprints, and could have contributed substantially to the observed summer Arctic SIE decline. If the AMOC and the associated Atlantic heat transport into the Arctic were to weaken in the near future due to internal variability, there might be a hiatus in the decline of September Arctic SIE, and a delay in attaining a summer ice-free Arctic.
http://sciencedomain.org/abstract/8837
A better understanding of the future climate pattern developments in the Arctic may only follow a better reconstruction of the past patterns of natural oscillations and the determination of the forcing and the resulting oscillations occurred in the climate parameters over different time scales. The proposed information for the past demonstrates the Walsh & Chapman reconstruction claiming a flat sea ice 1870 to 1950 is too simple. The Arctic sea ice experienced a drastic reduction that was phased with warming temperatures 1923 to 1940. This reduction was followed by a sharp cooling and sea ice recovery. This permits us to also conclude that very likely the Arctic sea ice extent also has a quasi-60 years’ oscillation. The recognition of a quasi-60 year’s oscillation in the sea ice extent of the Arctic similar to the oscillation of the temperatures and the other climate indices may permit us to separate the natural from the anthropogenic forcing of the Arctic sea ice.
sod:
Yes, and the human body has exactly what to do with billions of tons of ice in the Arctic? Please cite a scientific experiment, sod, which shows to what extent ice is affected by 0.000001 changes in atmospheric CO2. Here are some papers indicating that solar forcing and ocean heat transport anomalies (which are natural) can entirely explain variations in sea ice cover, such as the low extent in 2007.
http://onlinelibrary.wiley.com/doi/10.1029/2008GL034007/full
Abstract: The summer extent of the Arctic sea ice cover, widely recognized as an indicator of climate change, has been declining for the past few decades reaching a record minimum in September 2007. The causes of the dramatic loss have implications for the future trajectory of the Arctic sea ice cover. Ice mass balance observations demonstrate that there was an extraordinarily large amount of melting on the bottom of the ice in the Beaufort Sea in the summer of 2007. Calculations indicate that solar heating of the upper ocean was the primary source of heat for this observed enhanced Beaufort Sea bottom melting. An increase in the open water fraction resulted in a 500% positive anomaly in solar heat input to the upper ocean, triggering an ice–albedo feedback and contributing to the accelerating ice retreat.
Conclusions: There was an extraordinarily large amount of ice bottom melting in the Beaufort Sea region in the summer of 2007. Solar radiation absorbed in the upper ocean provided more than adequate heat for this melting. An increase in the open water fraction resulted in a 500% positive anomaly in solar heat input to the upper ocean, triggering an ice–albedo feedback and contributing to the accelerating ice retreat.
http://www.nature.com/nature/journal/v509/n7499/full/nature13260.html
We find that the most prominent annual mean surface and tropospheric warming in the Arctic since 1979 has occurred in northeastern Canada and Greenland. In this region, much of the year-to-year temperature variability is associated with the leading mode of large-scale circulation variability in the North Atlantic, namely, the North Atlantic Oscillation. Here we show that the recent warming in this region is strongly associated with a negative trend in the North Atlantic Oscillation, which is a response to anomalous [natural] Rossby wave-train activity [planetary waves related to the Earth’s rotation] originating in the tropical Pacific. Atmospheric model experiments forced by prescribed tropical sea surface temperatures simulate the observed circulation changes and associated tropospheric and surface warming over northeastern Canada and Greenland. Experiments from the Coupled Model Intercomparison Project Phase 5 models with prescribed anthropogenic forcing show no similar circulation changes related to the North Atlantic Oscillation or associated tropospheric warming. This suggests that a substantial portion of recent warming in the northeastern Canada and Greenland sector of the Arctic arises from unforced natural variability.
sop…
When you breathe in its probably somewhere between 300 and 2000 ppm CO2, depending where you are
Your body breathes out around 40,000ppm
Do you really think that even another 400ppm is going to make any difference ??
However, if we take away 400ppm.. THE WORLD DIES !!!
—————————-
And the AMO is an oscillation, it just happens to be somewhat irregular. And it has just started to drop from its flatish 10 year maximum.
Didn’t you know that natural oscillations can be irregular… or are you ignorant of that, as well.
I am beginning to wonder if there is anything you know, that hasn’t been spoon-and pusher fed to you by your alarmist handlers!
Martin look at the dates for the start of the
Wolf Minimum 1230-1350(~666-736 years ago),
Sporer Minimum 1460-1550(466-556 years ago),
Maunder Minimum 1645-1715(301-371 years ago) and the
Dalton Minimum 1790-1820 (226-196)
You may notice that at the start of most of these big freezing events — mini ice ages — that the ice was at a minimum for that period of time.
Now I’m not saying that current conditions signal anything BUT sea ice area, or volumes, signals just about NOTHING of the coming climate trends. It just signals local sea and wind conditions.
If all the ice was to melt before Christmas so what?
This year the new forming ice has struggled a bit because of the “less colder” blob that hung over the Arctic trapping the “much more colder” blob over Siberia.
There is actually more mid-thickness sea ice this year than in the last several years.
https://s19.postimg.org/53ihz8q2b/sea_ice_2011_2016.png
And the trend in average Arctic Sea Ice since the AMO topped out in 2006 is essentially zero.
https://s19.postimg.org/9ntnh6z8z/Arctic_ice_area_trend.png
Martin, Here is the UAH NoPol temperature this century before the current NON-CO2 based El Nino.
https://s19.postimg.org/jrz6i34oj/UAH_No_Pol_2000_2016.png
And from 1980 – 1995 (just before the 1998 El Nino)
https://s19.postimg.org/t5vk23e5v/UAH_nopol_1980_1995.png
So any drop in Arctic sea ice is NOTHING to do with air temperature and all to do with the natural AMO oscillations.
It
“Perhaps it may also be surprising for those who only focus on the 1979-to-present satellite era to learn that Arctic sea ice has also remained essentially unchanged since the 1930s and 1940s too”
False.
“History of sea ice in the Arctic,” Leonid Polyak et al, Quaternary Science Reviews 29 (2010) 1757–1778.
http://research.bpcrc.osu.edu/geo/publications/polyak_etal_seaice_QSR_10.pdf
“Early 20th century Arctic warming in retrospect,” Wood and Overland, Intl J Climatology (2009)
http://onlinelibrary.wiley.com/doi/10.1002/joc.1973/abstract
“Reconstructed changes in Arctic sea ice over the past 1,450 years,” Christophe Kinnard et al,
Nature 479, 509–512 (24 November 2011)
http://www.nature.com/nature/journal/v479/n7374/abs/nature10581.html
Walsh and Chapman (2000)
Graph here on top right: http://www.arctic.noaa.gov/essay_untersteiner.html
“Sea ice before satellites:
http://nsidc.org/icelights/2011/01/31/arctic-sea-ice-before-satellites/
Kenneth, you should best just deny these, and pretend they don’t exist.
I don’t “deny” papers, David. I just add them (I’d already seen these) to my database. In looking at 4 your links, though, only 2 (Polyak and Kinnard) depict sea ice changes in the Arctic as much lower now than during the 1930s and 1940s. The graphs used in the above essay show that there is nothing unusual about modern sea ice extent relative to the last several thousand years. Earlier in the Holocene, the Arctic was 2 to 3 C warmer than now, and the ocean was ice free during the summers. What do you think caused that, since CO2 levels were in the 260 ppm range at the time when the Arctic was ice free?
In the above essay, do you deny the papers that show Arctic sea ice was lower than now even during some periods of the Little Ice Age? Do you deny that Iceland sea ice extent rose dramatically during the 1950s-’70s as the Arctic region cooled? Why did the Arctic cool down by about 1.5 C after the 1920s-’40s? Why were the 1930s and 1940s just as warm as it is now in the Arctic, as the HadCRUT data show (as does peer-reviewed science)? Or do you deny all this, David?
http://www.the-cryosphere.net/2/117/2008/tc-2-117-2008.pdf
“These estimates show that the high surface mass loss rates of recent years are not unprecedented in the GrIS [Greenland Ice Sheet] history of the last hundred years. The minimum SMB rate seems to have occurred earlier in the 1930s and corresponds to a zero SMB rate….The results show that the GrIS surface mass loss in the 1930s is likely to have been more significant than currently due to a combination of very warm and dry years.” https://notrickszone.com/wp-content/uploads/2016/10/Greenland-Surface-Mass-Balance-Fettweis08-copy.jpg
Typical bait and switch:
“Do you deny that Iceland sea ice extent rose dramatically during the 1950s-’70s as the Arctic region cooled?”
Iceland isn’t all of the Arctic, is it?
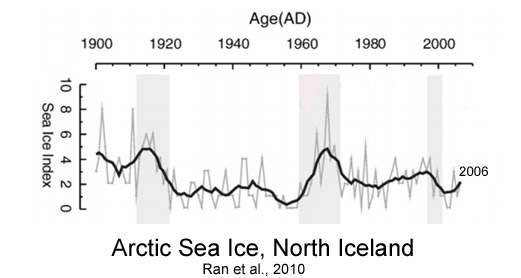
I didn’t write that Iceland is “all of the Arctic.” Iceland is, however, within the “Arctic region”, as Northern Iceland is the demarcation line for the edge of the Arctic circle. And the sea ice in the North Icelandic Shelf (which is in the Arctic circle) has shown only oscillatory trends since 1900, as indicated by Ran et al., 2010: https://notrickszone.com/wp-content/uploads/2016/11/Arctic-Sea-Ice-Iceland-1903-2006-Ran-10.jpg Actually, the 1920-1960 period had lower sea ice values than in recent decades.
Kenneth:
I’m not going to argue about whether some port in Southern Wherever was 0.x deg C lower than some other point in Greeland far on the other side.
If you think Arctic SIE was lower, simply present a graph and a paper showing that. Try to keep your meanderings to a minimum.
Again I must ask: Do you ever actually read the essays you comment on, or do you just read the title and drop down to comment? So as not to burden you with too much “meandering”, here is a single graph from a 2015 paper (found in the body of this essay if you had happened to read it) showing that September SIE was much lower than recent decades for several periods during the last few hundred years, and especially during the last few thousand years.
https://notrickszone.com/wp-content/uploads/2016/11/NTZ-Arctic-Sea-Ice-Late-Holocene-Human-Influence-768×261.jpg
There is no correlation with CO2 concentrations that is detectable during the Holocene, or the last 10,000 years. If you were actually interested in learning about this, I could provide you with links to papers that show the Arctic was ice free during the summers during the Early Holocene, when CO2 levels were in the 260 ppm range. But since you’ll likely just ignore/deny science like this, I won’t burden you with such unwelcome information.
“These estimates show that the high surface mass loss rates of recent years are not unprecedented in the GrIS [Greenland Ice Sheet] history of the last hundred years. The minimum SMB rate seems to have occurred earlier in the 1930s and corresponds to a zero SMB rate….The results show that the GrIS surface mass loss in the 1930s is likely to have been more significant than currently”
Greenland — not the Arctic.
Is it?
Another bait and switch. Another bald-face fraudulent lie.
70% of Greenland’s land mass is found within the Arctic circle. This is new information?
“Germany’s Mean Temperature For November 0.5°C Colder Than Normal As Cold Grips Europe
By P Gosselin on 30. November 2016”
OMG!!!!
Have you warned the girls in milking boots? The beautiful frauleins who serve you all that beer? The dogs who trot by your side, blindly obedient??
Half of denialism is quoting short-term numbers and trends that mean nothing and have no statistical significance?
Don’t you care when people laugh at you and dismiss you? No pride?
Interesting. So why do you deny that sea ice extent has grown for Antarctica in the last 3 decades by citing this year’s anomaly? Is this “denialism”, or does it cease to be “denialism” when you do what you accuse others of?
Pierre [actually, KR] wrote:
“Observational evidence indicates that Antarctic sea ice has been advancing in recent decades”
David Appell wrote:
“False. Antarctic sea ice is currently at a record low.”