Scientists Increasingly Discarding
‘Hockey Stick’ Temperature Graphs
Now Updated: 300 Non-Hockey Stick Graphs
“[W]hen it comes to disentangling natural variability from anthropogenically affected variability the vast majority of the instrumental record may be biased.” — Büntgen et al., 2017
Last year there were at least 60 peer-reviewed papers published in scientific journals demonstrating that Today’s Warming Isn’t Global, Unprecedented, Or Remarkable.
.
Just within the last 5 months, 58 more papers and 80 new graphs have been published that continue to undermine the popularized conception of a slowly cooling Earth temperature history followed by a dramatic hockey-stick-shaped uptick, or an especially unusual global-scale warming during modern times.
.
Yes, some regions of the Earth have been warming in recent decades or at some point in the last 100 years. Some regions have been cooling for decades at a time. And many regions have shown no significant net changes or trends in either direction relative to the last few hundred to thousands of years.
.
Succinctly, then, scientists publishing in peer-reviewed journals have increasingly affirmed that there is nothing historically unprecedented or remarkable about today’s climate when viewed in the context of long-term natural variability.
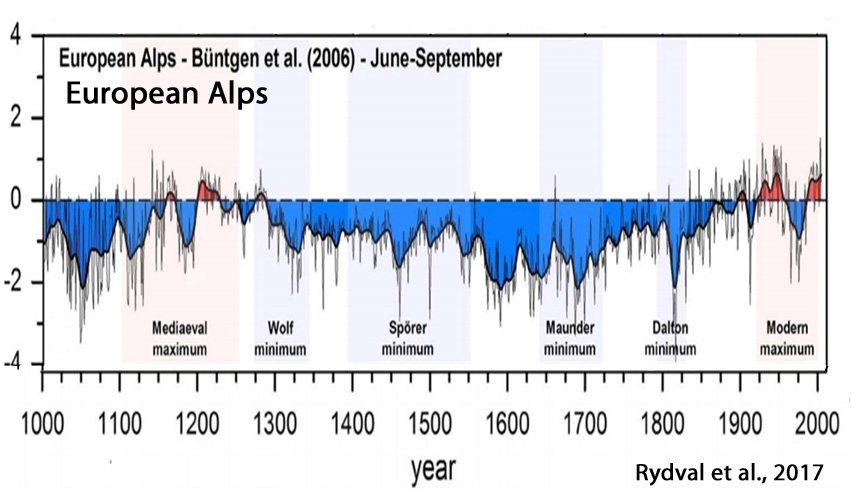
![]()
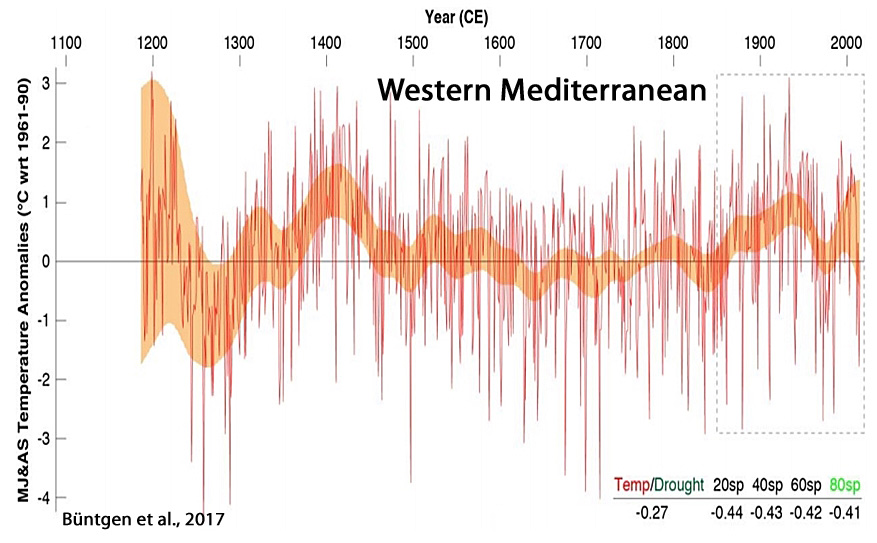
Büntgen et al., 2017
“Spanning the period 1186-2014 CE, the new reconstruction reveals overall warmer conditions around 1200 and 1400, and again after ~1850.
Little agreement is found with climate model simulations that consistently overestimate recent summer warming and underestimate pre-industrial temperature changes. … [W]hen it comes to disentangling natural variability from anthropogenically affected variability the vast majority of the instrumental record may be biased.
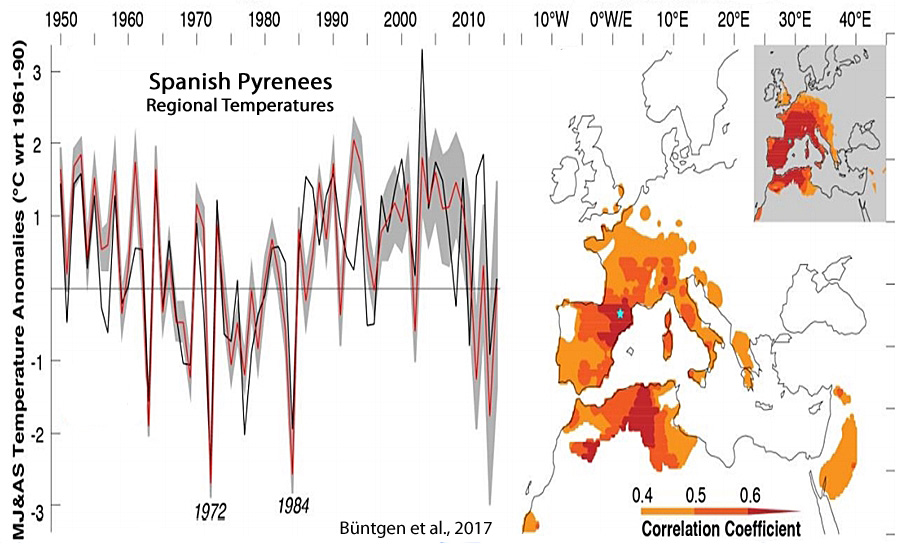
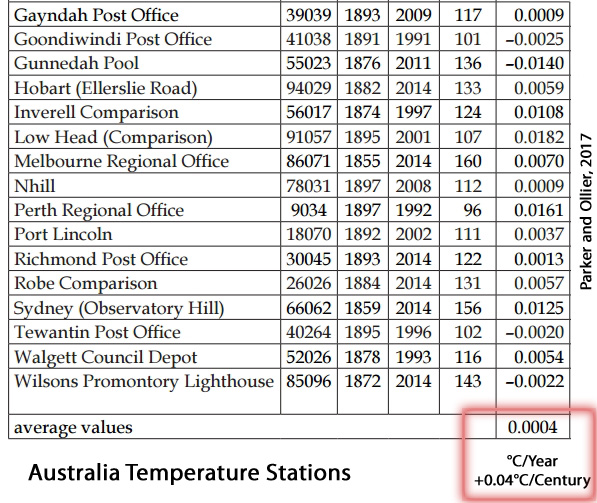
Parker and Ollier, 2017
“The Global Historical Climatology Network (GHCN) v2 temperature time series (GISS Surface Temperature Analysis, 2012) in Alice Spring and all the 36 other stations located in a circle of 1,000 km from Alice Spring do not show any warming. There are stations covering different time windows having very close patterns of temperatures. In this circle of 3,141,593 km2 (roughly 50% of Australia) that is mostly underdeveloped, none of the stations […] has a warming trend. … It is therefore only an artefact by BOM to produce the warming. Homogenization is supposed to be used to account for upwards biases such as Urban Heat Island, not to introduce upwards biases. … In the centre of Australia, all the stations available in a circle of radius 1,000 km were showing very little or no warming, as still acknowledged in the GHCN v2 data set up to October 2011 (Fig. 6). … Table 1 presents the warming trend for the 30 longest temperature records of Australia collected in a single location, with measurements started before 1900 and continued until after 1985. … In the 30 locations, the monthly mean maximum temperature is warming 0.0004°C/year, or 0.04°C/century. That means there is no change within the limits of accuracy of the measurements. … The climate trend maps compiled by Bureau of Meteorology in their climate change section are completely unreliable, as the alleged increasing temperature is obtained by lowering temperatures of the past by “adjustments”. The longest of the Australian temperature records that were considered the most reliable by Bureau of Meteorology on February 2009 (BOM 2009) are still available as raw temperatures in the climate data online section and consistently show no warming and no increased extreme events within the limit of accuracy of measurements.”

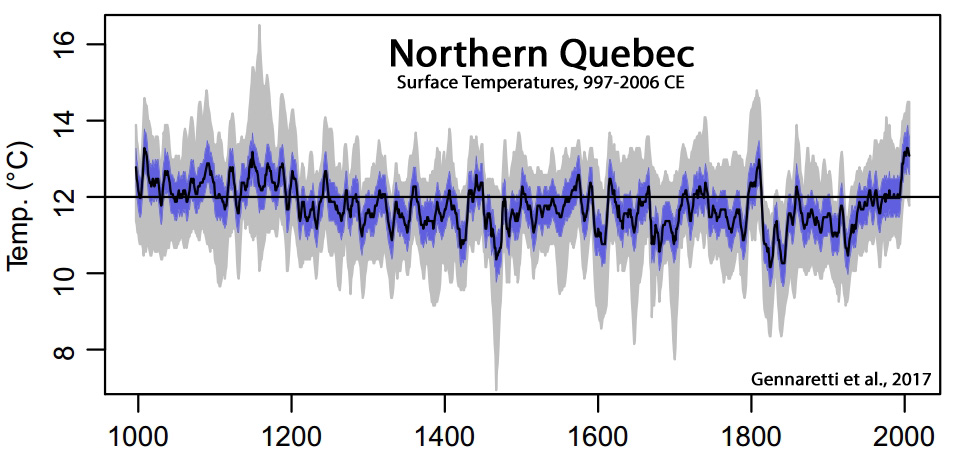
Gennaretti et al., 2017
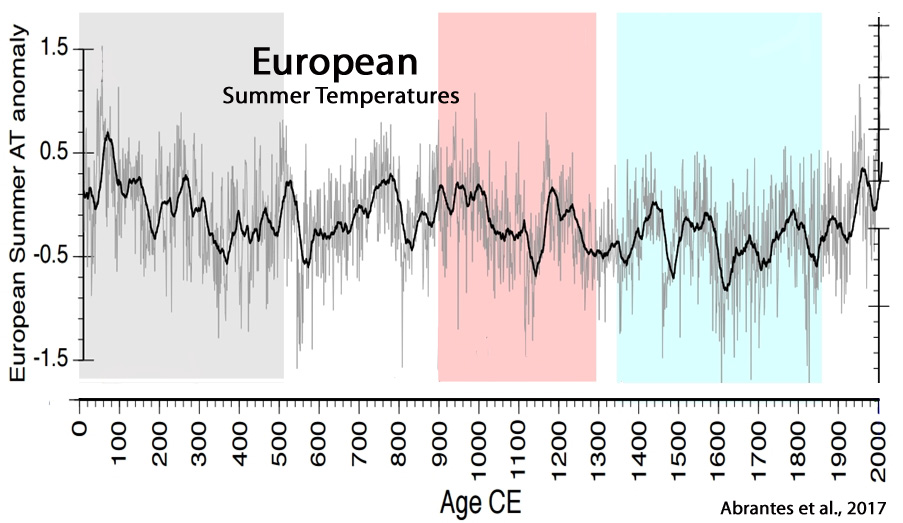
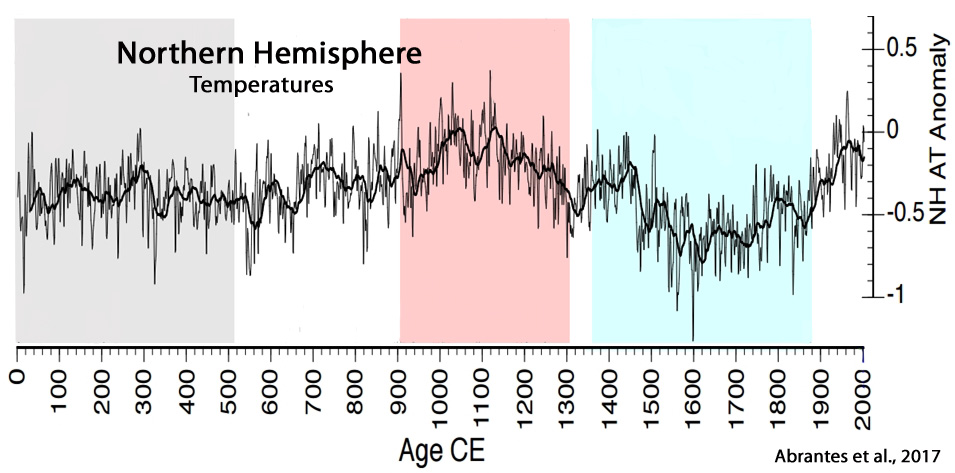
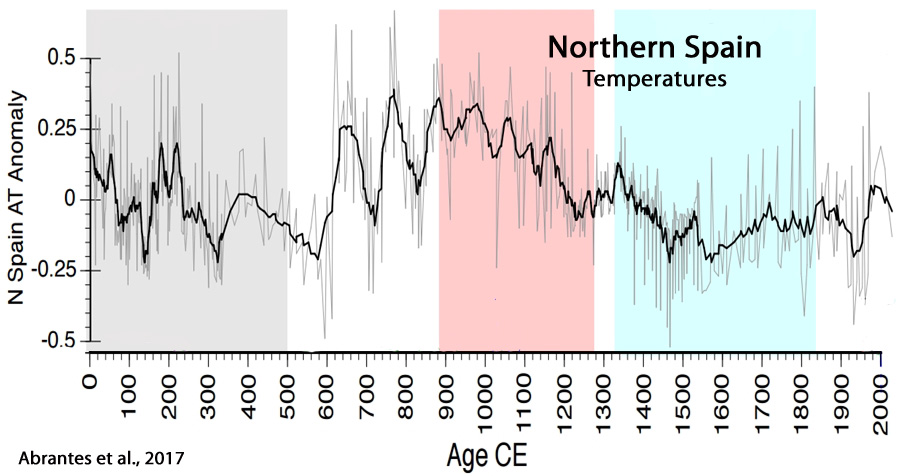
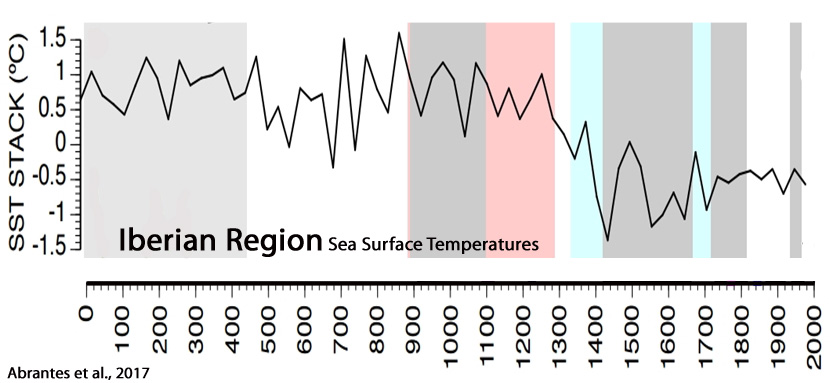
Abrantes et al., 2017
“The transition from warm to colder climatic conditions occurs around 1300 CE associated with the Wolf solar minimum. The coldest SSTs are detected between 1350 and 1850 CE, on Iberia during the well-known Little Ice Age (LIA) (Bradley and Jones, 1993), with the most intense cooling episodes related with other solar minima events, and major volcanic forcing and separated by intervals of relative warmth (e.g. (Crowley and Unterman, 2013; Solanki et al., 2004; Steinhilber et al., 2012; Turner et al., 2016; Usoskin et al., 2011). During the 20th century, the southern records show unusually large decadal scale SST oscillations in the context of the last 2 millennia, in particular after the mid 1970’s, within the Great Solar Maximum (1940 – 2000 (Usoskin et al., 2011)) and the “greater salinity anomaly” event in the northern Atlantic (Dickson et al., 1988), or yet the higher global temperatures of the last 1.4 ky detected by (Ahmed et al., 2013).”
Werner et al., 2017

Deng et al., 2017
“The results indicate that the climate of the Medieval Climate Anomaly (MCA, AD 900–1300) was similar to that of the Current Warm Period (CWP, AD 1850–present) … As for the Little Ice Age (LIA, AD 1550–1850), the results from this study, together with previous data from the Makassar Strait, indicate a cold and wet period compared with the CWP and the MCA in the western Pacific. The cold LIA period agrees with the timing of the Maunder sunspot minimum and is therefore associated with low solar activity.”

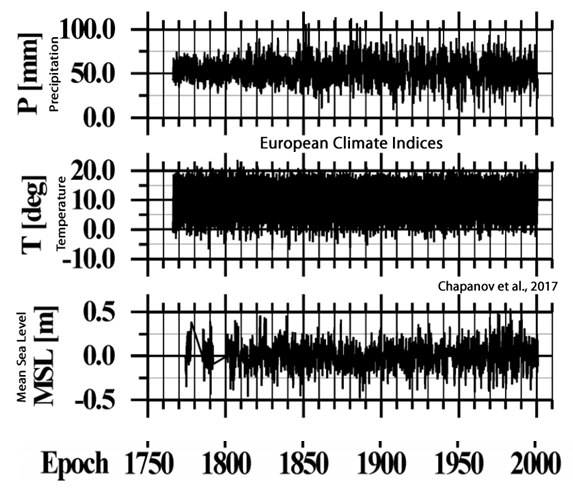
Chapanov et al., 2017
“A good agreement exists between the decadal cycles of LOD [length of day], MSL [mean sea level], climate and solar indices whose periods are between 12-13, 14-16, 16-18 and 28-33 years.”
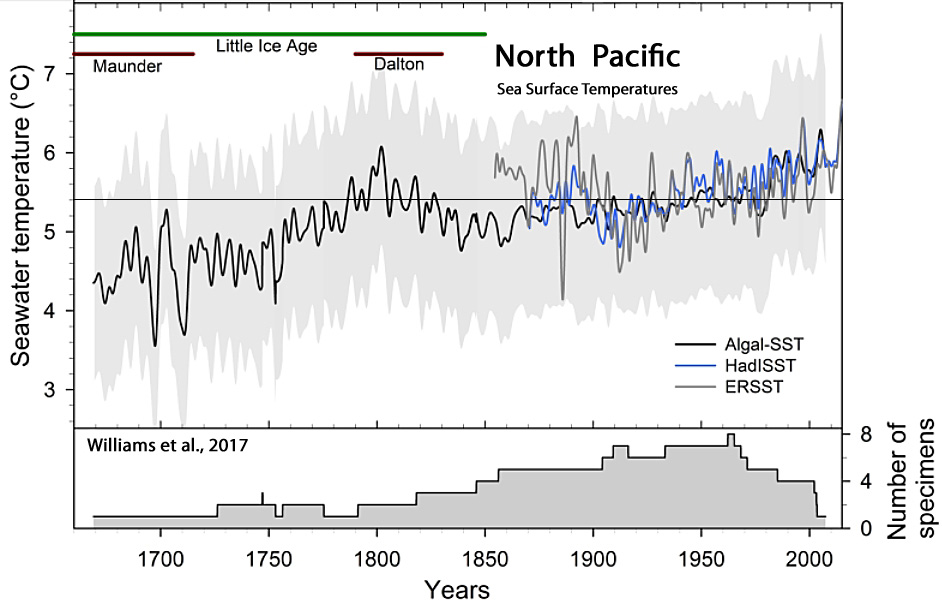
Williams et al., 2017
“Reconstructed SSTs significantly warmed 1.1°C … from 1660s to 1800 (rate of change: 0.008°C/year), followed by a significant cooling of 0.8°C … until 1840 (rate of change: 0.02°C/year), then a significant warming of 0.8°C from 1860 until the end of reconstruction in 2007 (rate of change: 0.005°C/year).” [The amplitude of sea surface temperature warming and cooling was higher and more rapid from the 1660s to 1800 than from 1860-2007.]
‘In fact, the SST reconstruction significantly co-varied with a reconstruction of solar irradiance [Lean, 2000] on the 11-year periodicity only from ~1745 to 1825. In addition, the reconstructed SSTs were cool during the period of lower than usual solar irradiance called the Maunder minimum (1645–1715) but then warmed and cooled during the Dalton minimum (1795–1830), a second period of reduced solar irradiance. … The Dalton solar minimum and increased volcanic activity in the early 1800s could explain the decreasing SSTs from 1800 to 1850.”
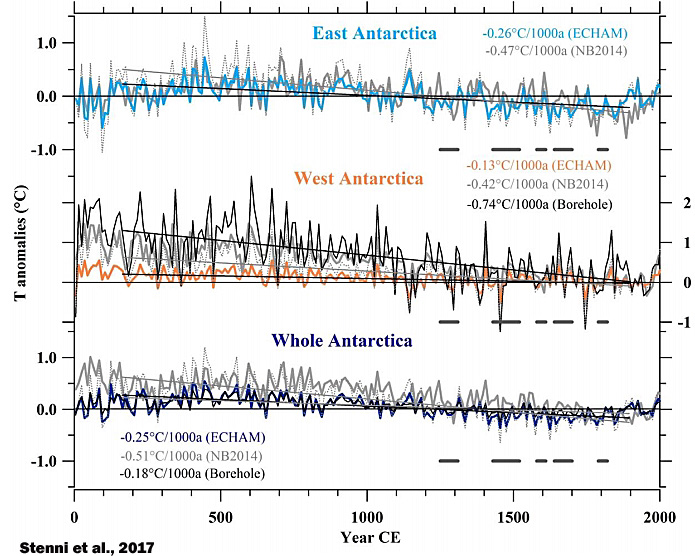
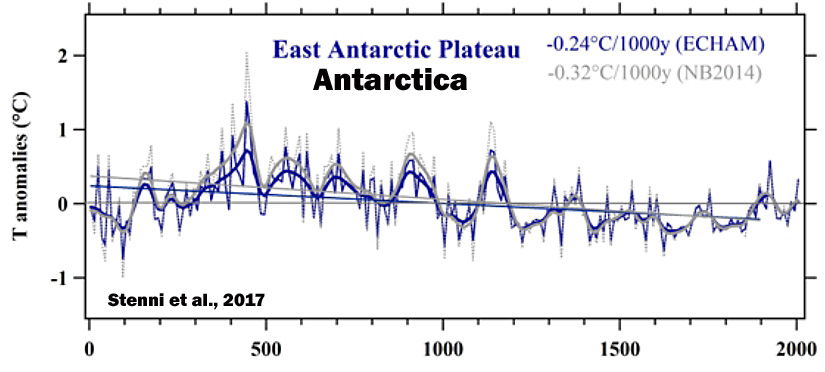
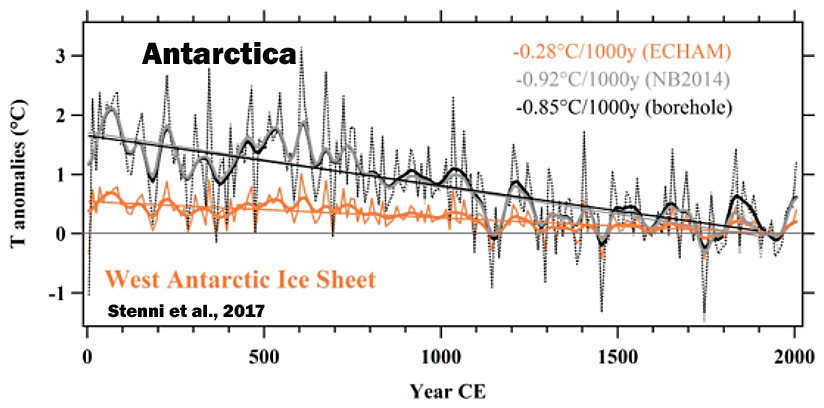
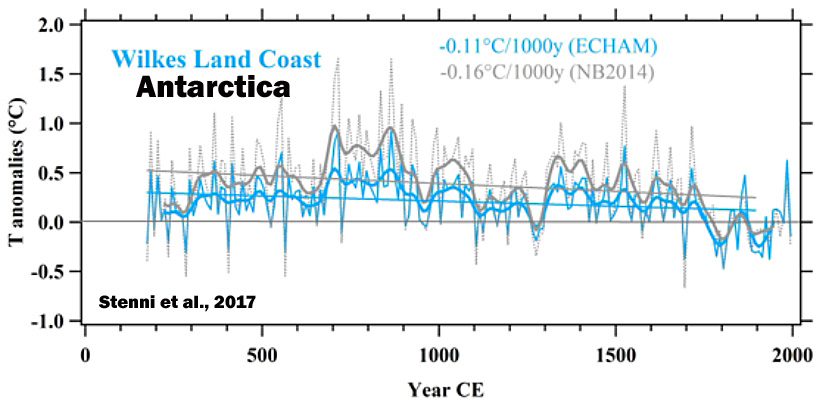
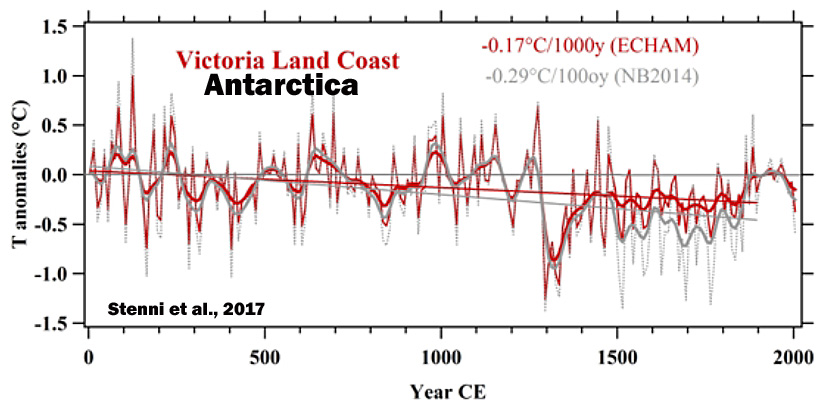
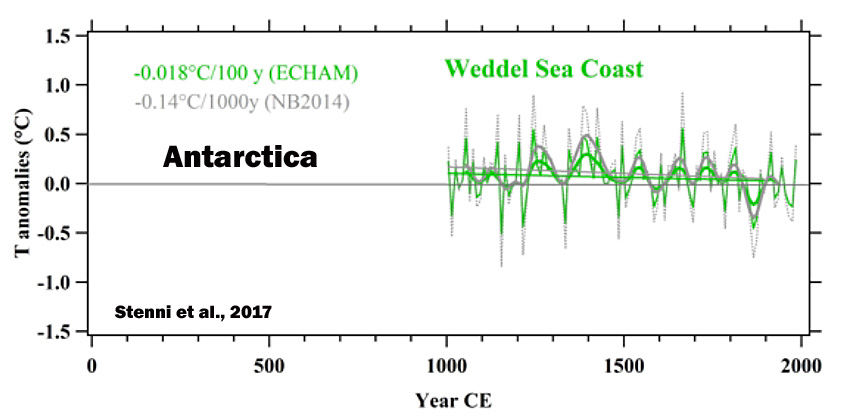
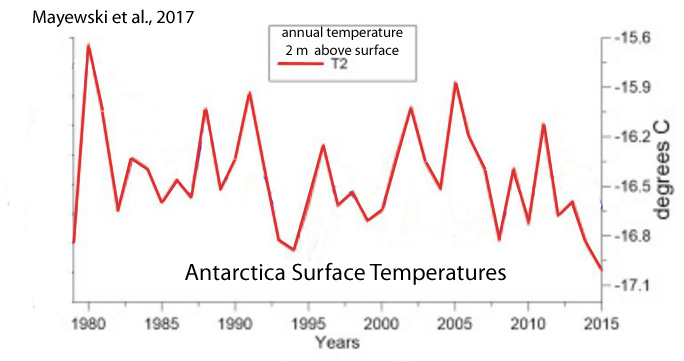
Stenni et al., 2017
“A recent effort to characterize Antarctic and sub-Antarctic climate variability during the last 200 years also concluded that most of the trends observed since satellite climate monitoring began in 1979 CE cannot yet be distinguished from natural (unforced) climate variability (Jones et al., 2016), and are of the opposite sign [cooling, not warming] to those produced by most forced climate model simulations over the same post-1979 CE interval. … (1) Temperatures over the Antarctic continent show an overall cooling trend during the period from 0 to 1900CE, which appears strongest in West Antarctica, and (2) no continent-scale warming of Antarctic temperature is evident in the last century.”
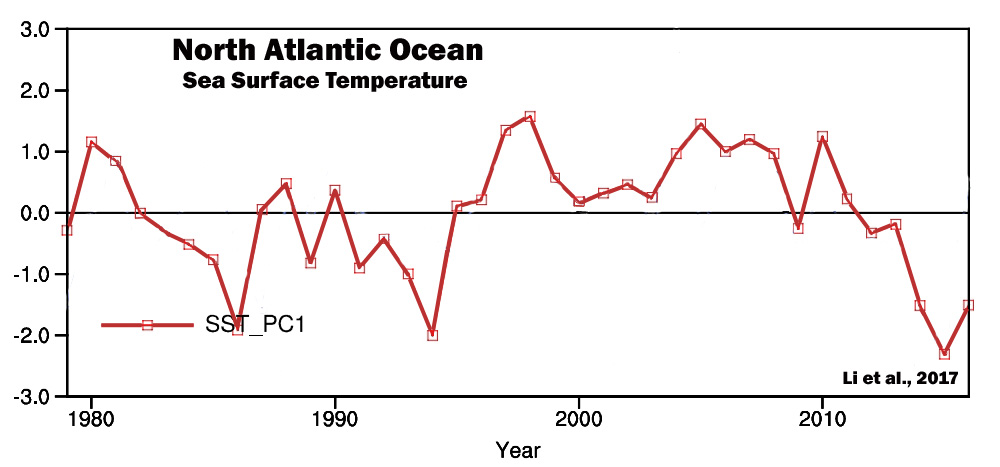
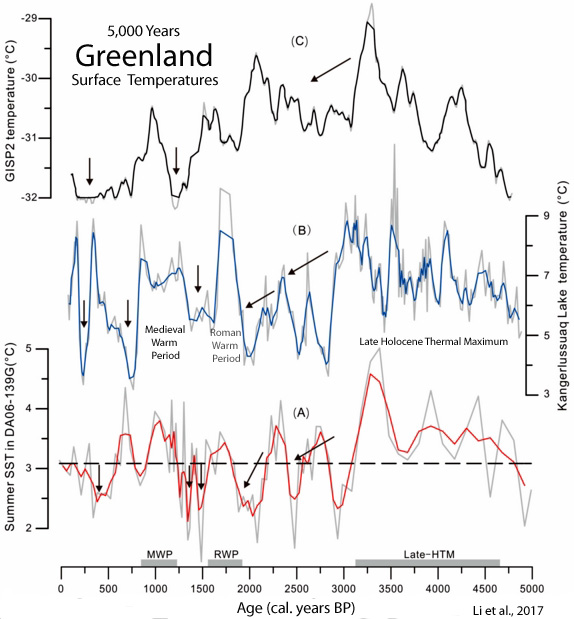
Li et al., 2017
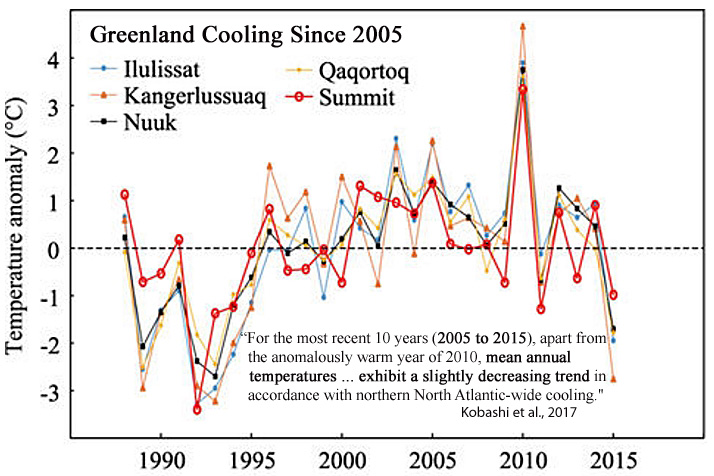
Kobashi et al., 2017
“After the 8.2 ka event, Greenland temperature reached the Holocene thermal maximum with the warmest decades occurring during the Holocene (2.9 ± 1.4 °C warmer than the recent decades) at 7960 ± 30 years B.P. … For the most recent 10 years (2005 to 2015), apart from the anomalously warm year of 2010, mean annual temperatures at the Summit exhibit a slightly decreasing trend in accordance with northern North Atlantic-wide cooling. The Summit temperatures are well correlated with southwest coastal records (Ilulissat, Kangerlussuaq, Nuuk, and Qaqortoq).”
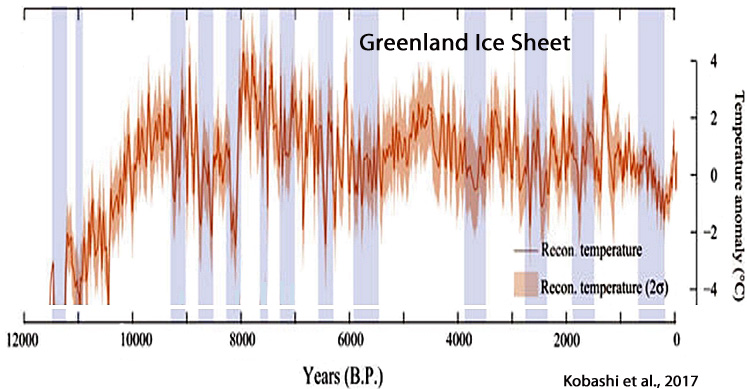
“For the most recent 10 years (2005 to 2015), apart from the anomalously warm year of 2010, mean annual temperatures at the Summit exhibit a slightly decreasing trend in accordance with northern North Atlantic-wide cooling. The Summit temperatures are well correlated with southwest coastal records (Ilulissat, Kangerlussuaq, Nuuk, and Qaqortoq).”
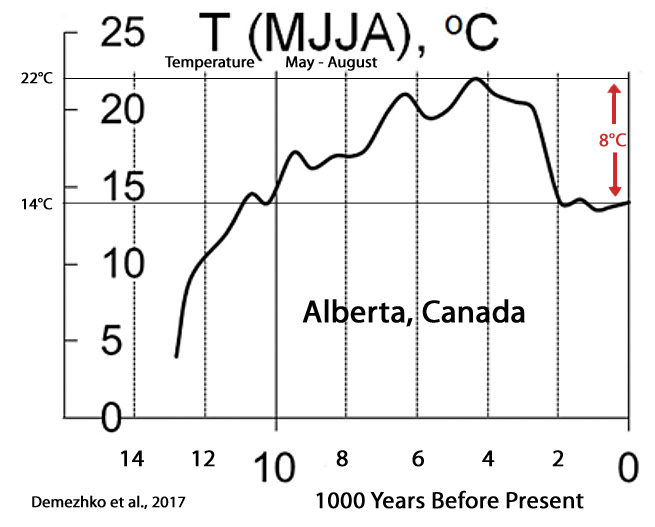
Demezhko et al., 2017
“GST [ground surface temperature] and SHF [surface heat flux] histories differ substantially in shape and chronology. Heat flux changes ahead temperature changes by 500–1000 years.”
Luoto and Nevalainen, 2017

Li et al., 2017
“The main driving forces behind the Holocene climatic changes in the LYR [Lower Yangtze Region, East China] area are likely summer solar insolation associated with tropical or subtropical macro-scale climatic circulations such as the Intertropical Convergence Zone (ITCZ), Western Pacific Subtropical High (WPSH), and El Niño/Southern Oscillation (ENSO).”

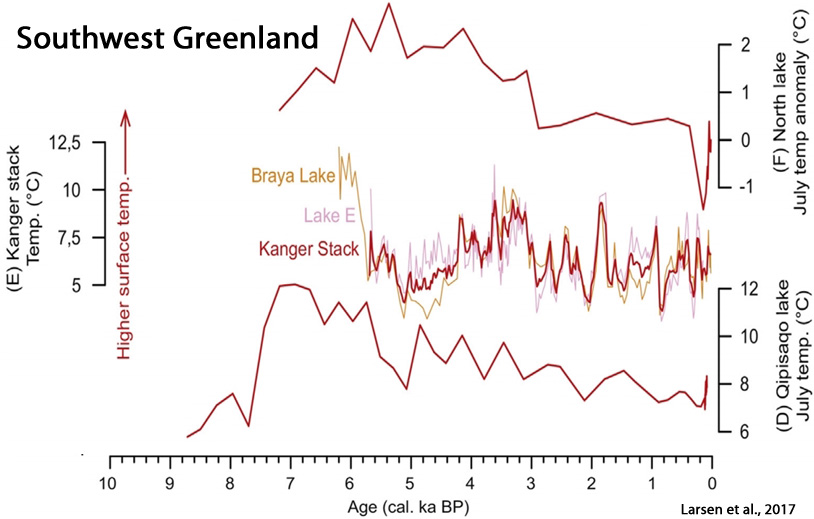
Larsen et al., 2017
“[K]nowledge remains sparse of GICs [glaciers and ice caps] fluctuations in Greenland and whether they survived past warmer conditions than today, e.g. the Holocene Thermal Maximum (HTM) ~8-5 cal. ka BP and the Medieval Climate Anomaly (MCA) ~1200-950 C.E. Only a few available studies have provided continuous records of Holocene glacier fluctuations in east Greenland (Lowell et al., 2013; Levy et al., 2014; Balascio et al., 2015) and west Greenland (Schweinsberg et al., 2017). These records show that local GICs [glaciers and ice caps] were significantly reduced and most likely completely absent during the HTM [Holocene Thermal Maximum].”
Zywiec et al., 2017
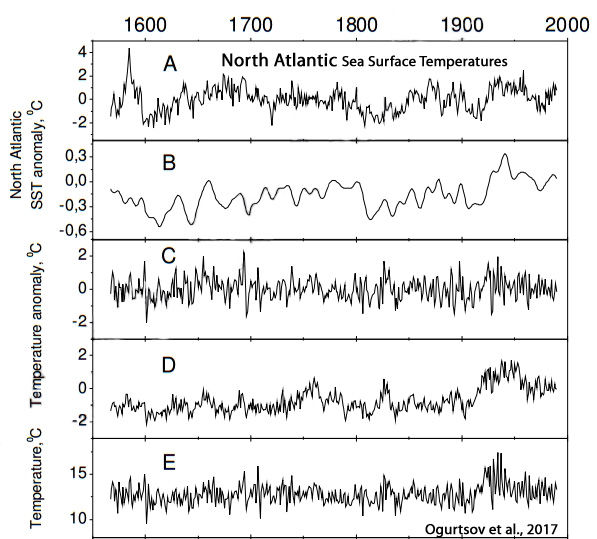
Ogurtsov et al., 2017
“Our analyses reveal appreciable and stable positive correlation between summer temperatures in Northern Fennoscandia and sea surface temperature in North Atlantic over AD 1567–1986. Thus a connection between climates of Northern Fennoscandia and North Atlantic basin is established for more than the last four centuries. Significant correlation was found between SST [sea surface temperatures] in NA [the North Atlantic] and solar activity (both instrumental data and proxies) during AD 1716–1986. … Thus, the connection between Northern Fennoscandian climate and solar activity, which has been previously established at century-scale (Ogurtsov et al., 2001, 2002, 2013) and millennial-scale (Helama et al., 2010), is confirmed for AD 1716–1986 over the entire frequency range using unfiltered records (with the exception for AMO reconstruction after Mann et al. (2009)).”
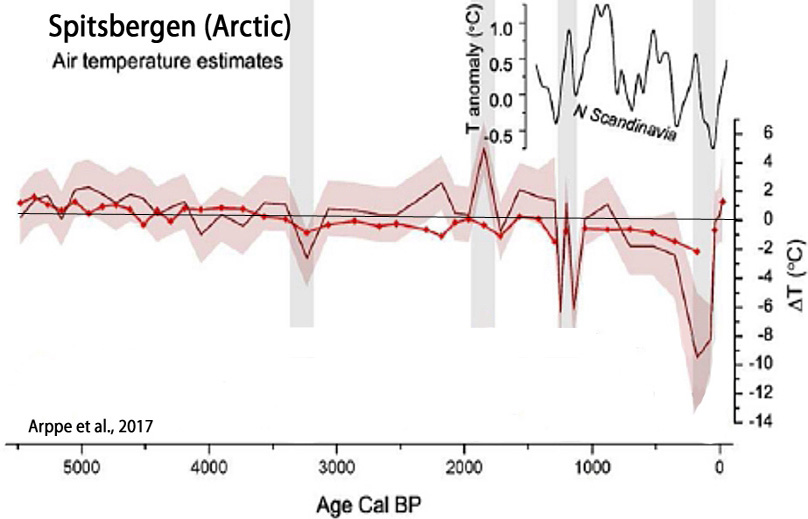
Arppe et al., 2017
“The highest δ18O [temperature proxy] value of the record occurs at ca. 1900–1800 cal. yr BP (~50–150 CE), coinciding with a period of general warmth referred to as the Roman Warm Period (RWP). In the North Atlantic Ocean, the RWP interval (ca. 2500–1500 cal. yr BP) is associated with, for example, increased temperatures and productivity, decreased evidence of ice … Northern Hemisphere terrestrial environments widely display evidence of elevated temperatures between 1 and 300 CE (Ljungqvist, 2010). … southern Spitsbergen experienced a significant late-Holocene cold spell prior to the onset of the LIA [Little Ice Age]. These negative shifts overlap with the latter part of a cooling known as the Dark Ages Cold Period (DACP, ca. 1500–1000 cal. yr BP; Bianchi and McCave, 1999; McDermott et al., 2001). The event is directly preceded by a minimum in total solar irradiation (Renssen et al., 2006; Steinhilber et al., 2009) … A wealth of proxy evidence testifies to the LIA [Little Ice Age] cooling, thought to have been triggered by reduced solar irradiance, extended volcanism, and internal characteristics of the ocean–atmosphere system (Miller et al., 2010, 2012; Wanner et al., 2011). … Factoring in respective age-model uncertainties, it appears that all major negative shifts, that is, ‘cold’ periods, in the δ18Olw record are roughly synchronous with periods of major negative anomalies in total solar irradiation and high modeled probabilities for extremely cold years in the Nordic Seas (Renssen et al., 2006), and widespread evidence of North Atlantic ‘cold spells’ (Bond et al., 2001; Sarnthein et al., 2003; Solomina et al., 2015; Wanner et al., 2008) linked to solar forcing.”
Mayewski et al., 2017
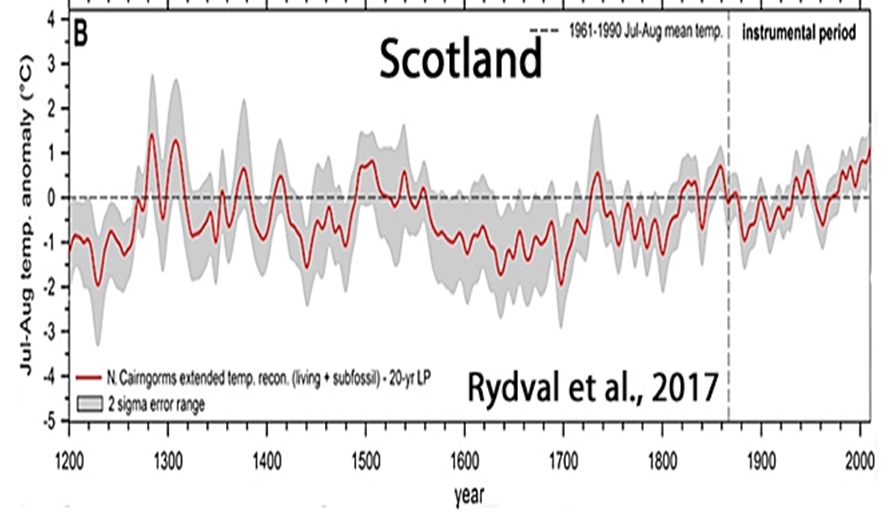
Rydval et al., 2017
“[T]he recent summer-time warming in Scotland is likely not unique when compared to multi-decadal warm periods observed in the 1300s, 1500s, and 1730s“

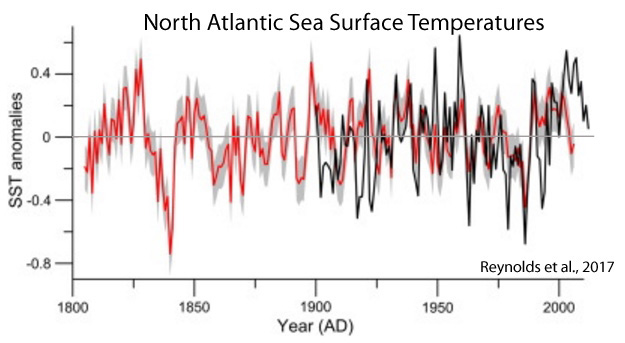
Reynolds et al., 2017
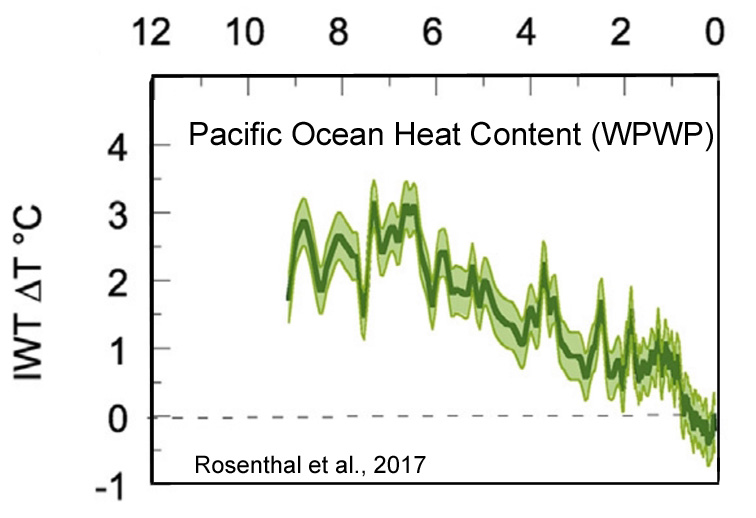
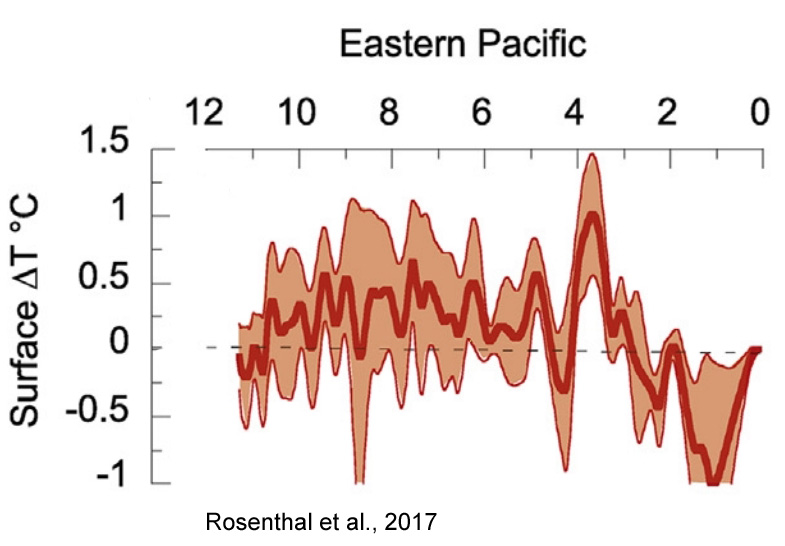
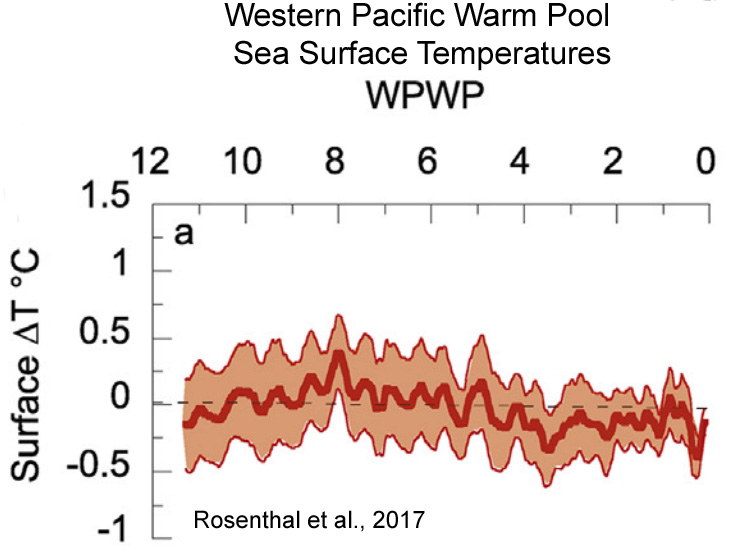
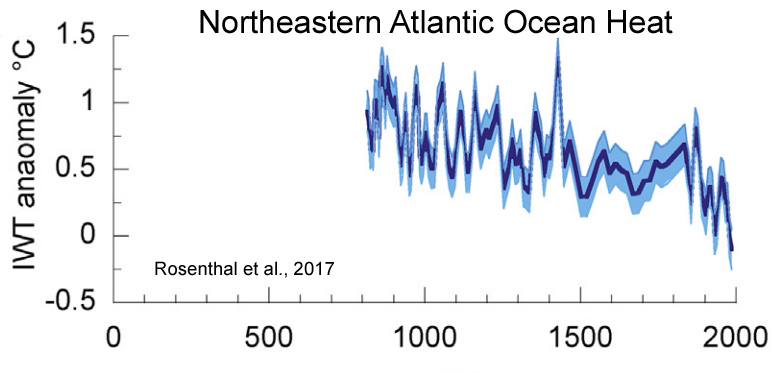
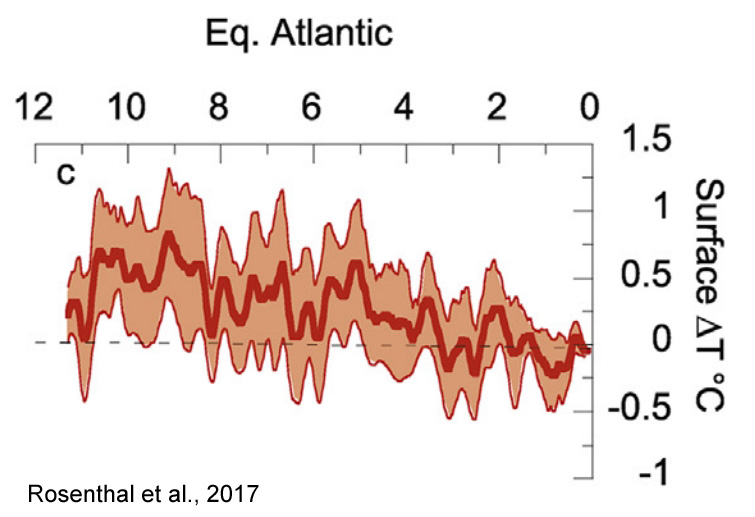
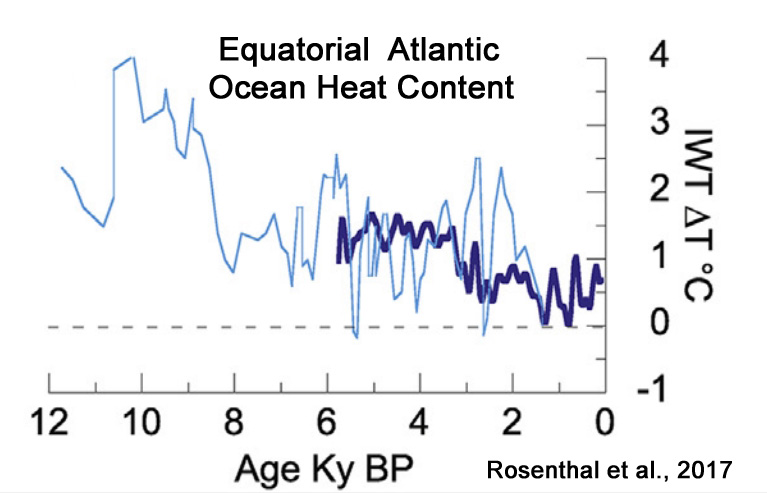
Rosenthal et al., 2017
“Here we review proxy records of intermediate water temperatures from sediment cores and corals in the equatorial Pacific and northeastern Atlantic Oceans, spanning 10,000 years beyond the instrumental record. These records suggests that intermediate waters [0-700 m] were 1.5-2°C warmer during the Holocene Thermal Maximum than in the last century. Intermediate water masses cooled by 0.9°C from the Medieval Climate Anomaly to the Little Ice Age. These changes are significantly larger than the temperature anomalies documented in the instrumental record. The implied large perturbations in OHC and Earth’s energy budget are at odds with very small radiative forcing anomalies throughout the Holocene and Common Era. … The records suggest that dynamic processes provide an efficient mechanism to amplify small changes in insolation [surface solar radiation] into relatively large changes in OHC.”
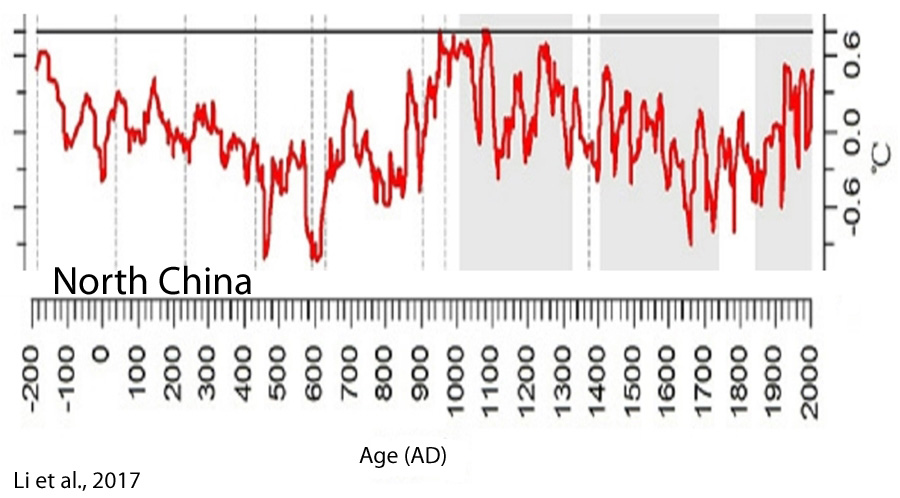
Li et al., 2017
“We suggest that solar activity may play a key role in driving the climatic fluctuations in NC [North China] during the last 22 centuries, with its quasi ∼100, 50, 23, or 22-year periodicity clearly identified in our climatic reconstructions. … It has been widely suggested from both climate modeling and observation data that solar activity plays a key role in driving late Holocene climatic fluctuations by triggering global temperature variability and atmospheric dynamical circulation“
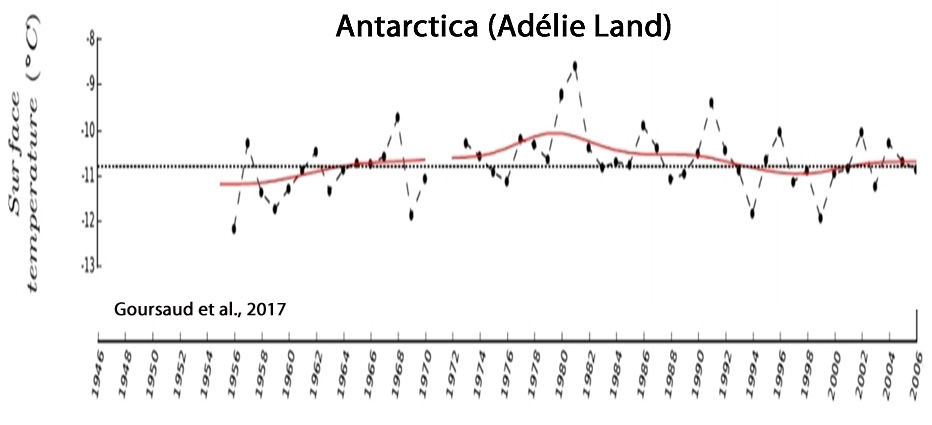
Goursaud et al., 2017
Guillet et al., 2017

Wilson et al., 2017

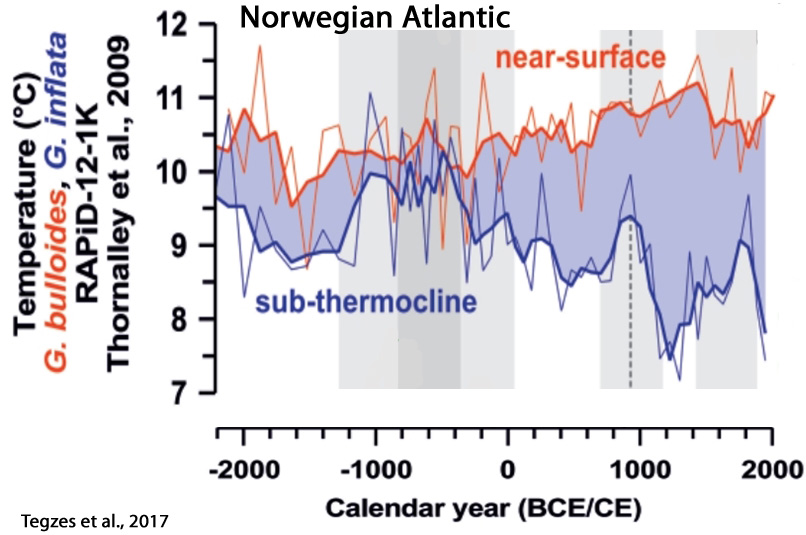
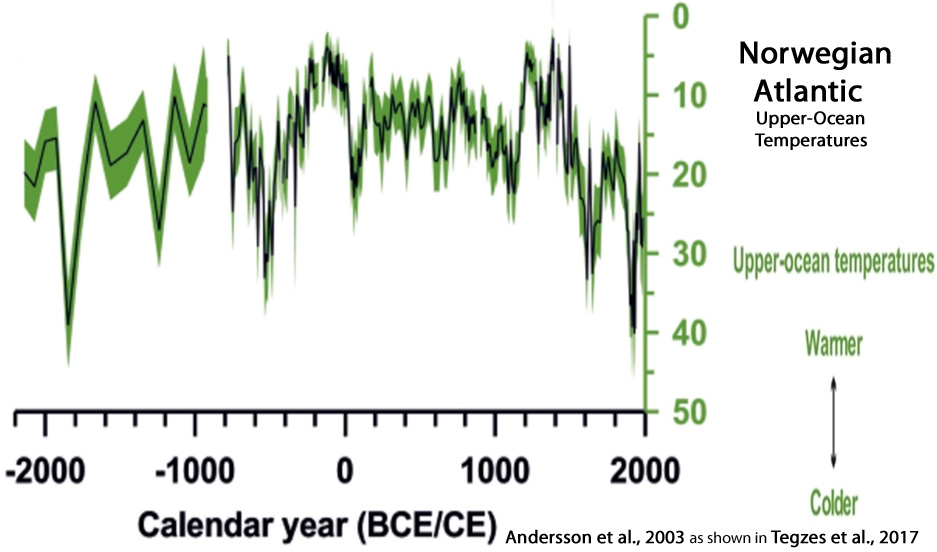
Tegzes et al., 2017
“Our sortable-silt time series show prominent multi-decadal to multi-centennial variability, but no clear long-term trend over the past 4200 years. … [O]ur findings indicate that variations in the strength of the main branch of the Atlantic Inflow may not necessarily translate into proportional changes in northward oceanic heat transport in the eastern Nordic Seas.”
Tejedor et al., 2017

Fernández-Fernández et al., 2017

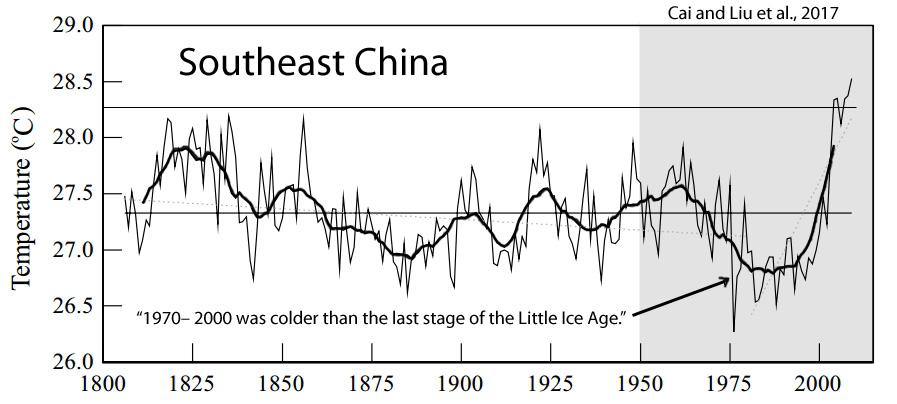
Cai and Liu et al., 2017
“2003– 2009 was the warmest period in the reconstruction. 1970– 2000 was colder than the last stage of the Little Ice Age (LIA).”
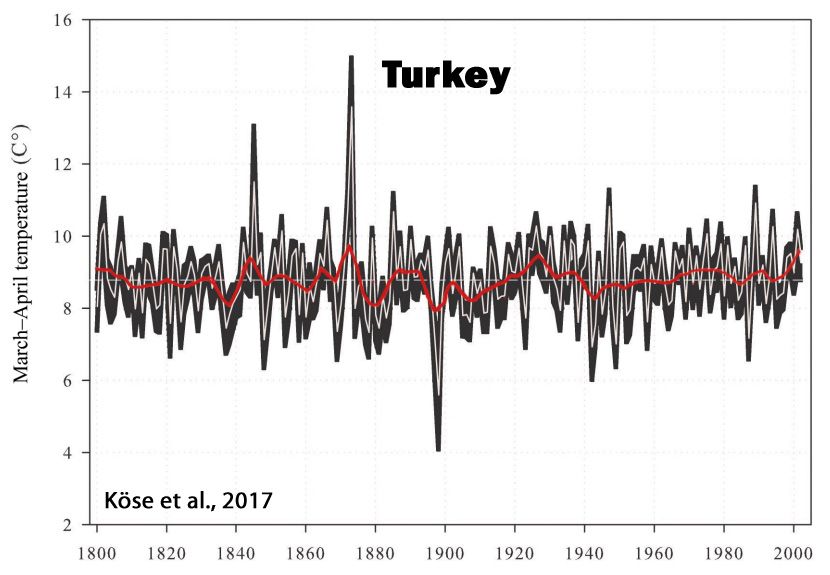
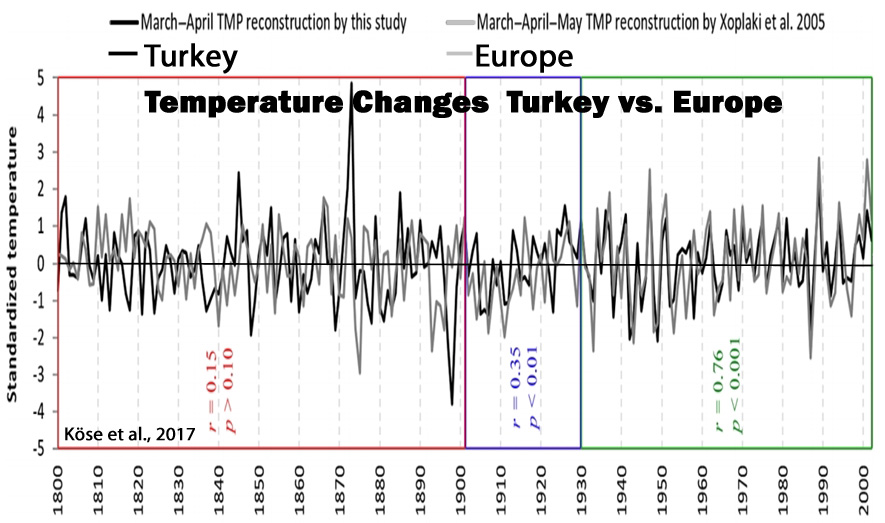
Köse et al., 2017
“The reconstruction is punctuated by a temperature increase during the 20th century; yet extreme cold and warm events during the 19th century seem to eclipse conditions during the 20th century. We found significant correlations between our March–April spring temperature reconstruction and existing gridded spring temperature reconstructions for Europe over Turkey and southeastern Europe. … During the last 200 years, our reconstruction suggests that the coldest year was 1898 and the warmest year was 1873. The reconstructed extreme events also coincided with accounts from historical records. … Further, the warming trends seen in our record agrees with data presented by Turkes and Sumer (2004), of which they attributed [20th century warming] to increased urbanization in Turkey.”
Flannery et al., 2017
“The early part of the reconstruction (1733–1850) coincides with the end of the Little Ice Age, and exhibits 3 of the 4 coolest decadal excursions in the record. However, the mean SST estimate from that interval during the LIA is not significantly different from the late 20th Century SST mean. The most prominent cooling event in the 20th Century is a decade centered around 1965. This corresponds to a basin-wide cooling in the North Atlantic and cool phase of the AMO.”

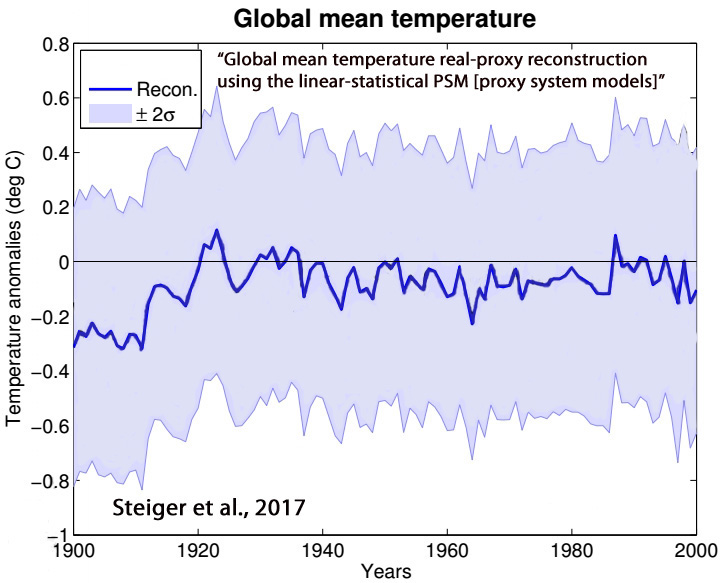
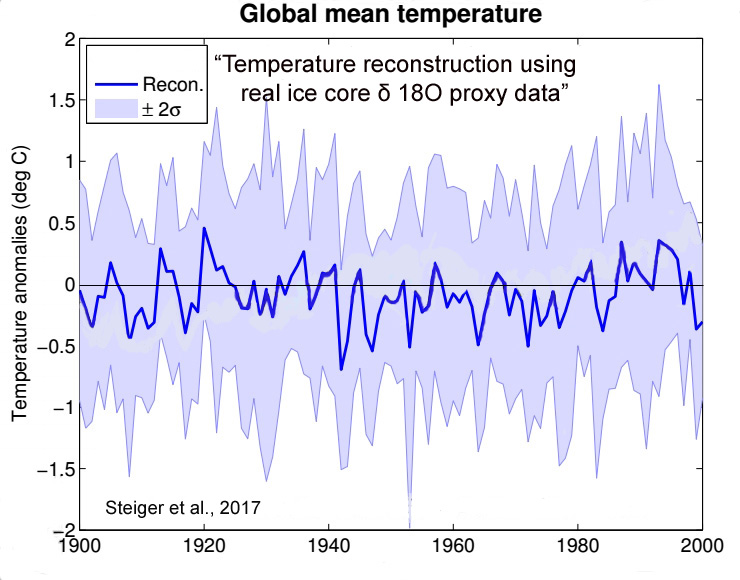
Steiger et al., 2017
“Through several idealized and real proxy experiments we assess the spatial and temporal extent to which isotope records can reconstruct surface temperature, 500 hPa geopotential height, and precipitation. We find local reconstruction skill to be most robust across the reconstructions, particularly for temperature and geopotential height, as well as limited non-local skill in the tropics. These results are in agreement with long-held views that isotopes in ice cores have clear value as local climate proxies, particularly for temperature and atmospheric circulation.”
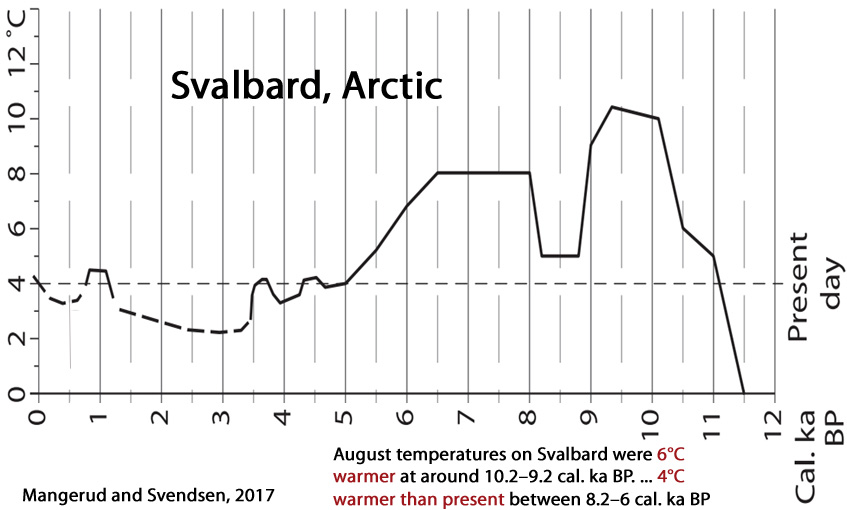
Mangerud and Svendsen, 2017
“Shallow marine molluscs that are today extinct close to Svalbard, because of the cold climate, are found in deposits there dating to the early Holocene. The most warmth-demanding species found, Zirfaea crispata, currently has a northern limit 1000 km farther south, indicating that August temperatures on Svalbard were 6°C warmer at around 10.2–9.2 cal. ka BP, when this species lived there. … After 8.2 cal. ka, the climate around Svalbard warmed again, and although it did not reach the same peak in temperatures as prior to 9 ka, it was nevertheless some 4°C warmer than present between 8.2 and 6 cal. ka BP. Thereafter, a gradual cooling brought temperatures to the present level at about 4.5 cal. ka BP. The warm early-Holocene climate around Svalbard was driven primarily by higher insolation and greater influx of warm Atlantic Water, but feedback processes further influenced the regional climate.”
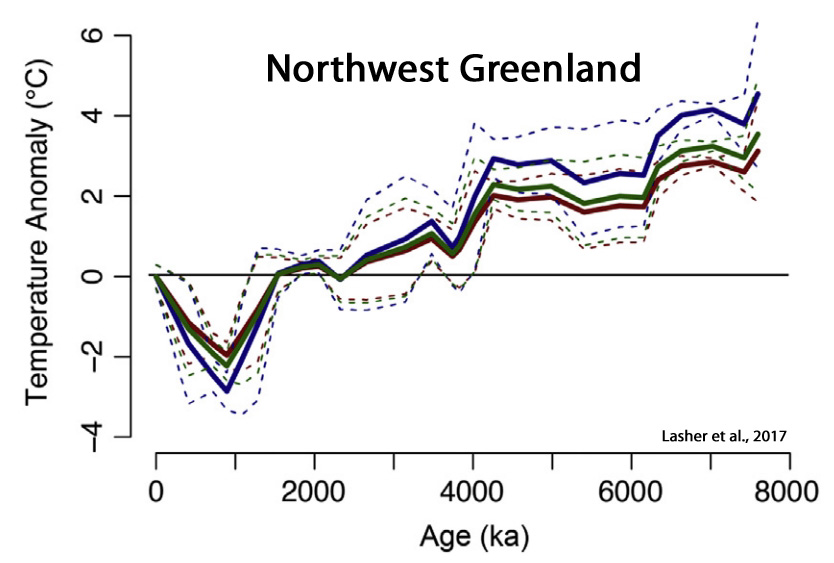
Lasher et al., 2017
“This paper presents a multi proxy lake record of NW Greenland Holocene climate. … Summer temperatures (2.5–4 °C warmer than present) persisted until ∼4 ka [4,000 years ago] … Continual cooling after 4 ka led to coldest temperatures after 1.2 ka, with temperature anomalies 2-3°C below present. Approximately 1000 km to the south, a 2-3°C July temperature anomaly (relative to [warmer than] present) between 6 and 5 ka was reported based upon chironomid assemblages near Illulisat and Jakobshavn (Axford et al., 2013). Across Baffin Bay on northeastern Baffin Island, HTM summer temperatures were an estimated ~5°C warmer than the pre-industrial late Holocene and 3.5°C warmer than present, based upon chironomid assemblages (Axford et al., 2009; Thomas et al., 2007). … Following deglaciation, the GrIS [Greenland Ice Sheet] retreated behind its present margins (by as much as 20-60 km in some parts of Greenland) during the HTM [Holocene Thermal Maximum] (Larsen et al., 2015; Young and Briner, 2015).”
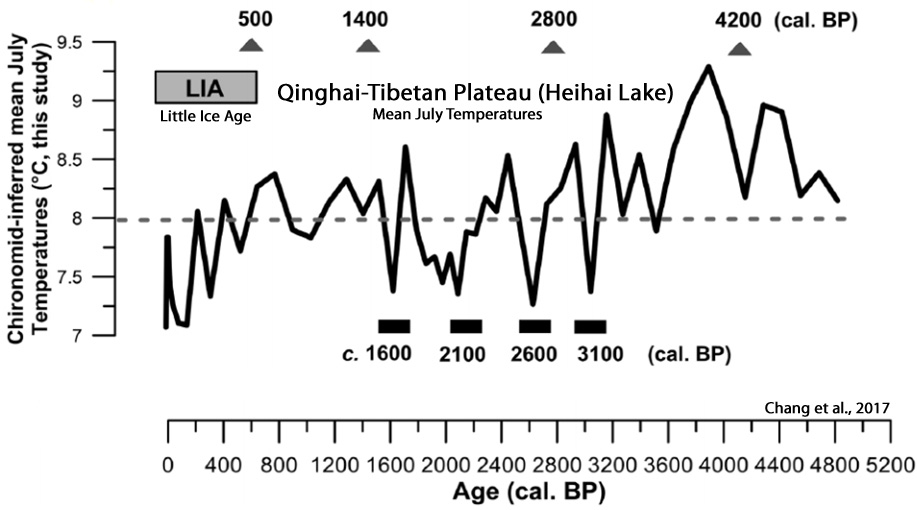
Chang et al., 2017
“The chironomid-based record from Heihai Lake shows a summer temperature fluctuation within 2.4°C in the last c. 5000 years from the south-east margin of the QTP [Qinghai–Tibetan Plateau]. … The summer temperature changes in this region respond primarily to the variation in the Asian Summer Monsoon. The variability of solar activity is likely an important driver of summer temperatures, either directly or by modifying the strength and intensity of the Indian Ocean Summer Monsoon. … We observed a relatively long-lasting summer cooling episode (c. 0.8°C lower than the 5000-year average) between c. 270 cal. BP and AD c. 1956. … The record shows cooling episodes occurred at c. 3100, 2600, 2100 and 1600 cal. BP. This is likely related to the period defined as the Northern Hemisphere Little Ice Age (LIA; c. AD 1350–1850, equivalent to 600–100 cal. BP). These possibly relate to the 500-year quasi-periodic solar cycle. Cooling stages between c. 270 and 100 cal. BP were also recorded and these are possibly linked to the LIA suggesting a hemisphere-wide forcing mechanism for this event.”
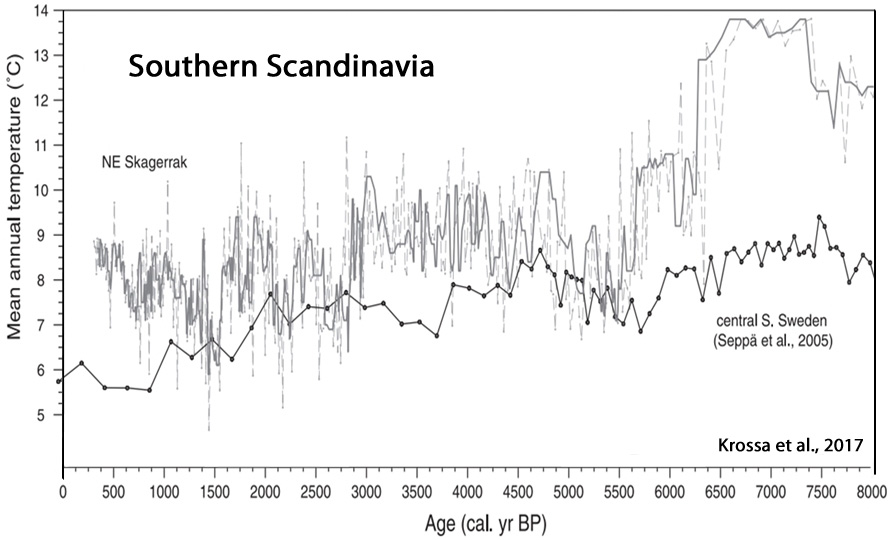
Krossa et al., 2017
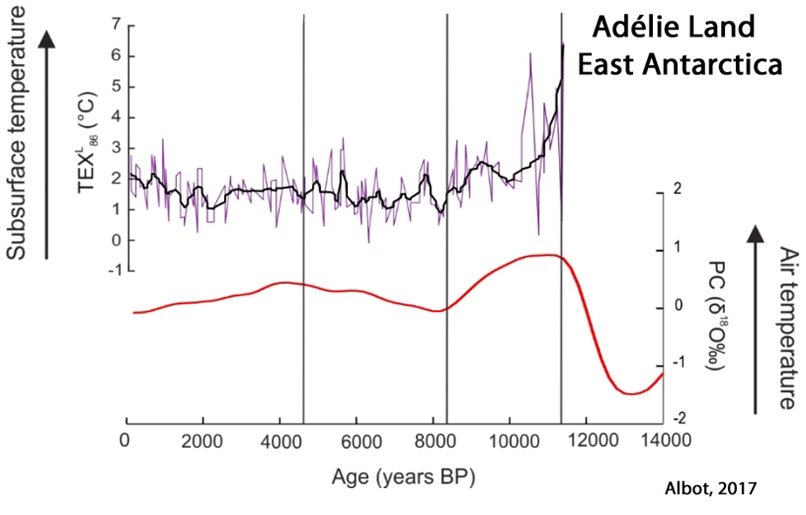
Albot, 2017
“Growing paleoclimatic evidence suggests that the climatic signals of Medieval Warm Period and the Little Ice Age events can be detected around the world (Mayewski et al., 2004; Bertler et al., 2011). … [T]he causes for these events are still debated between changes in solar output, increased volcanic activity, shifts in zonal wind distribution, and changes in the meridional overturning circulation (Crowley, 2000; Hunt, 2006).”
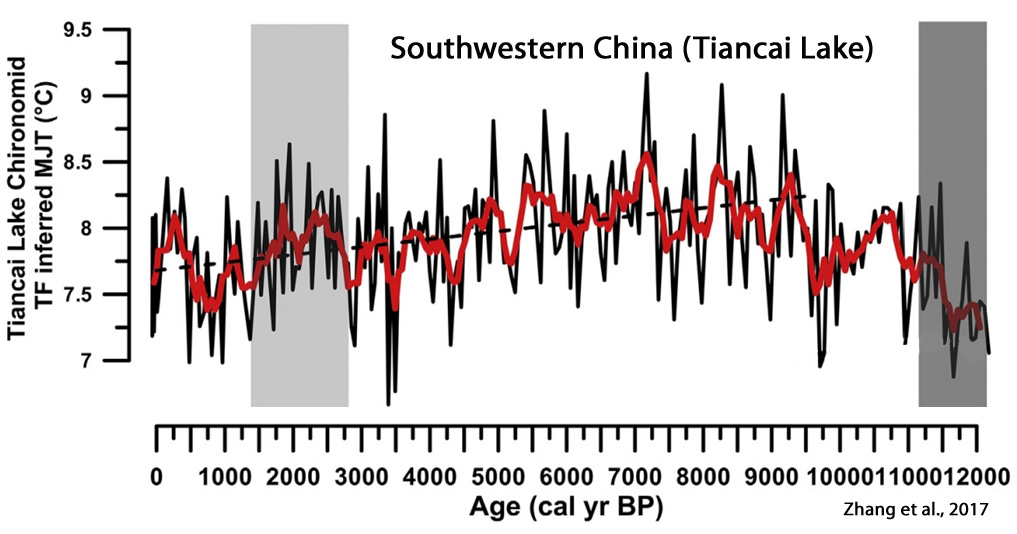
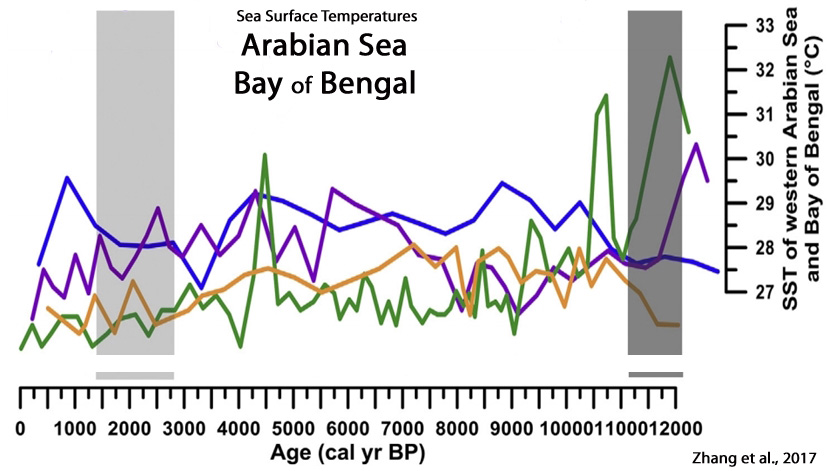
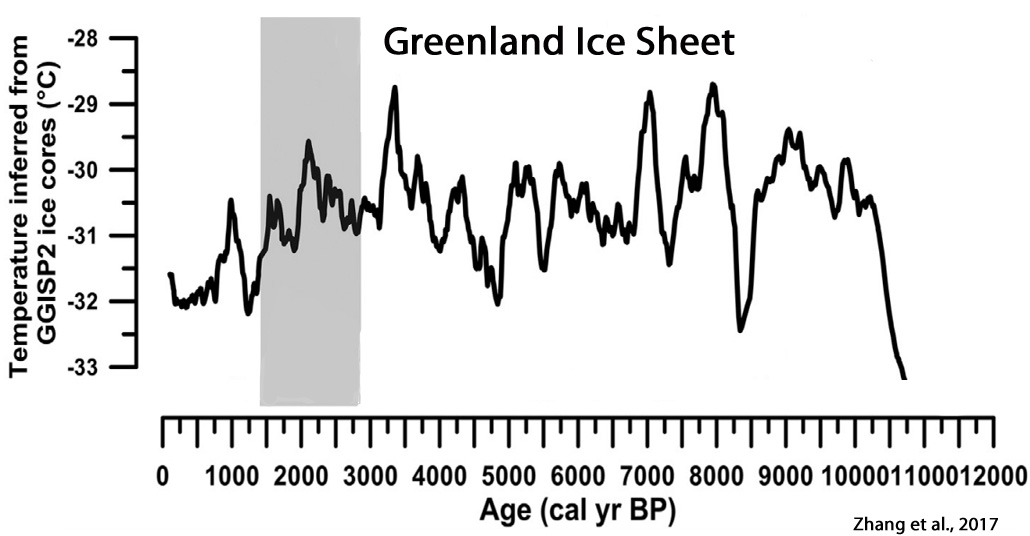
Zhang et al., 2017
“[S]ummer temperature variability at the QTP [Qinghai-Tibetan Plateau] responds rapidly to solar irradiance changes in the late Holocene”
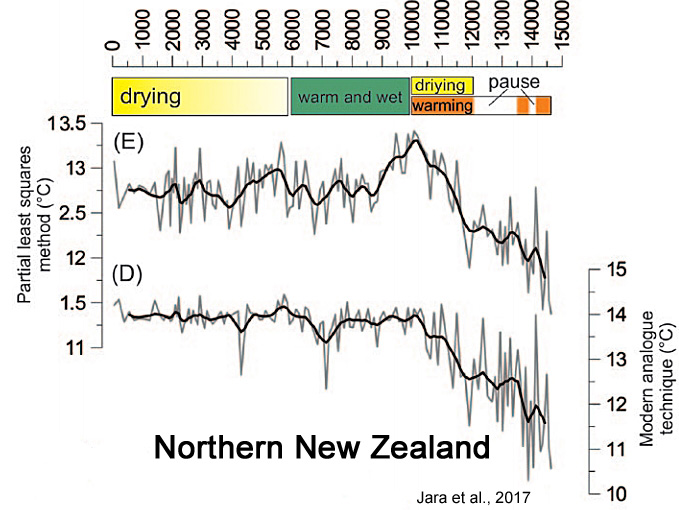
Jara et al., 2017
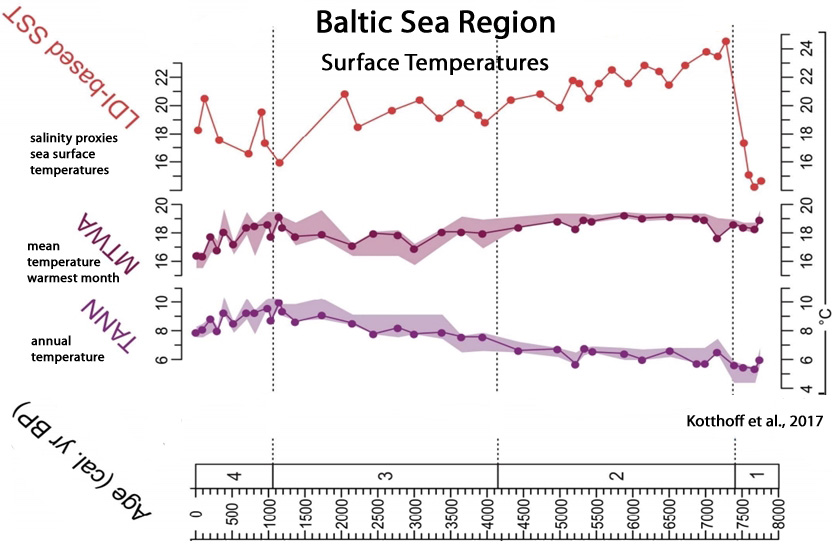
Kotthoff et al., 2017
Li et al., 2017
“Overall, the strong linkage between solar variability and summer SSTs is not only of regional significance, but is also consistent over the entire North Atlantic region.”
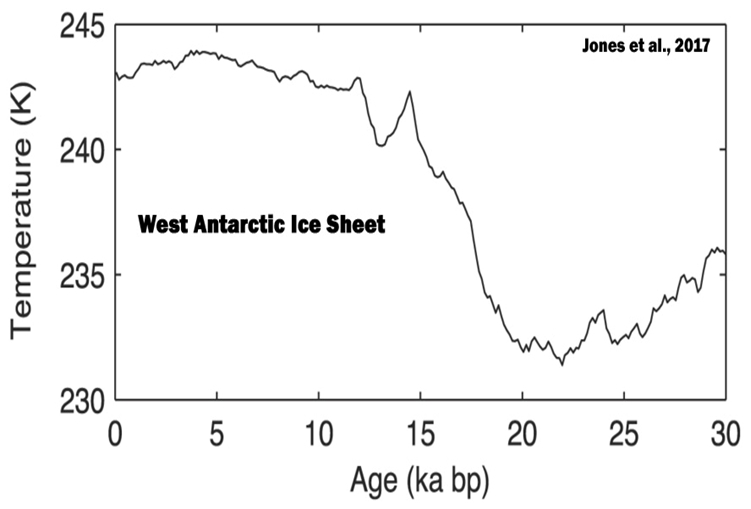
Jones et al., 2017
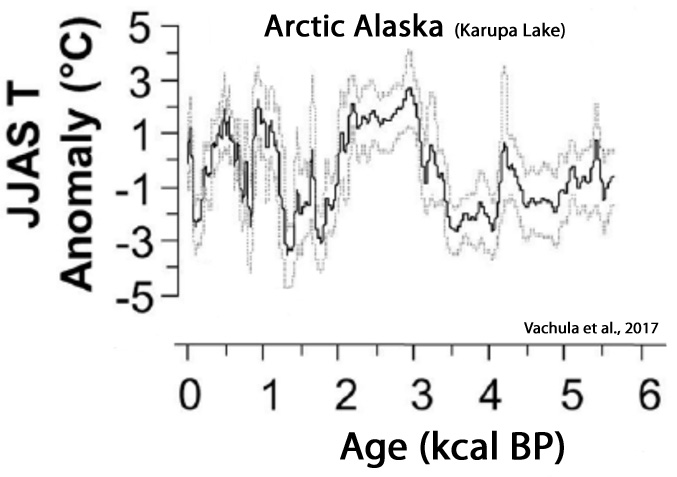
Vachula et al., 2017
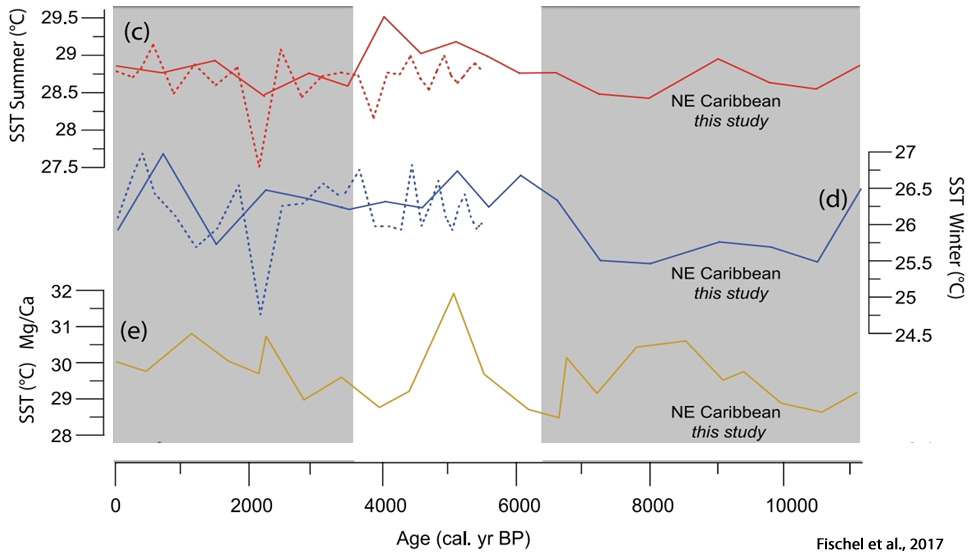
Fischel et al., 2017
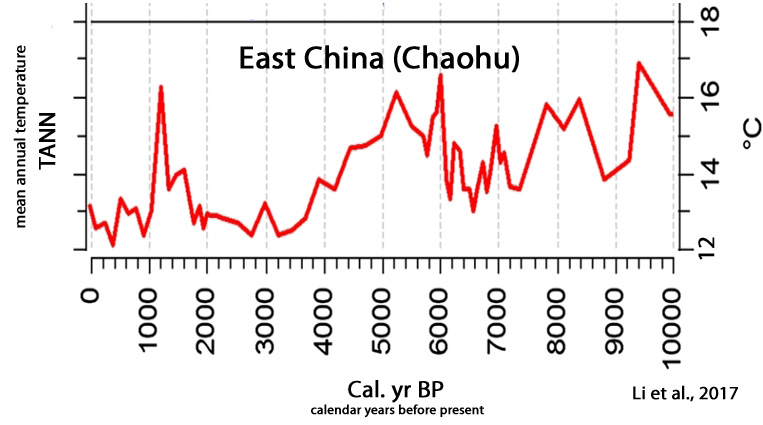
Li et al., 2017
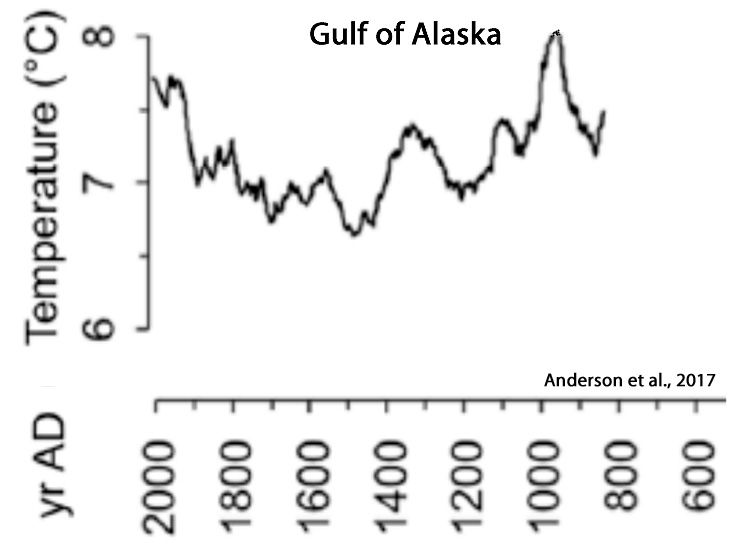
Anderson et al., 2017
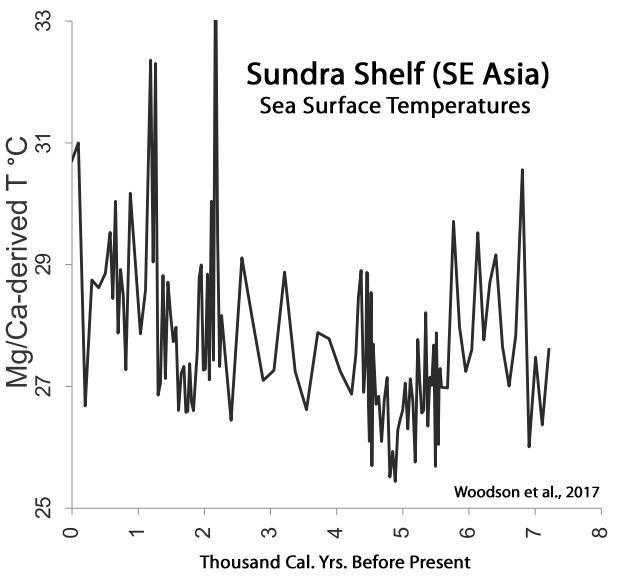
Woodson et al., 2017
“The last ca. 1000 years recorded the warmest SST averaging 28.5°C. We record, for the first time in this region, a cool interval, ca. 1000 years in duration, centered on 5000 cal years BP concomitant with a wet period recorded in Borneo. The record also reflects a warm interval from ca. 1000 to 500 cal years BP that may represent the Medieval Climate Anomaly. Variations in the East Asian Monsoon (EAM) and solar activity are considered as potential drivers of SST trends. However, hydrology changes related to the El Nino-Southern Oscillation (ENSO) variability, ~ shifts of the Western Pacific Warm Pool and migration of the Intertropical Convergence Zone are more likely to have impacted our SST temporal trend. … The SA [solar activity] trends (Steinhilber et al., 2012) are in general agreement with the regional cooling of SST (Linsley et al., 2010) and the SA [solar activity] oscillations are roughly coincident with the major excursions in our SST data.”
Koutsodendris et al., 2017
“Representing one of the strongest global climate instabilities during the Holocene, the Little Ice Age (LIA) is marked by a multicentennial-long cooling (14-19th centuries AD) that preceded the recent ‘global warming’ of the 20th century. The cooling has been predominantly attributed to reduced solar activity and was particularly pronounced during the 1645-1715 AD and 1790-1830 AD solar minima, which are known as Maunder and Dalton Minima, respectively.”

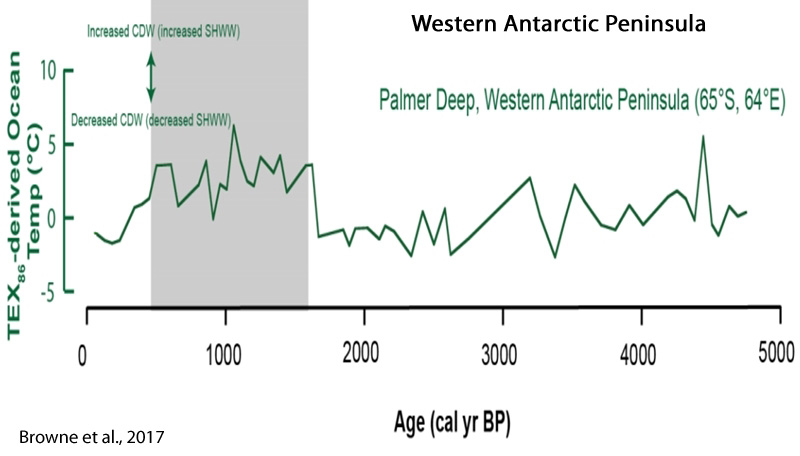
Browne et al., 2017
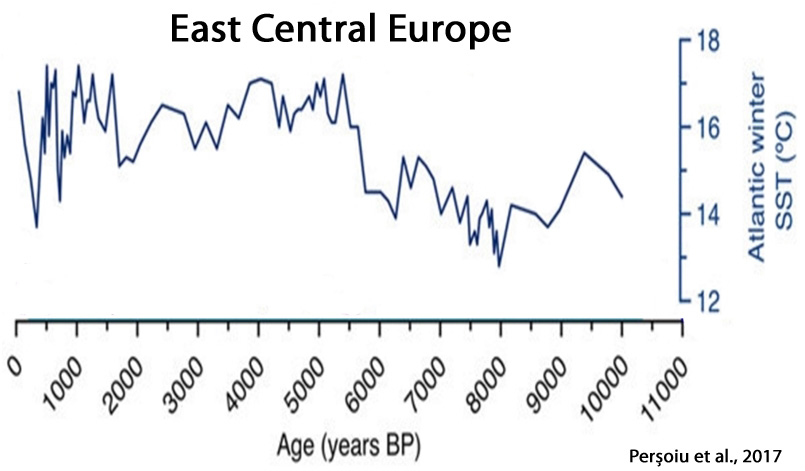
Perșoiu et al., 2017
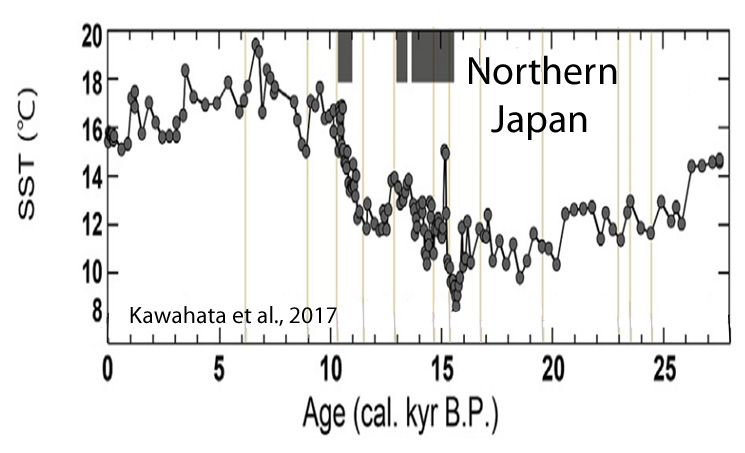
Kawahata et al., 2017
“The SST [sea surface temperature] shows a broad maximum (~17.3 °C) in the mid-Holocene (5-7 cal kyr BP), which corresponds to the Jomon transgression. … The SST maximum continued for only a century and then the SST [sea surface temperatures] dropped by 3.5 °C [15.1 to 11.6 °C] within two centuries. Several peaks fluctuate by 2°C over a few centuries.”
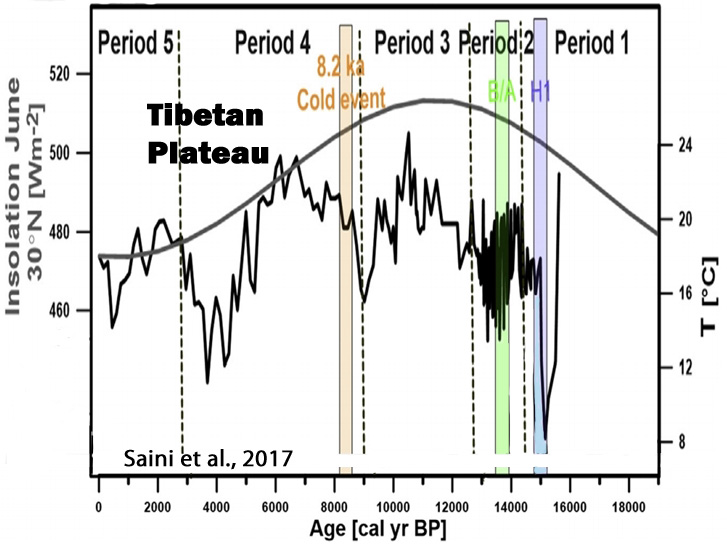
Saini et al., 2017
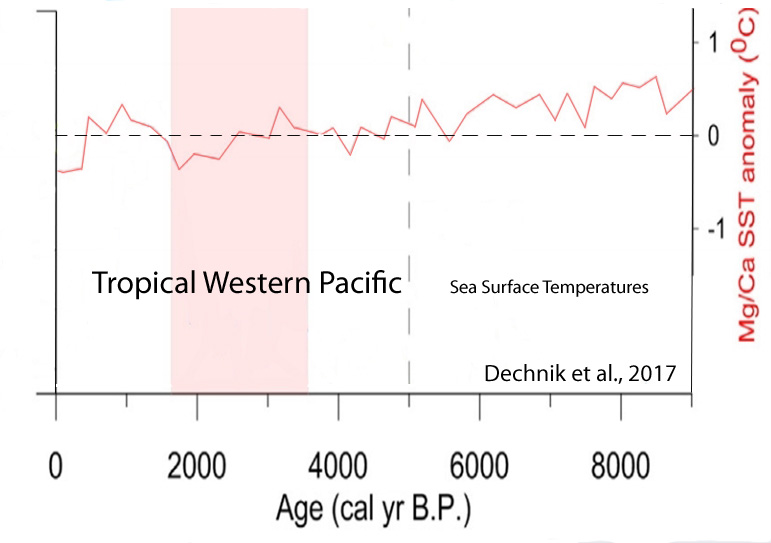
Dechnik et al., 2017
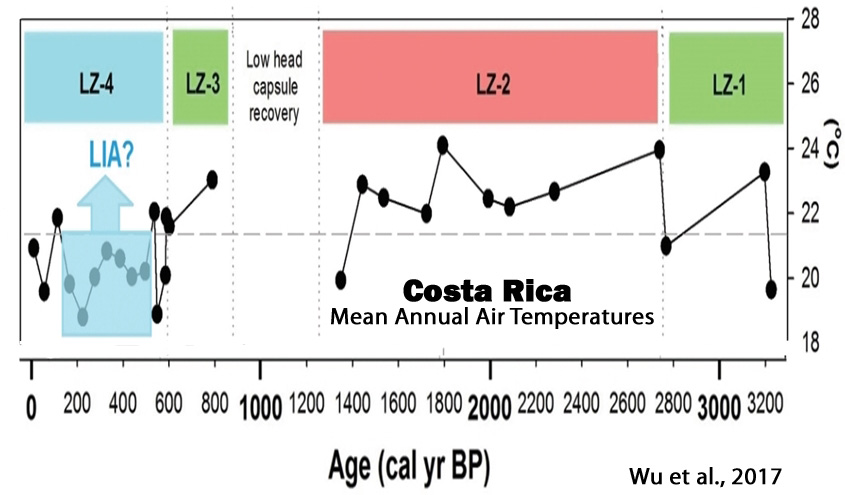
Wu et al., 2017

Sun et al., 2017
“Our findings are generally consistent with other records from the ISM [Indian Summer Monsoon] region, and suggest that the monsoon intensity is primarily controlled by solar irradiance on a centennial time scale. This external forcing may have been amplified by cooling events in the North Atlantic and by ENSO activity in the eastern tropical Pacific, which shifted the ITCZ further southwards.”

Wu et al., 2017
“The existence of depressed MAAT [mean annual temperatures] (1.3°C lower than the 3200-year average) between 1480 CE and 1860 CE (470–90 cal. yr BP) may reflect the manifestation of the ‘Little Ice Age’ (LIA) in southern Costa Rica. Evidence of low-latitude cooling and drought during the ‘LIA’ has been documented at several sites in the circum-Caribbean and from the tropical Andes, where ice cores suggest marked cooling between 1400 CE and 1900 CE. Lake and marine records recovered from study sites in the southern hemisphere also indicate the occurrence of ‘LIA’ cooling. High atmospheric aerosol concentrations, resulting from several large volcanic eruptions and sea-ice/ocean feedbacks, have been implicated as the drivers responsible for the ‘LIA’.”
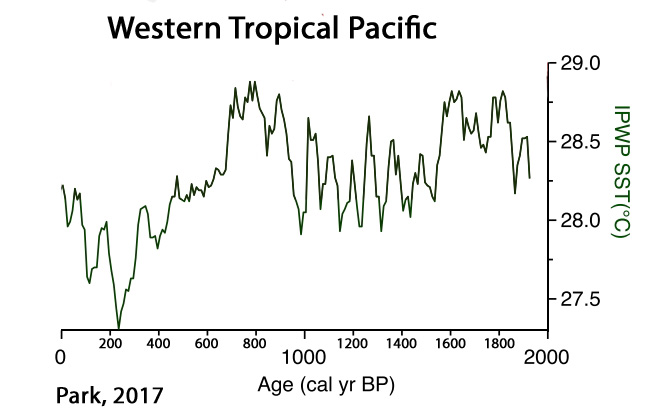
Park, 2017
“Late Holocene climate change in coastal East Asia was likely driven by ENSO variation. Our tree pollen index of warmness (TPIW) shows important late Holocene cold events associated with low sunspot periods such as Oort, Wolf, Spörer, and Maunder Minimum. Comparisons among standard Z-scores of filtered TPIW, ΔTSI, and other paleoclimate records from central and northeastern China, off the coast of northern Japan, southern Philippines, and Peru all demonstrate significant relationships [between solar activity and climate]. This suggests that solar activity drove Holocene variations in both East Asian Monsoon (EAM) and El Niño Southern Oscillation (ENSO).”
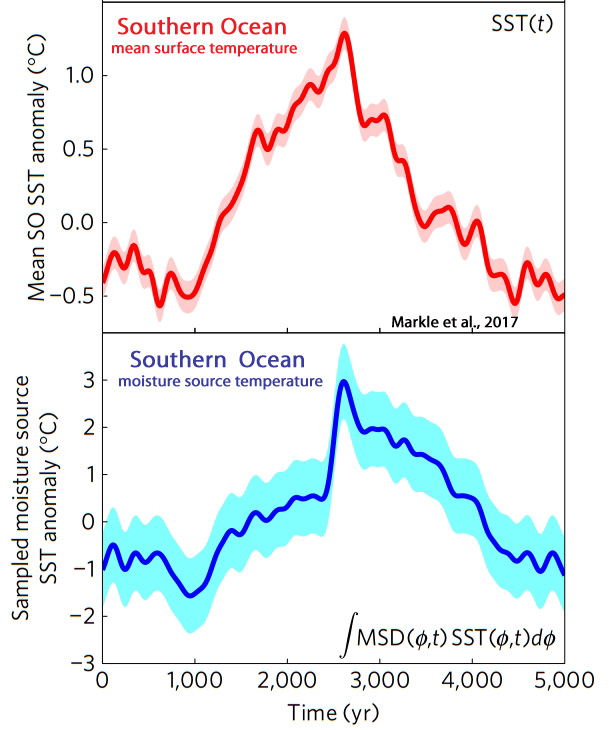
Markle et al., 2017
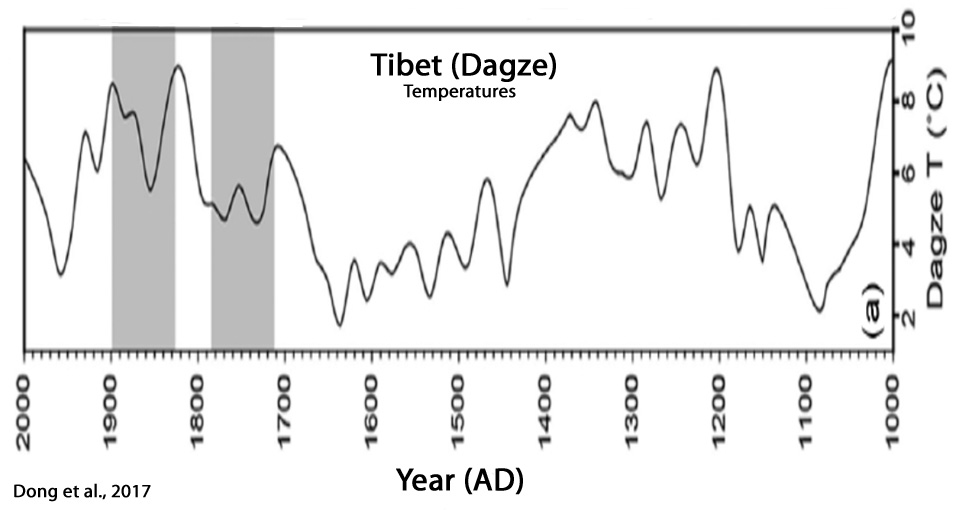
Dong et al., 2017
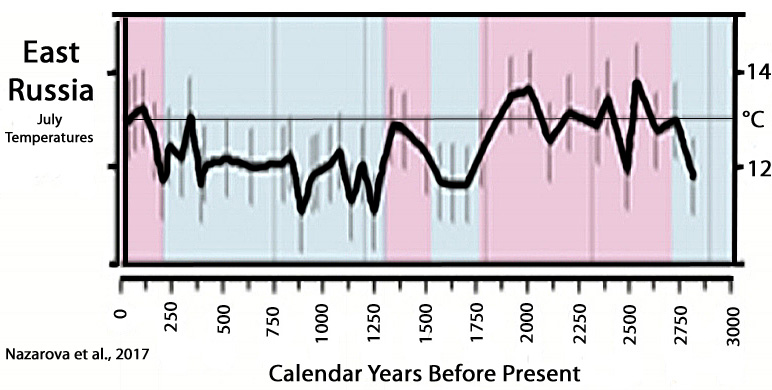
Nazarova et al., 2017
“The application of transfer functions resulted in reconstructed T July fluctuations of approximately 3 °C over the last 2800 years. Low temperatures (11.0-12.0 °C) were reconstructed for the periods between ca 1700 and 1500 cal yr BP (corresponding to the Kofun cold stage) and between ca 1200 and 150 cal yr BP (partly corresponding to the Little Ice Age [LIA]). Warm periods (modern T[emperatures] July or higher) were reconstructed for the periods between ca 2700 and 1800 cal yr BP, 1500 and 1300 cal yr BP and after 150 cal yr BP.”
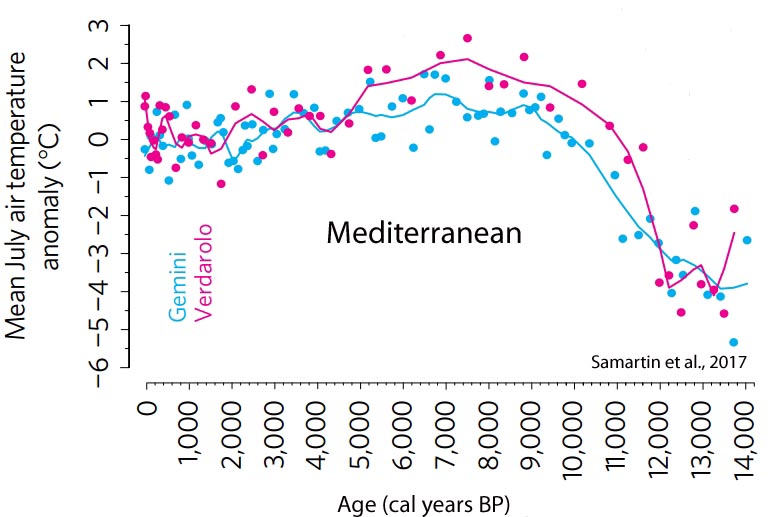
Samartin et al., 2017
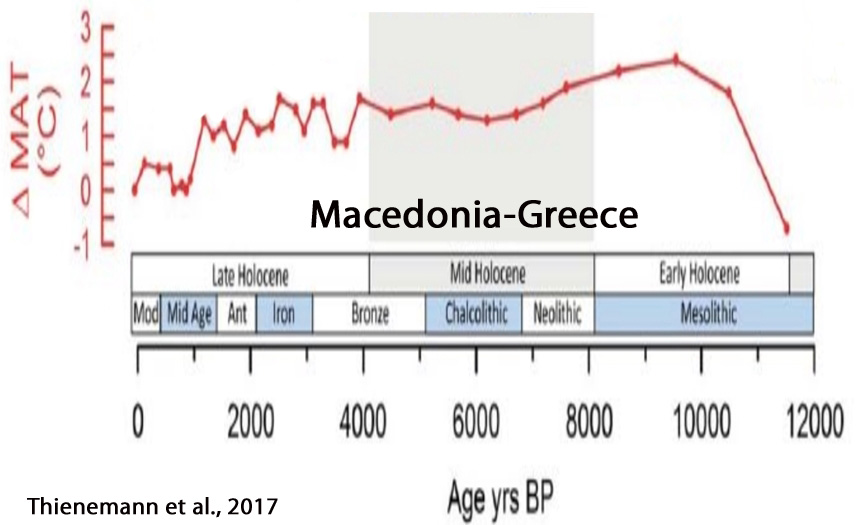
Thienemann et al., 2017
“[P]roxy-inferred annual MATs[annual mean air temperatures] show the lowest value at 11,510 yr BP (7.6°C). Subsequently, temperatures rise to 10.7°C at 9540 yr BP followed by an overall decline of about 2.5°C until present (8.3°C).”
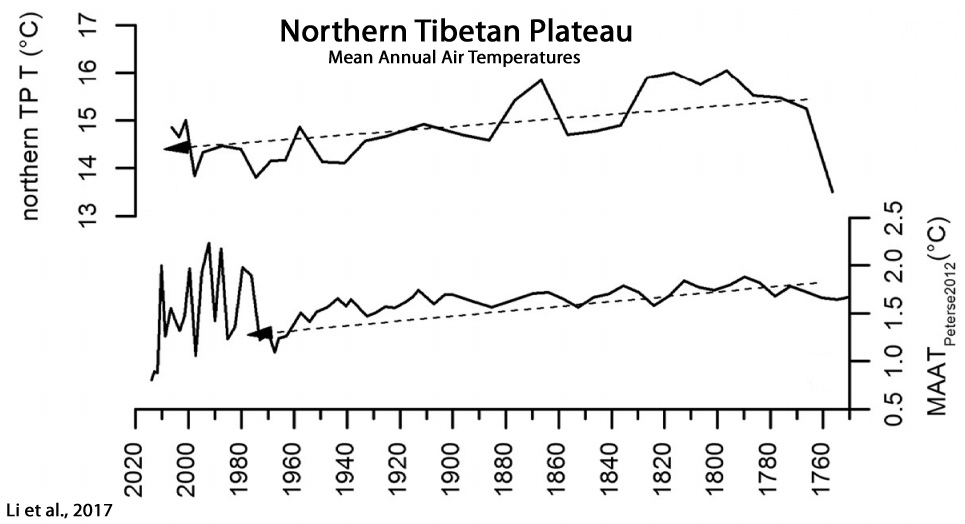
Li et al., 2017
“Contrary to the often-documented warming trend over the past few centuries, but consistent with temperature record from the northern Tibetan Plateau, our data show a gradual decreasing trend of 0.3 °C in mean annual air temperature from 1750 to 1970 CE. This result suggests a gradual cooling trend in some high altitude regions over this interval, which could provide a new explanation for the observed decreasing Asian summer monsoon. In addition, our data indicate an abruptly increased interannual-to decadal-scale temperature variations of 0.8 – 2.2 °C after 1970 CE, in terms of both magnitude and frequency, indicating that the climate system in high altitude regions would become more unstable under current global warming.”
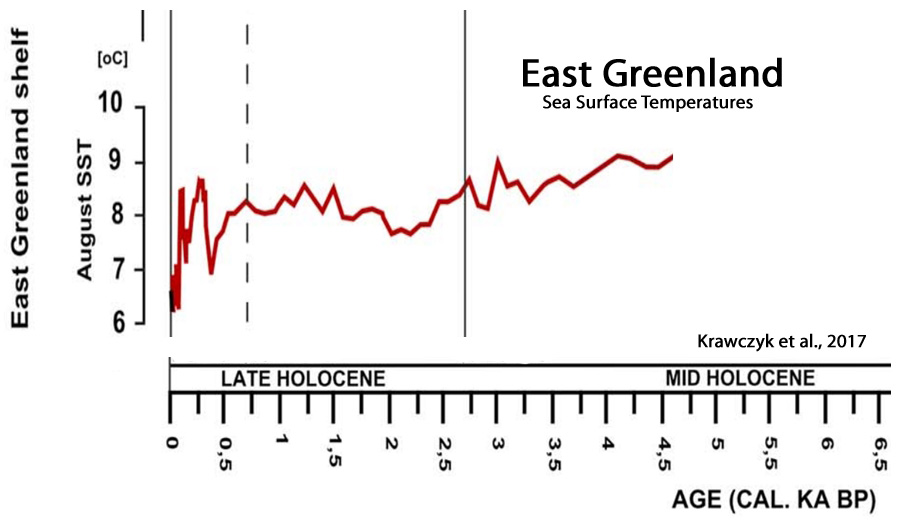
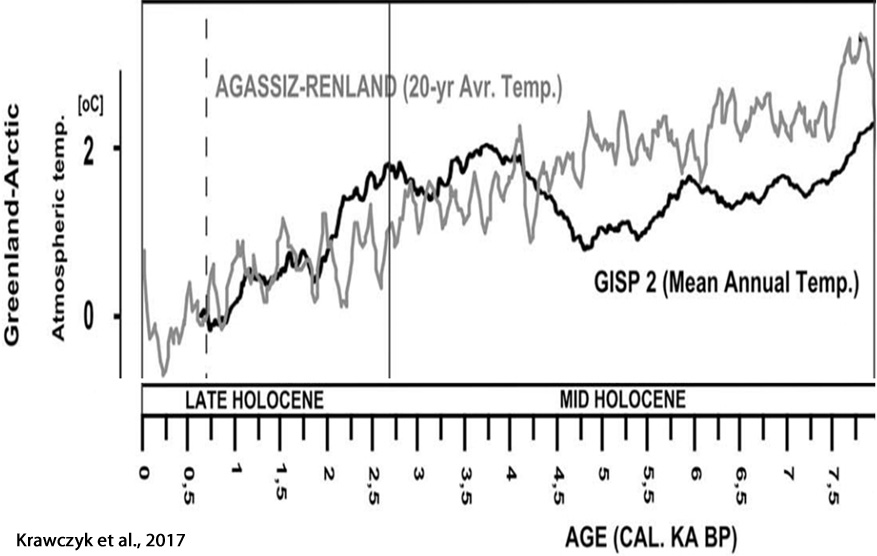
Krawczyk et al., 2017


Thanks, Kenneth. Nice effort!
Why commence picking cherries so far in advance of Washington’s Birthday?
Pas de zeale , M. Gosselin!
Javier:
“The end of the LIA was obviously natural. Solar activity recovered and volcanic activity diminished. This allowed a natural rebound of the climate to warmer conditions.”
https://judithcurry.com/2017/05/28/nature-unbound-iii-holocene-climate-variability-part-b/#comment-850029
And the AGW advocates (aka CO2phobics) looked and ran around shouting —
Not running around … just smiling when someone who doesn’t think that models have any value without actual measurements, relies on them in nearly every post.
Reconstruction are interesting, but do they prove that modern temperature and OHC changes are not man made? Don’t think so.
Regarding the Hockeystick: http://imgur.com/a/dFnxk (combined the “average of 15 reconstructions” above with a woodfortrees graph)
Of course they do no’t prove that we humans are not the cause of changing the temperature of the deep ocean with our CO2 emissions .
But this would imply that that it has already been proved that humans are the cause of temperature changes in the deep ocean, and thus it is now up to contrarians to dis-prove what has already been proved. Please explain where it has been scientifically proved that humans heat up the oceans by burning fossil fuels. I thought at one time you had acknowledged this was just a theory. Are you now saying it is proven fact? If so, let’s see your proof.
For example, provide scientific proof that changes in solar activity since the Little Ice Age’s solar minima periods had no bearing on the warm-up:
–
https://notrickszone.com/wp-content/uploads/2017/04/Modern-Grand-Maximum-Russell-2010.jpg
–
https://notrickszone.com/wp-content/uploads/2017/04/Cooling-Forecast-Solar-Steinhilber-and-Beer-2013.jpg
–
https://notrickszone.com/wp-content/uploads/2017/04/Modern-Grand-Maximum-Usoskin-2014.jpg
–
https://notrickszone.com/wp-content/uploads/2017/04/Modern-Grand-Maximum-To-2100-Herrera-2015.jpg
–
Then provide proof that cloud cover changes since the 1980s had no discernible influence on the Earth’s radiation balance…
https://notrickszone.com/wp-content/uploads/2017/03/Cooling-Warming-Temperature-Cloud-Page-17.jpg
Once you’ve finished proving that the Sun and cloud cover changes have effectively had no bearing on the variations in ocean heat, and only* CO2 variations cause OHC changes, then I have a few other natural factors (oceanic heat redistribution/ENSO/AMOC, volcanic activity) for you to disprove as well.
* SebastianH: “If the ocean heat change is the result of an average forcing of X and we have such a forcing to attribute that to, then 100% of the change is caused by that forcing.”
And once again you assume I said that CO2 concentration is the only way OHC can change.
5 + 5 + 5 = 15What “5” caused the end result to be above “10”? All of them … but the third “5” is my special human made “5”, so I say this “5” caused the “10” to be a “15”, not the other ones. You want to say that another “5” caused it and that’s ok too, but it doesn’t describe the human influence. Got it?Yet another kindy example of seb’s existence in a world of meaningless analogies.
He must have been watching some children doing some adding up and thought it was a great analogy to explain his unsupportable AGW scam.
CO2 has no possible way of changing OHC.
LW radiation does NOT heat water from above, in fact causes a think layer of slightly cooler water as latent heat extracts extra energy from the surface.
MEASURED, OBSERVED.
The only LW radiation at sea level comes overwhelmingly from H2O, CO2 has no part in it what-so-ever, because it does not radiate below 11km.
There is no PLUS anything from CO2.
You have yet to provide one single paper showing that CO2 causes warming over water, or in a convective atmosphere.
Yet you continue to troll mindlessly with baseless child-minded analogies.
Either you have very serious mental/social/life quality issues, or someone is paying you to continue your mindless empty trolling.
This assumes that one of the other 5s that used to be there to cause the 10 to become 15 just…disappeared. Like magic. Otherwise your “special human made 5” could not have been there. So which natural forcing mechanism that “used to” contribute to changes in ocean heat has disappeared?
Really, SebastianH, your analogies are ridiculous. This has nothing to do with CO2 heating the ocean. Again. All you have are irrelevant analogies that have nothing to do with anything other than your hypothetical machinations.
AndyG55:
That is physically not possible. If LW radiation would drive evaporation, then the incoming energy is completely used up in that process and the evaporation could not use up any additional energy from the ocean to cool it. Any additional evaporation that cools the surface would not be caused by incoming LW radiation if the only result of its existence is causing evaporation.
Also we would have around 300 W/m² in evaporation instead of the observable 80 W/m² … doesn’t work out. No balance achieved.
Kenneth,
I tried to explain the concept of attributing effects to causes to you as simple as possible and yet you still manage to missunderstand me. Either you do it on purpose or my ability to write in the English language isn’t good enough.
Why would a “5” need to disappear? A stable OHC is represented by the value of “10”. It became “15” and we can attribute the increase to whatever “5” we want to or we can split it up and say the first “5” caused 40% and the second “5” caused 60%. It doesn’t really matter. But if we know that the third “5” is the human “5” and we want to know the percentage of the human contribution, then we get 100%. If the second “5” is the TSI and we want to know the Sun’s percentage, we get 100%.
Got it? It’s just a question of accounting/attribution. I am not saying and have not said that 100% means that nothing else contributed.
It can’t be too hard to understand that basic concept. You didn’t understand it when we discussed what causes the CO2 concentration increase and you do not understand it now. Where is the problem?
Because, using the scenario you have yourself set up, human CO2 emissions have not always been part of the ocean-heat-causing equation. Pre-industrial CO2 levels necessarily did not contribute a “5” to OHC variation…since you believe those levels were natural (280-290 ppm), and any concentration above that was unnatural, or anthropogenic. So, at some point, the contribution from atmospheric CO2 had to change from a net 0 contributor to OHC variation (since it didn’t change) to a 5. That means that another factor that “used to” be a 5 contributor, causing the 10 to become 15, had to be eliminated, reduced to 0, or overriden. What factor was it?
And what about the conclusion that modern ocean heat content is still not only well within the range of natural variability, it’s still much lower than it has been for most of the last 10,000 years? And yet we have the highest (by far) CO2 levels of the last 10,000 years. Wouldn’t there need to be something unusual about post-1955 OHC to distinguish it from natural variability?
Bova et al. (2016) said they couldn’t even detect enough of a change in modern OHC to verify that there has been one, but yet she and her colleagues could find changes of 2 C in 200 years in the 0-1000 m layer…without CO2 changes. So how is this consistent with the perspective that OHC changes are significantly influenced by CO2 variations anyway?
@SebastianH 29. May 2017
Once again you ascribe a direct link of CO2 levels to changes in atmospheric temperatures. No such link has been proved!
Yes, aspects of CO2 characteristics are studied in academia, however the jury is still out as to how well all these characteristics are transferred and are express in the open atmosphere.
What we do know is that on this windy, water drenched planet CO2’s role in climate can only be of minor importance.
“You didn’t understand it when we discussed what causes the CO2 concentration increase and you do not understand it now.”
I understand your MORONIC attempts at childish and puerile anti-science analogies better than you do, seb.
I understand they are MORONIC, and TOTALLY IRRELEVANT to reality
… you don’t seem to even have the slightest clue about this FACT.
Kenneth, you write it yourself … heat content decreased over the last few thousand years. Now the “5” of human CO2 forcing appears and it doesn’t decrease anymore. Where is the problem?
https://notrickszone.com/wp-content/uploads/2016/11/Holocene-Cooling-Pacific-Heat-Content-Rosenthal13-copy.jpg
It both increased and decreased in the absence of CO2 flux. In fact, OHC increased and decreased at rates that far exceed modern rates…which aren’t even detectable against the background.
So some other mechanism(s) were the causes of those abrupt increases and decreases…not CO2, which didn’t change. So what mechanism(s) disappeared as a cause to allow the human intervention to supersede it…and lead to an undetectable overall change in OHC relative to the past?
Again, you have the problem I have been pointing out again and again, and you keep ignoring: the modern OHC is not unusual, and it is well within the range of natural variability. Something unusual or unnatural would need to occur for there to be need to figure out what may be causing this unusual ocean heat behavior. But it’s, as Bova et al. (2016) indicate, “below detection”.
On the other hand, notice how similar the (A) 0-20 m OHC change looks compared to the (B) solar radiation trend:
(A) https://notrickszone.com/wp-content/uploads/2017/01/Holocene-Cooling-Global-Oceans-0-20-m-Gouretski-12.jpg
–
(B) https://notrickszone.com/wp-content/uploads/2017/05/Total-Solar-Irradiance-1700-2013-Yndestad-and-Solheim-2017.jpg
Of course it did, why wouldn’t it? Obviously the variables that contribute to changes in OHC aren’t stable. Why do you keep thinking that what I am saying means “CO2 is the only thing that can change OHC”?
I strongly suggest you re-read that Rosenthal paper. Your graph is showing the WPWP changes (not the entire pacific OHC) which represents the warmest region. From the paper:
And continues …
The MCA to LIA cooling corresponds to a negative forcing of just 0.2 W/m².
Back to you Kenneth:
Those mechanisms are still there, they just don’t contribute as much to OHC change as you’d like them to. Instead we have CO2 forcing which is also small, but constant and constantly increasing. You can argue against such forcing of course, but we are discussing the method of attributing change to some specific cause, aren’t we? The “5”s …
Again, Rosenthal doesn’t think so, describing the modern rates as the highest. The OHC hasn’t exceeded anything from the reconstructions yet, ok … but it is certainly increasing faster than what the TSI changes in your last links could ever achieve. Let’s be generous and say TSI changes by 3 W/m², that’s a forcing of
3 W/m² / 4 * 0.7 = 0.525 W/m²after 50 years or an average of – if we assume the increase was linear – half that. Not enough to explain the OHC increase.Why would the surface temperature not correspond to TSI/solar changes? As Rosenthal says, the TSI changes are too small to cause those OHC changes alone.
Great. So name all the factors that contributed to the 1900-present change in the 0-20 m ocean heat content. And the percentages for each. Let’s see how much you believe the Sun and cloud cover changes and lack of volcanic activity relative to the Little Ice Age contributed.
So -0.2 W m-2 of forcing caused the 0-700 m layer to cool by -0.9 C? Since CO2 rose by about 20 ppm from the MCA to LIA, what negative forcing factor caused the temperatures to drop?
TSI rose by 4 W m-2 between ~1900 and the early 2000s. To what extent do you believe this was responsible for the change in the 0-20 m layer relative to CO2?
So variations in the Sun and clouds and volcanic aerosols — factors that “used to” strongly contribute to OHC changes…don’t contribute as much to OHC change anymore…even though I want them to. So at what point did they stop contributing as much to OHC changes? When did volcanic forcing and cloud radiative forcing stop contributing so much, SebastianH? What year?
As I have explained to you (and apparently you aren’t understanding the statistical malpractice because you do it yourself routinely), to concoct the “fastest rate evah” claim, Rosenthal compared a 55-year anomaly to an 8,000-year overall trend. It’s like comparing a one-year temperature anomaly (-0.7 C for 2016) to the overall 1979-2017 trend (+0.4 C) and claiming that because the -0.7 C in one year amounts to a change of -7 C per decade, and +0.4 C amounts to +0.12 C per decade, therefore the change in 2016 is unnatural and “the modern rate is the highest”. You’ve had this explained to you 3 times now, and yet you continue to repeat yourself, demonstrating you either don’t understand (likely), or you do but don’t care because you have to “win”.
Again, as the the Rosenthal and Gouretski graphs show, there was nothing unusual about the post-1955 change in OHC that hasn’t happened before within the confines of natural variability.
https://climateaudit.files.wordpress.com/2013/11/rosenthal-2013-figure-2c-annotated.png
I hope my reply gets released from where it went to. I will not rewrite :/
seb,
Again you believe yourself to be a mind reader —
“Not running around … just smiling when someone who doesn’t think that models have any value without actual measurements, relies on them in nearly every post.”
Broadly, I do not think models have no value.
However, I do think assumptions made by CO2-phobic AGW advocates are without value.
That remark was about the author of the post obviously.
No seb it is aimed at YOU!
What? I obviously ment the remark in my reply to the first comment in this thread. How is it possible for you to missunderstand this?
seb,
I think no such thing!
Another tobacco defense.
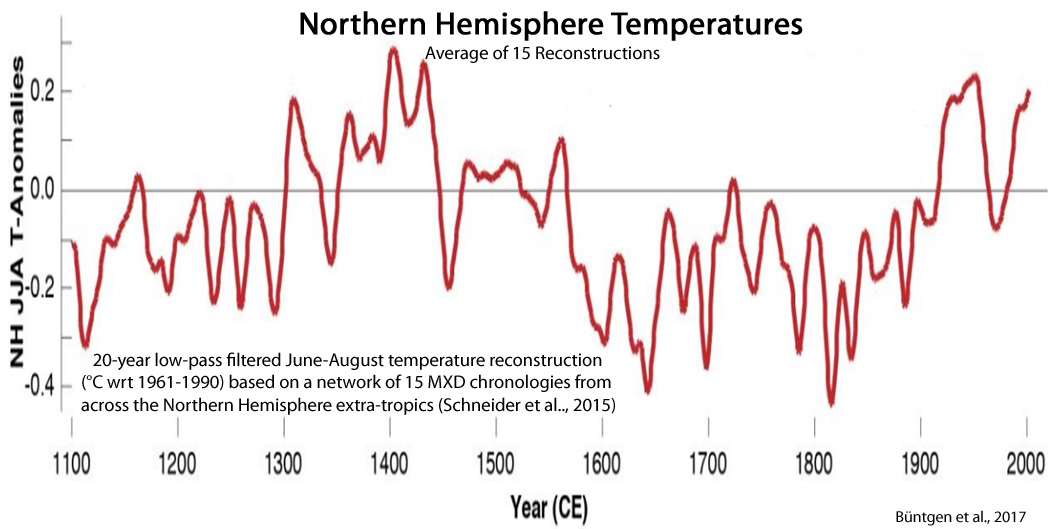
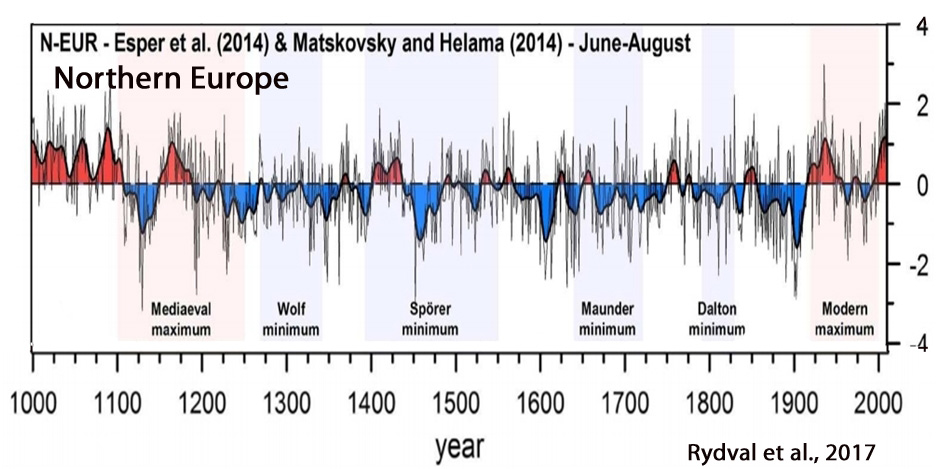
Just take to “northern hemisphere”graphs:
one with a clear peak at 1400:
https://notrickszone.com/wp-content/uploads/2017/04/Holocene-Cooling-Northern-Hemisphere-Temps-B%C3%BCntgen-2017.jpg
The other with no such peak, but one in 1100:
https://notrickszone.com/wp-content/uploads/2017/04/Holocene-Cooling-Northern-Hemisphere-Temps-B%C3%BCntgen-2017.jpg
you combine those graphs, and the peaks VANISH. That is the reason why such “80 graphs” have utterly no meaning. It is just a trick to confuse those who are already confused.
So the 80 graphs have no meaning because some reconstructions of Northern Hemisphere temperature have a warm peak around 1400, and others do not?
Here are 5 reconstructions of NH temperatures. Notice how none of them indicate there has been an unusual or unprecedented warming in recent decades. They look remarkably similar to how the National Academy of Sciences depicted NH temps in 1975…before the data-manipulators decided to change the instrumental record.
–
https://notrickszone.com/wp-content/uploads/2017/04/Holocene-Cooling-Northern-Hemisphere-Schneider-2015.jpg
–
https://notrickszone.com/wp-content/uploads/2017/04/Holocene-Cooling-Northern-Hemisphere-Stoffel-2015.jpg
–
https://notrickszone.com/wp-content/uploads/2017/04/Holocene-Cooling-Northern-Hemisphere-Temps-B%C3%BCntgen-2017.jpg
–
https://notrickszone.com/wp-content/uploads/2017/04/Holocene-Cooling-Northern-Hemisphere-Abrantes-17.jpg
–
https://notrickszone.com/wp-content/uploads/2017/04/Holocene-Cooling-Northern-Hemisphere-14000-Yrs-Otto-and-Roberts-2016.jpg
Kenneth, for a start:
a graph that does not tell you, in which year the data ends, is utterly worthless.
you also need to add the averaging process used to form the graph.
a graph that ends its data in the year 2000 and has a 50 year running average actually might have and end point that is strongly influenced by the 70s.
I fear that this two corrections will already eliminate a lot of your graphs.
Let me repeat the data from Sebastian above:
http://imgur.com/a/dFnxk
seb again showing his abject ignorance of all things to do with maths and sob-sob accepting that ignorance, because he is even more ignorant.
Adding highly corrupted high resolution data onto a 20 year smoothed data.
mathematical ineptitude and ignorance to the max.
Says the one who can’t even get the scale right when combining graphs.
P.S.: I used RSS satellite data …corrupted data? I thought that is the go-to dataset for sceptics these days?
Its the moronic use of detailed data vs 20 year averaged data.
Your mathematical ineptitude writ large.
Your child-minded scaling of two totally different things, was hilarious to observe.
The really funny thing was that you obviously had ZERO clue that you were graphing two totally different things.
Just like you have basically zero clue about anything to do with climate or basic physics.
You live in a sort of anti-knowledge, hallucinogenic daze.
Here you go … averaged (moving and normal) the woodfortrees graphs for you … same result *facepalm*
http://imgur.com/a/nb3IP
Isn’t it interesting that the shape of that graph for modern times looks remarkably similar to patterns of solar activity?
https://notrickszone.com/wp-content/uploads/2017/04/Soon-Connolly-2015-NH-Temps-TSI.jpg
https://notrickszone.com/wp-content/uploads/2017/05/Holocene-Cooling-Northern-Hemisphere-TSI.jpg
And sea level rise rates?
https://notrickszone.com/wp-content/uploads/2017/05/Sea-Level-Rise-Rates-TSI-Correlation1700-2013.jpg
Yes, that’s interesting. Do the two graphs in this link also look similar to you?
http://imgur.com/a/eJFf9
Hint: they are not.
https://notrickszone.com/wp-content/uploads/2017/05/Total-Solar-Irradiance-1700-2013-Yndestad-and-Solheim-2017.jpg
Yndestad and Solheim, 2017
“Deterministic models based on the stationary periods confirm the results through a close relation to known long solar minima since 1000 A.D. and suggest a modern maximum period from 1940 to 2015. The model computes a new Dalton-type sunspot minimum from approximately 2025 to 2050 and a new Dalton-type period TSI minimum from approximately 2040 to 2065. … Periods with few sunspots are associated with low solar activity and cold climate periods. Periods with many sunspots are associated with high solar activity and warm climate periods.”
Your graphs look nothing like these graphs:
https://notrickszone.com/wp-content/uploads/2017/04/Cooling-Forecast-Solar-Steinhilber-and-Beer-2013.jpg
https://notrickszone.com/wp-content/uploads/2017/04/Modern-Grand-Maximum-To-2100-Herrera-2015.jpg
https://notrickszone.com/wp-content/uploads/2017/04/Modern-Grand-Maximum-Chen-2015.jpg
https://notrickszone.com/wp-content/uploads/2017/04/Modern-Grand-Maximum-UVR-Chen-2015.jpg
https://notrickszone.com/wp-content/uploads/2017/04/Modern-Grand-Maximum-Usoskin-2014.jpg
https://notrickszone.com/wp-content/uploads/2017/04/Modern-Grand-Maximum-Russell-2010.jpg
“*facepalm*”
As you should.
Now shift the RSS curve down where it should be and stop with your fabricated nonsense.
Oh and thanks for showing just how polluted the GISS curve is with its removal of the 1940 peak and subsequent dip to 1970’s
You have yet again , put your foot in your gob, without even realising it.
Seems to be permanent pose for you !!
“*facepalm*”
Don’t slap yourself too hard.
Love the way you have intentionally offset the two zero axes.
Pure mathematical malfeaces.
We know GISS pushed everything before 1970 down and everything after 1970 up, so you should be dropping you graphs down about 0.2C and then ignoring the fabricated GISS and HAD.
That wasn’t the point and I guess you know that.
My graphs are just multiple sine waves mixed together (as the accompanying text says) with a subtile difference between pattern test 1 and 2. Surely you’d say they look just the same, but they are not. And that’s the point …
“Do the two graphs in this link also look similar to you?”
ROFLMAO.
Another abortive attempt at a seb analogy mixed with child-level mathematics.
so funny
Please keep up the clown act, seb.
Its all you have. 🙂
Did of a worry, isn’t it Kenneth.
The solar activity climbed up higher than during the LIA, yet the global temperatures fell short of the MWP.
Perhaps all this lovely extra plant-life CO2 is having a cooling effect by transmitting radiant energy quicker to the upper atmosphere. 😉
WHOOPS…. for LIA put MWP…
The solar activity climbed up higher than during the MWP, yet the global temperatures fell short of the MWP.
“to” should be “two”. sorry for the stupid typo.
Why can i always guess the source of a graph by just reading the headline of a paper?
http://journals.sagepub.com/doi/abs/10.1177/0958305X16686447?journalCode=eaea
This is total garbage!
sod,
You say “This is total garbage!” A hash judgement indeed.
Would your judgement be based on —
a) Climate is a mostly linear system with future events more nearly determined by the past and present events?
or
b) Climate is a stochastic, or mostly semi-stochastic system, therefore future events are never completely determined by the past and present events as the climate system contains additional, unknown, random and non-random components and couplings?
Your ‘specialist’ knowledge on these matters is eagerly awaited.
you are making the same error that the paper does.
climate is obviously influenced by random events. Volcanoes are the most obvious example.
But what this paper does (linear trend over 144 years) is plain out garbage.
The result says nothing, as does your attempt of a “choice” where there is none.
Error?
What error?
He thinks there’s an error in this graph of the Swiss Alps….
https://notrickszone.com/wp-content/uploads/2017/05/Holocene-Cooling-Swiss-Alps-Heiri-and-Lotter-2005.jpg
…because the authors of this paper claimed that there looked to be too much cooling using these proxies…and because of human activity.
But Craig himself linked to another graph of European Alps temperatures that showed chironomid-derived temperatures as recently as 4,500 years ago were still several degrees warmer than now…
https://notrickszone.com/wp-content/uploads/2017/05/Holocene-Cooling-European-Alps-Ilyashuk-2011.jpg
And Rydval et al., 2017 provided a graph that showed the European Alps were similarly warm during Medieval times, and that temperature trends follow variations in solar activity…
https://notrickszone.com/wp-content/uploads/2017/01/Holocene-Cooling-European-Alps-Rydval-17.jpg
…even for the period in which humans were supposed to be dominating climate…
https://notrickszone.com/wp-content/uploads/2017/02/Holocene-Cooling-European-Alps-TSI-Rydval-17.jpg
sod,
You say “This is total garbage!” A hash judgement indeed.
Would your judgement be based on —
a) Climate is a mostly linear system with future events more nearly determined by the past and present events?
or
b) Climate is a stochastic, or mostly semi-stochastic system, therefore future events are never completely determined by the past and present events as the climate system contains additional, unknown, random and non-random components and couplings?
Your ‘specialist’ knowledge on these matters is eagerly awaited.
“A hash judgement ”
Most of what sob-sob says seems to be based on a generous supply of hash. !!
sob-sob thinks its garbage.
So what !!
That is classed as being ‘totally irrelevant’ to any sort of rational or scientific discussion.
A baseless, worthless opinion from a low-level, nil-educated, AGW troll.
An opinion that is known to be pretty much always diametrically opposite to any actual form of REALITY.
sod,
I have replied twice now but as usual nothing shows.
Oh hum, no doubt this will show ….
Awaiting moderation….
I’ll be back in a couple of days then?
“This is total garbage!”
Yep, your posts always are, sob-sob.
Absolutely ZERO counter to the article.
Your post certainly is total garbage.
Yes indeed Andy,
Hoever as I have tried too many times to reply to sod, so I’ll try here —
sod,
What upsets you? The conclusion?
“Why can i always guess the source of a graph by just reading the headline of a paper?”
There’s no graph provided for that paper. What are you even talking about?
All comments awaiting moderation?
Buried with the heart of the climate change idea is that ‘climate’ per se is a deterministic system that has large measures of predictability.
That is to say by analyzing the climate and its many factors and parameters, and reducing its many parts to scientifically describable sub units a mathematical models can be made that mirrors the real climate system and can accurately predict the future climate.
This, most assuredly, is not the case as this natural system is a host if many and varying parameters, of feedbacks, and of loosely coupled elements, mixed with random events (solar, volcanic, and many unknowns). Thus outcomes of changes within this evolving chaotic matrix of effects is unpredictable for the macro (hence all this variable weather), and only marginally better when forecasting the long term (yes there will be another ice-age probably within 300 years from now).
Ascribing the microscopic change of one very small element (CO2) as being a major motivator of climate change on this water soaked planet is beyond foolish it is just crass stupidity.
Also of interest with all the climate models is the lack of assessment of surface winds. Everything from a little breezes to raging storms horizontal winds are ignored. Yes, they are a effect caused by the convective nature of our atmosphere but they are horizontal in nature.
Would a general (average?) increase or decrease in overall global advection over the years of a few percent (or even 1/10th of a percent) not cause surface temperatures to vary? Would not the oceans warm or cool more (with variations in evaporation) if the wind blowing across them varies.
So why do the modelers hide themselves from its effects? Maybe it is because science does not understand how it works!
A very basic characteristic of our weather and climate system is still a mystery and joins the long list of other known effects like clouds, precipitation, solar effects, variations in climate cells, etc…
In moderation again.
Guillet et al., 2017
nice ! … “les vendanges” as a proxy to temperature ? … well, why not ? …
but the link goes to a 404 error … I looked in google scholar for a copy of the paper, but to no avail … does anybody have a copy or a link ?
Thank you for pointing out that the pdf link has now been broken. Here’s the paper abstract (now corrected in the article too)…
Guillet et al., 2017
http://www.nature.com/ngeo/journal/v10/n2/abs/ngeo2875.html
And for a full article on grape harvest dates as a proxy for temperature, see here:
https://notrickszone.com/2017/03/06/historical-grape-harvest-dates-show-modern-temperatures-no-warmer-now-than-most-of-the-last-1000-years/
Historical Grape Harvest Dates Show Modern Temperatures No Warmer Now Than Most Of The Last 1,000 Years
[…] Kenneth Richard, May 29, […]
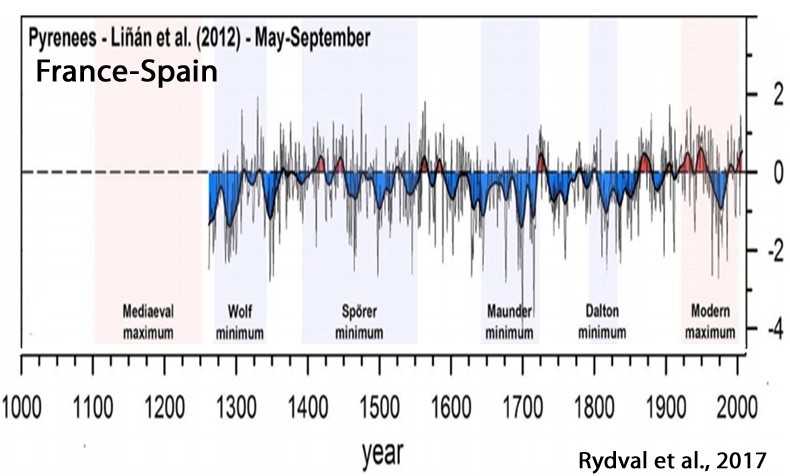
There are many places that don’t show hockey sticks in their temperature proxy. For example your first graph from Büntgen et al., 2017 of the summer temperature reconstruction of the Pyrenees shows 2000 no higher than 1950. This has been seen before, but the 2012 paper by Büntgen also shows summer temperatures for the Alpine Arc, the Tatra mountains and northern Scandinavia. All of which have hockey stick endings.
http://imgbox.com/iQAoeDKs
There is lots of variation from place to place but the topic is global warming. When the reconstructions are averaged together to create a thousand year temperature record for the northern hemisphere the result is a strong hockey stick. (The graph shown includes no instrumental data)
http://imgbox.com/upR7KnCe
And if many regions of the globe aren’t warming, including most of the Southern Hemisphere, how is it that it’s called “global” warming? The globe is not warming. Just some regions are. And some are cooling.
If the Arctic is warming by +0.3 C per decade, and the Antarctic is cooling by -0.2 C per decade, is it proper to say that the “polar regions” are warming at a rate of +0.1 C per decade…if only one of the two polar regions are warming, and we only get warming if we average the two together to get a net difference? Because that’s what we have here. That may seem “accurate” to you, but that’s because you have obviously bought into the paradigm without skepticism or critical thinking.
The Arctic has been warming since the 1990s. For 40-50 years prior to the 1990s, the Arctic was cooling. How is this oscillation consistent with anthropogenic forcing?
Northern Hemisphere temperatures have warmed by about 0.4 or 0.5 C since the late 1970s: https://notrickszone.com/wp-content/uploads/2017/01/Northern-Hemisphere-RSS-1979-2017.jpg
Prior to that, the Northern Hemisphere warmed by nearly 1.0 C from the 1880s to the 1940s, cooled by at least -0.5 C between the 1940s and 1970s: https://notrickszone.com/wp-content/uploads/2017/02/Northern-Hemisphere-1880-1975-Agee-80_edited-1.jpg
This same oscillation (abrupt warming from the 1880s to 1940s, cooling through the 1970s, and warming that only matches 1930s/1940s warmth since the 1980s) can be seen in reconstruction after reconstruction. For example, none of the below NH reconstructions show anything unusual about the post-1950 period. In fact, most of the modern-era warming in the NH occurred prior to 1950. Obviously, this isn’t compatible with CO2 emissions trends, which only began rising after 1950. So why are you a believer that CO2 emissions are the primary cause of ocean temperature variations, Craig? Why do you cling to Mannian hide-the-decline hockey sticks and beliefs about CO2-heating-water that have never been scientifically validated? Why aren’t you the least bit skeptical?
–
https://notrickszone.com/wp-content/uploads/2017/04/Holocene-Cooling-Northern-Hemisphere-Schneider-2015.jpg
–
https://notrickszone.com/wp-content/uploads/2017/04/Holocene-Cooling-Northern-Hemisphere-Abrantes-17.jpg
–
https://notrickszone.com/wp-content/uploads/2017/04/Holocene-Cooling-Northern-Hemisphere-Stoffel-2015.jpg
–
https://notrickszone.com/wp-content/uploads/2017/01/Holocene-Cooling-Bahamas-Saenger-09.jpg
–
https://notrickszone.com/wp-content/uploads/2017/04/Soon-Connolly-2015-NH-Temps.jpg
–
https://notrickszone.com/wp-content/uploads/2016/10/Holocene-Cooling-Global-Temps-1940-1970-2000-Gerhard-04-copy.jpg
–
https://notrickszone.com/wp-content/uploads/2017/01/Holocene-Cooling-Global-Oceans-0-20-m-Gouretski-12.jpg
–
The ONLY places in the world with any warming , are those affected by ocean currents or El Nino effects.
1. No warming in the UAH satellite record from 1980 to 1998 El Nino
2. No warming between the end of that El Nino in 2001 and the start of the current El Nino at the beginning of 2015.
3. No warming in the southern polar region for the whole 39 years of the satellite record.
4. No warming in the southern ex-tropicals for 20 years.
5. No warming in Australia for 20 years, cooling since 2002
6. No warming in Japan surface data for the last 20 years, No warming from 1950-1990.. ie, a zero trend for 40 years through their biggest industrial expansion
7. No warming in the USA since 2005 when a non-corrupted system was installed, until the beginning of the current El Nino.
8. UAH Global Land shows no warming from 1979-1997, then no warming from 2001 – 2015
9. Iceland essentially the same temperature as in the late 1930s as now, maybe slightly lower
10. British Columbia (Canada) temperatures have been stable, with no warming trend, throughout 1900-2010
11. Chile has been cooling since the 1940s.
12. Southern Sea temperatures not warming from 1982-2005, then cooling
13. Even UAH NoPol shows no warming this century until the large spike in January 2016.
That is DESPITE a large climb in CO2 levels over those regions and time periods.
There IS NO CO2 WARMING effect.
PERIOD !!!
@AndyG55. Excellent observations, Andy. May I borrow and reprint your list?
“The Arctic has been warming since the 1990s”
Not true at all Kenneth.
UAH NoPol shows essentially NO WARMING this century before the effect of the recent El Nino.
https://s19.postimg.org/jrz6i34oj/UAH_NoPol_2000-2016.png
In fact, if you look at the graph you can see unticks in 2005 and 2010, with COOLING between and after 2010.
Timewise, the Arctic is dominated by cooling periods this century.
The Arctic warmed from about 1993 to about 2005/6. Since then, warming has plateaued.
Data says plateau all this century.
UAH NoPol also says cooling from 1980-1995
https://s19.postimg.org/t5vk23e5v/UAH_nopol_1980-1995.png
Certainly absolutely ZERO sign of any CO2 effect.
The whole “Mannian hide-the-decline hockey sticks” issue was the merging of proxy data with instrumental measurements. I ignored all the graphs that included anything other than proxies. Even with 50 year smoothing rolling trendlines back 25 years before the date of the youngest sample the increase in the rate of warming is visible in many locations and in the average of the northern and southern hemispheres.
What I’m skeptical of is the claim that longwave radiation doesn’t warm anything when it strikes water. Energy isn’t destroyed it just changes form.
I agree there has been a visible warming in many places. There are also many places where there has been no visible warming…as the 150 graphs from 120 peer-reviewed papers published since 2016 attest. (And another 150 graphs from the few years before that). And most of the Holocene has been much warmer than now, including in the oceans. In sum, there has been warming and cooling, and this warming and cooling isn’t unusual. And any warming that has occurred can be easily attributed to natural variability.
Change the strawman “doesn’t warm anything” into “doesn’t contribute to the warming of the ocean (20-30 m) to anywhere near the magnitude as the direct, shortwave forcing does”.
Do you agree that shortwave forcing/heating — which can penetrate into the ocean waters by 10s of meters — is MORE influential in determining the heat content of the ocean than IR, as the latter cannot penetrate past the ocean’s hair-thin “skin” layer?
We’re talking magnitudes here, Craig. The magnitude of forcing from variations in direct shortwave (via, for example, decadal-scale variations in cloud cover/volcanic aerosols/albedo) far outweigh the forcing from variations in indirect heat “trapping” variables, especially when we’re talking about volumes of parts per million (0.000001). Or do you really think CO2 forcing is capable of competing with direct SW?
God bless Roy Spencer!
I was trying to think of the best way to explain how longwave radiation helps keep the ocean warm. While looking for a good explanation of the greenhouse effect I wound up on Roy’s site.
“we should not confuse a reduced rate of cooling with heating. Imagine you have a jar of boiling hot water right next to a jar of warm water sitting on the counter. The boiling hot jar will cool rapidly, while the warm jar will cool more slowly. Eventually, both jars will achieve the same temperature, just as the 2nd Law predicts.”
“But what if the boiling hot jar was by all by itself? Then, it would have cooled even faster. Does that mean that the presence of the warm jar was sending energy into the hot jar? No, it was just reducing the rate of cooling of the hot jar.”
Longwave radiation doesn’t heat the sea but it does slow the cooling. Most of the time the sea is warmer than the air above it. Longwave radiation causes evaporation, cooling the surface skin of the water and warming the air above with the latent heat stored in the water vapor. This reduces the temperature difference between the surface and the air, slowing the conductive transfer of heat from the sea to the air.
Shortwave radiation does heat the sea. The direct heating from SW penetrates 30 meters into the ocean and is capable of heating the first two meters of the ocean by 2 K in a single day.
Variations in the amount of direct SW heat entering the ocean directly — as modified by changes in solar activity, volcanic aerosols, or cloud cover — are magnitudes more influential in determining the temperature of the ocean than variations in the factors associated with LW forcing (as mentioned by scientists): clouds, aerosols, water vapor. CO2 is generally not even mentioned as a factor — let alone a dominant one — when scientists discuss the factors associated with LW forcing of ocean temperatures.
By the way, do you also agree with Roy Spencer that the Earth’s equilibrium climate sensitivity to doubled CO2 (560 ppm) is only 0.7 C? Or do you believe he’s wrong about that, and that it’s much higher? Because if you agree with him on that, you’ll be categorized as a “climate denier”. If you think it’s higher than that, what do you believe it is? Or do you not know? If you say you don’t know, you’ll also be categorized as a denier. Because the science is settled, of course.
Also, do you agree with Roy Spencer that variations in cloud cover are far more influential in determining warming or cooling than CO2? For example:
Roy Spencer:
“The most obvious way for warming to be caused naturally is for small, natural fluctuations in the circulation patterns of the atmosphere and ocean to result in a 1% or 2% decrease in global cloud cover. Clouds are the Earth’s sunshade, and if cloud cover changes for any reason, you have global warming — or global cooling.”
So 0.000001 changes in atmospheric CO2 fits in where in there?
It DOES NOT slow the cooling.
The cooling gradient of the atmosphere is ONLY affected by H2O, but that means that the energy gradient is unaltered.
LW radiation, almost all from H2O which is in the atmosphere because of evaporation, DOES NOT slow cooling.
Kenneth, I don’t agree with Spencer on either of those points but I do respect his argument. the Earth’s equilibrium climate sensitivity and cooling feedback caused by increasing cloud cover are valid scientific arguments and are still debated by the scientists.
So how much warming do you believe we’ll get at 560 ppm? Remember, it is considered gospel by your side that the direct (no feedbacks) temperature result of doubling CO2 is just 1.2 C.
Since you believe Spencer and Lindzen’s 0.7 C (derived largely from subtracting negative cloud feedback) is too low, is 1.2 C too low too? How hot is it going to get, Craig? What do you believe?
“What I’m skeptical of is the claim that longwave radiation doesn’t warm anything when it strikes water.”
Be as skeptical as you like, It doesn’t change the fact that LW radiation, almost all from H2O, helps with evaporation from the top tiny part of the surface, and evaporations draws latent heat from the top 1mm or so, cooling it.
Measured.. Observed.
[…] the No Tricks Zone come 80 charts, with lots of commentary, that refute the liberals’ politically-motivated, […]
A monumental effort! Thank you.
[…] Source: 80 Graphs From 58 New (2017) Papers Invalidate Claims Of Unprecedented Global-Scale Modern Warming […]
Kenneth Richards. You need to write down the surface energy balance for the ocean and evaluate the magnitudes of the various terms.On an average basis ,the absorbed SW flux is about 160 W/m^2, whereas the absorbed LW flux is about 330 W/m^2.Of course, there is an emitted LW flux of about 390 W/m^2.The evaporation flux is about 80 W/m^2, and sensible heat flux is about 15 W/m^2.Clearly,most of the absorbed LW goes to balance the LW emission, thereby reducing the heat loss from the bulk ocean.(The SW absorbed energy is convected from the bulk ocean to the surface.) You cannot partition energy in the way you describe.The laws of heat transfer must be followed.
ftp://ftp1.esrl.noaa.gov/users/cfairall/wcrp_wgsf/computer_programs/cor3_0/95JC03190.pdf
“On a clear day the Sun deposits an average of about 500 W/m-2 of heat into the ocean over the 12 daylight hours. Roughly half of this heat is absorbed in the upper 2 m. In the absence of mixing this is sufficient heat input to warm this 2-m-deep layer uniformly by 2.0 K. … Measurable warming occurs as deep as 20 m and may persist well past sundown.
http://onlinelibrary.wiley.com/doi/10.1111/j.2153-3490.1963.tb01399.x/pdf
“While short-wave radiation will warm both surface and subsurface layers, long-wave radiation will cause a cooling of the surface depending on the temperature and humidity of the air.”
—
https://www.arm.gov/publications/proceedings/conf07/extended_abs/minnett_pj.pdf
“Located at the upper limit of the molecular boundary layer, the skin temperature is generally a few tenths of a degree cooler than the temperature a few millimeters below it because of heat loss by sensible and latent heat fluxes as well as outgoing longwave radiative fluxes”
—
fvcom.smast.umassd.edu/Courses/MAR555/Suppl_Reading/Fairall_etal_1006.pdf
Conclusion: “The cool skin represents a few tenths of a kelvin cooling by radiative and turbulent fluxes in the upper millimeter of the ocean; the warm layer [beneath] may be several kelvin of solar-induced warming in the upper meter.”
Alexandri et al., 2017
http://www.sciencedirect.com/science/article/pii/S0169809516303398
“Using a radiative transfer model and a set of ancillary data, these biases are attributed to the atmospheric parameters that drive the transmission of solar radiation in the atmosphere, namely, clouds, aerosols and water vapor.” [CO2 not mentioned as a atmospheric parameter affecting the transmission of solar radiation.]
—
http://journals.ametsoc.org/doi/pdf/10.1175/1520-0477(1996)077<0041:OOTIRP>2.0.CO;2
Observations of the Infrared Radiative Properties of the Ocean
“[I]t is necessary to understand the physical variables contributing to sea surface emitted and reflected radiation to space.The emissivity of the ocean surface varies with view angle and sea state, the reflection of sky radiation also depends on view angle and sea state, and the absorption of atmospheric constituents such as water vapor, aerosols, and subdivisible clouds affect transmittance.” [CO2 not mentioned as a factor affecting transmittance, or anywhere in the paper.]
—–
http://onlinelibrary.wiley.com/doi/10.1029/JC091iC09p10585/abstract
The heat balance of the global ocean surface layer is calculated using bulk flux formulations. Maps of the long-term monthly and annual means of the net surface energy flux together with the four components of the total flux (latent heat flux, sensible heat flux, incoming radiation, and outgoing radiation) for the global oceans are presented. Incoming solar radiation and latent heat flux are the two dominant components that control net surface energy fluxes. Wind speed, cloud cover, and the gradient of specific humidity are the three most important meteorological parameters in determining surface flux. [CO2 not mentioned as a parameter in determining surface flux, or anywhere in the paper.]
[…] Fonte: notrickszone […]
Global warming/climate change is a CULT, a religion or belief, nothing else!
Anybody with just a little brain activity and common sense can clearly see that there have always been changes in the climate and that there is no evidence whatsoever that changes are the result of human CO2 releases.
Just hilarious that it takes so much effort to silence the orthodoxy with all their selfserving and poorly hidden agendas. -sad, too!-
The careful and respected folks at Powerline have taken notice.
http://www.powerlineblog.com/archives/2017/06/80-charts-that-show-global-warming-hysteria-is-a-fraud.php
That should help get the word out, to Conservatives at least.
Kenneth Richard.Re your rebuttal of my comment:
1. I stated that my fluxes were on an average basis–in line with the widely used values of Trenberth et al. i.e. global annual averages. Please do not compare apples and oranges.
2.The net long wave length radiation (emission minus absorption) does cool the ocean–(390-330=60)W/m^2.But the subject was the effect of the absorbed
‘back’ LW radiation.
3.With an absorption of 330 W/m^2 and an evaporative heat loss of 80 W/m^2,it is clear that to assert that the back radiation only goes to cause evaporation is erroneous.
4.The two radiation fluxes are independent of the surface temperature whereas
the three convective fluxes are controlled by the surface temperature and the pertinent physical laws.These balance to control the surface temperature.
5.Your quote “the skin temperature—-“is correct.
6.The next quote “The cool skin–” is meaningless.
7. Your remaining references are of doubtful relevance.
Thanks for your reply.
Do you think there is a possibility that the quoted 330 W m-2 forcing value is erroneous, especially since it is not calculated using deep ocean heat content (where 93% of heat changes in the Earth system occur) as the variable being changed by the LW forcing? At what point does one cease questioning the accuracy of models vs. just accepting that what is “widely” assumed to be true is actually true?
[…] warming” is a myth — so say 80 graphs from 58 peer-reviewed scientific papers published in […]
[…] as collated by Kenneth Richard at No Tricks Zone, are just some of the charts to prove […]
[…] as collated by Kenneth Richard at No Tricks Zone, are just some of the charts to prove […]
[…] as collated by Kenneth Richard at No Tricks Zone, are just some of the charts to prove […]
[…] as collated by Kenneth Richard at No Tricks Zone, are just some of the charts to prove […]
Thanks James, for spreading the FACTS.
That is the only way to ring this political AGW farce to its knees, then driving a stake through its zombie like lack of heart.
[…] as collated by Kenneth Richard at No Tricks Zone, are just some of the charts to prove […]
[…] as collated by Kenneth Richard at No Tricks Zone, are just some of the charts to prove […]
Only a true zealot would commence picking cherries so far in advance of Washington’s Birthday.
[…] warming” is a myth — so say 80 graphs from 58 peer-reviewed scientific papers published in […]
[…] warming” is a myth — so say 80 graphs from 58 peer-reviewed scientific papers published in […]
[…] warming” is a myth — so say 80 graphs from 58 peer-reviewed scientific papers published in […]
[…] warming” is a myth — so say 80 graphs from 58 peer-reviewed scientific papers published in […]
Taking my life into my own hands, I head into the lion’s den. I have a few layman’s questions that if anyone could help me with, I’d appreciate it.
1) Are the 58 papers listed?
2) Do any of the 58 papers discuss “global variations” or are they all (mostly) discussing a specific region?
3) Further in regards to question 2, whatever percentage of the 58 papers discuss global variations, how does that compare to the total number of papers that found global temperatures increasing beyond historical precedents?
Thanks
It is essential that we clear the globe of forests and jungles, because that is where the VAST majority of the CO2 comes from. We can start by mowing down the Amazon.
[…] warming” is a myth — so say 80 graphs from 58 peer-reviewed scientific papers published in […]
[…] warming” is a myth — so say 80 graphs from 58 peer-reviewed scientific papers published in […]
Que as pessoas que têm diversos seguidores fazem para conseguir sustentar esse
número de seguidores incessantemente alto. http://cidvietnamstd.vn/UserProfile/tabid/134/userId/34321/Default.aspx
Kenneth Richard. The “deep ocean heat content” has nothing to do with the LW absorption.The LW radiation incident on the ocean surface is known accurately enough, and its absorptance is about 0.9. Engineers use such data to successfully design equipment such as solar ponds,collectors and HVAC systems for buildings.Please read the literature on ‘sky’ or ‘back’ radiation.
You’ve acknowledged that downwelling LW does not heat the ocean. And yet 93% of the net heat change in the Earth system is found in the ocean (IPCC). Therefore, you have just acknowledged that LW radiation has little to no impact (“nothing to do with”) the warming of the Earth system.
https://notrickszone.com/2017/06/01/3-chemists-conclude-co2-greenhouse-effect-is-unreal-violates-laws-of-physics-thermodynamics/
3 Chemists Conclude CO2 Greenhouse Effect Is ‘Unreal’, Violates Laws Of Physics, Thermodynamics
—
Nikolov and Zeller, 2017
https://www.omicsonline.org/open-access/new-insights-on-the-physical-nature-of-the-atmospheric-greenhouse-effect-deduced-from-an-empirical-planetary-temperature-model.pdf
Our analysis revealed that GMATs [global mean annual temperatures] of rocky planets with tangible atmospheres and a negligible geothermal surface heating can accurately be predicted over a broad range of conditions using only two forcing variables: top-of-the-atmosphere solar irradiance and total surface atmospheric pressure. The hereto discovered interplanetary pressure-temperature relationship is shown to be statistically robust while describing a smooth physical continuum without climatic tipping points. This continuum fully explains the recently discovered 90 K thermal effect of Earth’s atmosphere. The new model displays characteristics of an emergent macro-level thermodynamic relationship heretofore unbeknown to science that has important theoretical implications. A key entailment from the model is that the atmospheric ‘greenhouse effect’ currently viewed as a radiative phenomenon is in fact an adiabatic (pressure-induced) thermal enhancement analogous to compression heating and independent of atmospheric composition. Consequently, the global down-welling long-wave flux presently assumed to drive Earth’s surface warming appears to be a product of the air temperature set by solar heating and atmospheric pressure. In other words, the so-called ‘greenhouse back radiation’ is globally a result of the atmospheric thermal effect rather than a cause for it. … The down-welling LW radiation is not a global driver of surface warming as hypothesized for over 100 years but a product of the near-surface air temperature controlled by solar heating and atmospheric pressure … The hypothesis that a freely convective atmosphere could retain (trap) radiant heat due its opacity has remained undisputed since its introduction in the early 1800s even though it was based on a theoretical conjecture that has never been proven experimentally.
[…] warming” is a myth — so say 80 graphs from 58 peer-reviewed scientific papers published in […]
Did Richard even read some of these papers? For I do not believe that, as a whole, they represent the assumptions/assertions he has made. Purely at random, I clicked on three and found the following:
“…[T]he last half of the 20th century exhibits climatic conditions not
evident in the period prior to an anthropogenic influence” (http://onlinelibrary.wiley.com.sci-hub.cc/doi/10.1002/2017GL073138/full)
“[T]he coastal areas are also the places where… strong climatic differences can occur over relatively short distances, where there is some evidence for non-significant but emerging development of warming trends, where even small amounts of warming can rapidly move the local climate beyond the threshold and where surface melting of snow occurs potentially leading to widespread impacts of any future Antarctic warming.” (http://www.clim-past-discuss.net/cp-2017-40/cp-2017-40.pdf)
“The limitation with these analog examples… likely underestimate what will be the real climate responses [to… anthropogenic forcing], but they do provide plausible analogs for near-term future climate changes.” (http://www.sciencedirect.com/science/article/pii/S0277379116305479)
Should I read the rest? Do *any* of them support the silly “climate change is a myth” nonsense?
This article did not say that “climate change is a myth”. It certainly is not a myth that the climate changes.
Why did you insert “to..anthropogenic forcing” to a quote from a paper that did not use that terminology?
If you were to read the introductory commentary, this article acknowledges that:
Mayewski et al. (2017) write: “T2 [surface temps 2 meters above the surface] increases over the western Antarctic Peninsula and West Antarctic ice shelves and SST decreases across the Southern Ocean.”
Stenni et al., (2017) write: “Within this long-term cooling trend from 0-1900 CE we find that the warmest period occurs between 300 and 1000 CE, and the coldest interval from 1200 to 1900 CE. … Only for the Antarctic Peninsula is this most recent century-scale trend unusual in the context of natural variability over the last 2000-years. … A recent effort to characterize Antarctic and sub-Antarctic climate variability during the last 200 years also concluded that most of the trends observed since satellite climate monitoring began in 1979 CE cannot yet be distinguished from natural (unforced) climate variability (Jones et al., 2016), and are of the opposite sign [cooling] to those produced by most forced climate model simulations over the same post-1979 CE interval. … [N]o continent-scale warming of Antarctic temperature is evident in the last century.”
Finally, in the Williams et al. paper that does acknowledge an anthropogenic influence also concludes that anthropogenic influences are joined by solar irradiance, volcanic activity, and natural variability (“internal ocean dynamics”) in determining decadal variability in SSTs:
“Therefore these data suggest a complex combination of solar irradiance, volcanic activity, internal ocean dynamics and external anthropogenic forcing explain the variability in Aleutian SSTs for the past 342 years.”
[…] warming” is a myth — so say 80 graphs from 58 peer-reviewed scientific papers published in […]
[…] 80 Graphs From 58 New (2017) Papers Invalidate Claims Of Unprecedented Global-Scale Modern Warming […]
[…] warming” is a myth — so say 80 graphs from 58 peer-reviewed scientific papers published in […]
[…] warming” is a myth — so say 80 graphs from 58 peer-reviewed scientific papers published in […]
[…] warming” is a myth — so say 80 graphs from 58 peer-reviewed scientific papers published in […]
[…] as collated by Kenneth Richard at No Tricks Zone, are just some of the charts to prove […]
Noise is noisy. Especially when it’s taken out of context. That is the only conclusion I can draw from this post.
Furthermore, the “hockey stick” graphs are dumb. If climate change is actually happening, we won’t be able to see the hockey stick part of it until it’s probably too late to do anything about it. There’s just too much noise in the data.
I don’t have time to read through all 80 papers, but I did check out a few of them. And I’m not impressed with this post. Take the graph showing temperature in the North Atlantic: -2 degrees Celcius is the freezing point of saltwater, and you’ll notice the graph is basically just hovering around that point or a few degrees above. Lower temperatures correlate with the large amount of ice melt we’re seeing in the Arctic, while higher temperatures, presumably, correlate to years in which they’re wasn’t as much melt-off. Either way the graph tells us nothing.
[…] warming” is a myth — so say 80 graphs from 58 peer-reviewed scientific papers published in […]
While so much attention is given to cause of climate change, no one bothers to look at the positive side, even so we know for sure that planet was far warmer in the past.
Looking at it from practical point of view, most food is grown in northern hemisphere. Just imagine the boundary of arable land in Russia and Canada would extend another 1000 miles. Sure the Sahara would get hotter, but nothing grows there anyway. Seems to me we should prepare for inevitable and make the best out of it instead of arguing what caused it.
If the ocean rises, are we prepared to relocate coastal areas? Is there an UN plan? Has anyone ever even suggested a plan how to adapt? Instead of “We do something if someone pay us” attitude of PARIS accord, has a single nation suggested “What to do if all fails?” Give that a thought instead!
[…] Last year there were at least 60 peer-reviewed papers published in scientific journals demonstrating that Today’s Warming Isn’t Global, Unprecedented, Or Remarkable. . Just within the last 5 months, 58 more papers and 80 new graphs have been published that continue to undermine the popularized conception of a slowly cooling Earth temperature history followed by a dramatic hockey-stick-shaped uptick, or an especially unusual global-scale warming during modern times. . Yes, some regions of the Earth have been warming in recent decades or at some point in the last 100 years. Some regions have been cooling for decades at a time. And many regions have shown no significant net changes or trends in either direction relative to the last few hundred to thousands of years. – See more at: https://notrickszone.com/2017/05/29/80-graphs-from-58-new-2017-papers-i… […]