Temperatures To Decrease 0.5°C-0.7°C
Due To Low Sunspots, Solar Minimum
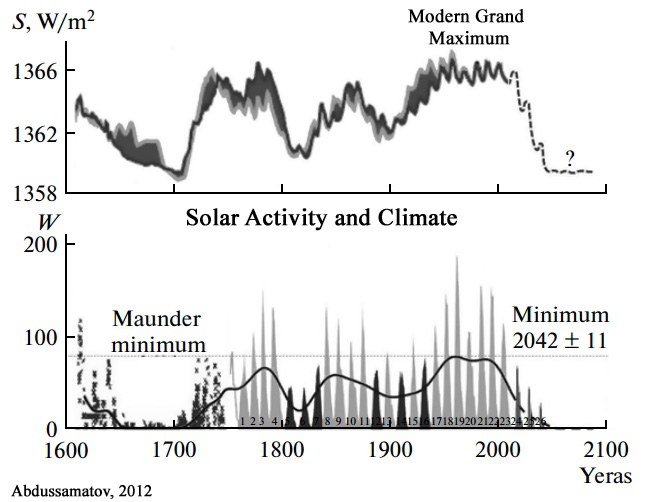
Image Source: Abdussamatov, 2012
During 2017, 120 papers linking historical and modern climate change to variations in solar activity and its modulators (clouds, cosmic rays) have been published in scientific journals.
It has been increasingly established that low solar activity (fewer sunspots) and increased cloud cover (as modulated by cosmic rays) are highly associated with a cooling climate.
In recent years, the Earth has unfortunately left a period of very high solar activity, the Modern Grand Maximum. Periods of high solar activity correspond to multi-decadal- to centennial-scale warming.
Solar scientists are now increasingly forecasting a period of very low activity that will commence in the next few years (by around 2020 to 2025). This will lead to climate cooling, even Little Ice Age conditions.
Thirteen recently-published papers forecasting global cooling are listed below.
Sun et al., 2017
The contrast analysis between the periodic movement of the planetary system and the periodicity of solar activity shows that the two phenomena exhibit a period change rule of 179.5 years. Moreover, orderly orbits correspond to high periods of solar activity and disorderly orbits correspond to low periods of solar activity. … Therefore, a certain relationship exists between the movement of the planetary system, solar activity, and global climate change.
The movement of the planetary system can thus be used to interpret the periodic trends of the movement of the Sun and global climate change. … A period change rule of a 179.5-year cycle is observed. This period change rule is consistent with the change that takes place once every 2 centuries (about 160 to 210 years) for solar activity and global climate change.
The Sun is headed into a grand minimum, that is, a period of unusually low solar activity. A relatively low number of or nonexistent sunspots are observed during the protracted solar minimum. Since 1000 AD, there have been six protracted solar minimums, namely, the Oort minimum (1040–1080 AD), Medieval Minor minimum (1150 1200 AD), Wolf minimum (1270–1350 AD), Spörer minimum (1430–1520 AD), Maunder minimum (1620–1710 AD), and Dalton minimum (1787–1843 AD). [A]ll the orbits of the planetary system are in disorder during the six protracted solar minimums.
The planet juncture index and heliocentric longitude are also in disorder during the six protracted solar minimums. The numerical simulation results show a high number of sunspots and strong solar activity [warming] during the orderly orbit and a low number of sunspots, low solar activity, and the occurrence of a protracted solar minimum or little ice age during the disorderly orbit. … [T]he results indicate that the solar minimum and little ice ages correspond to the planetary system’s disorderly orbit.
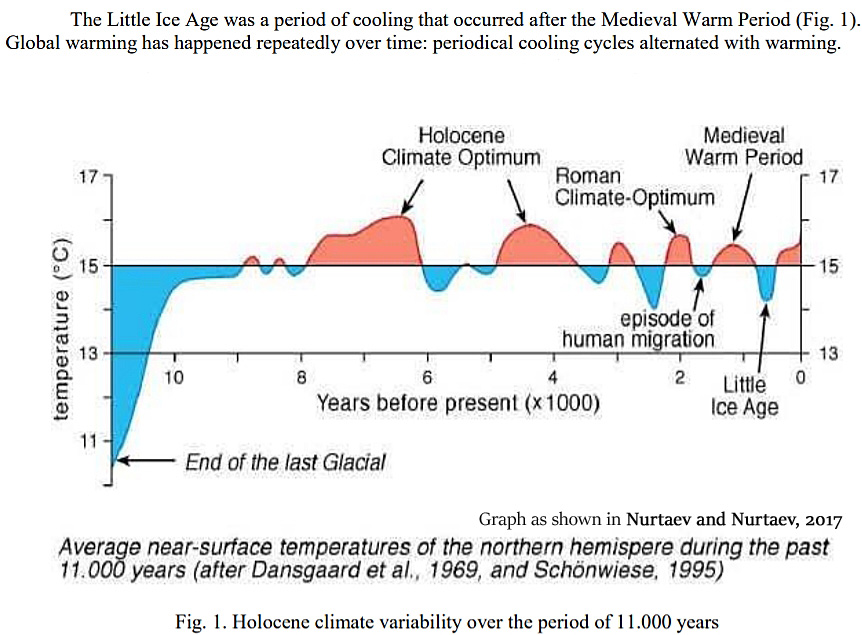
Nurtaev and Nurtaev, 2017
A reconstruction of total solar irradiance since 1610 to the present estimated by various authors an increase in the total solar irradiance since the Maunder Minimum of about 1.3 W/m² [2]. This is a huge amount of energy, taking into account the Earth’s total land mass.
More sunspots deliver more energy to the atmosphere, by way of increased brightness of the Sun and solar wind what tend to warm the Earth. Solar activity affects the Earth in many ways, some which we are still coming to understand.
In accordance with National Geophysical Data Center (NGDC) forecasting the solar cycles 24 and 25 will be very weak: averaged sunspot numbers W-35 for the solar cycle 24 and for the solar cycle 25 less than W-35 , NGDC (2009). Total Solar Irradiance will equal -1365. (23 cycle -1366). This actually will lead to a decrease of the temperature on 0.5 – 0.7°C in both averaged solar cycles, in Geneva will decrease to 1.5 °C. Temperature of air will be lower in the Northern Hemisphere. Precipitation rate in Caucasus will be more in average on 100-150 mm in dependence from location.
The World Ocean level also will be lower, due to more snow and glacier accumulation on continents.
Yndestad and Solheim, 2017
Deterministic models based on the stationary periods confirm the results through a close relation to known long solar minima since 1000 A.D. and suggest a modern maximum period from 1940 to 2015.
The model computes a new Dalton-type sunspot minimum from approximately 2025 to 2050 and a new Dalton-type period TSI minimum from approximately 2040 to 2065.
Periods with few sunspots are associated with low solar activity and cold climate periods. Periods with many sunspots are associated with high solar activity and warm climate periods. … Studies that employ cosmogenic isotope data and sunspot data indicate that we are currently leaving a grand activity maximum, which began in approximately 1940 and is now declining (Usoskin et al., 2003; Solanki et al., 2004; Abreu et al., 2008). Because grand maxima and minima occur on centennial or millennial timescales, they can only be investigated using proxy data, i.e., solar activity reconstructed from 10Be and 14C time-calibrated data. The conclusion is that the activity level of the Modern Maximum (1940–2000) is a relatively rare event, with the previous similarly high levels of solar activity observed 4 and 8 millennia ago (Usoskin et al., 2003). Nineteen grand maxima have been identified by Usoskin et al. (2007) in an 11,000-yr series.
Twenty-seven grand minima are identified with a total duration of 1900 years, or approximately 17% of the time during the past 11,500 years (Usoskin et al., 2007). An adjustment-free reconstruction of the solar activity over the last three millennia confirms four grand minima since the year 1000: Maunder (1640–1720), Spörer (1390–1550), Wolf (1270–1340) and Oort (1010–1070) (Usoskin et al., 2007). The Dalton minimum (1790–1820) does not fit the definition of a grand minimum; it is more likely a regular deep minimum that is observed once per century or an immediate state between the grand minimum and normal activity (Usoskin, 2013). Temperature reconstructions for the last millennium for the Northern Hemisphere (Ljungquist, 2010) show a medieval maximum temperature at approximately the year 1000 and a cooling period starting at approximately 1350, immediately after the Wolf minimum and lasting nearly 500 years, with the coldest period in what is referred to as the Little Ice Age (LIA) at the time of the Maunder minimum. A cold period was also observed during the time of the Dalton minimum. The Maunder and the Dalton minima are associated with less solar activity and colder climate periods. In this investigation, minimum solar activity periods may serve as a reference for the identified minimum irradiations in the TSI oscillations.
All solar indices have maxima between 1920 and 1940; the majority of the maxima occur in the 1930s. The Hoyt-Schatten irradiance model has been calibrated and extended with the newest version of ACRIM TSI observations (e.g. Scafetta and Willson, 2014, Fig. 16); it is employed in this analysis. In the following section, this reconstruction is referred to as TSI HS. A mostly rural Northern Hemisphere composite temperature series 1880–2013 shows strong correlation with the TSI-HS reconstruction, which indicates a strong solar influence on the temperature of the Northern Hemisphere (Soon et al., 2015). … A visual inspection of the TSI wavelet spectrum reveals the dominant periods in the TSI data series in the time window between 1700 and 2013. The long wavelet period has a maximum in 1760, 1840, 1930, and 2000, with a mean gap of approximately 80 years.
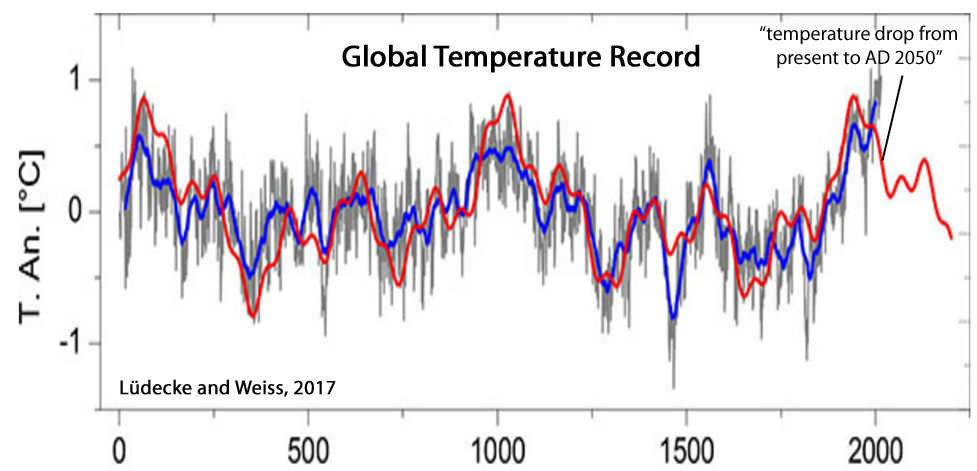
Lüdecke and Weiss, 2017
The Sun as climate driver is repeatedly discussed in the literature but proofs are often weak. In order to elucidate the solar influence, we have used a large number of temperature proxies worldwide to construct a global temperature mean G7 over the last 2000 years. The Fourier spectrum of G7 shows the strongest components as ~1000-, ~460-, and ~190 – year periods whereas other cycles of the individual proxies are considerably weaker. The G7 temperature extrema coincide with the Roman, medieval, and present optima as well as the well-known minimum of AD 1450 during the Little Ice Age. We have constructed by reverse Fourier transform a representation of G7 using only these three sine functions, which shows a remarkable Pearson correlation of 0.84 with the 31-year running average of G7 [global temperature over the last 2000 years]. The three cycles are also found dominant in the production rates of the solar-induced cosmogenic nuclides 14C and 10Be, most strongly in the ~190 – year period being known as the De Vries/Suess cycle. By wavelet analysis, a new proof has been provided that at least the ~190-year climate cycle has a solar origin.
G7 [global temperature over the last 2000 years], and likewise the sine representations have maxima of comparable size at AD 0, 1000, and 2000. We note that the temperature increase of the late 19th and 20th century is represented by the harmonic temperature representation, and thus is of pure multiperiodic nature [it is of natural solar origin].
It can be expected that the periodicity of G7, lasting 2000 years so far, will persist also for the foreseeable future. It predicts a temperature drop from present to AD 2050, a slight rise from 2050 to 2130, and a further drop from AD 2130 to 2200, upper panel, green and red curves).
Zharkova et al., 2017
Using a summary curve of two eigen vectors of solar magnetic field oscillations derived with Principal Components Analysis (PCA) from synoptic maps for solar cycles 21-24 as a proxy of solar activity, we extrapolate this curve backwards three millennia revealing 9 grand cycles lasting 350-400 years each. The summary curve shows a remarkable resemblance to the past sunspot and terrestrial activity: grand minima – Maunder Minimum (1645-1715 AD), Wolf minimum (1280-1350 AD), Oort minimum (1010-1050 AD) and Homer minimum (800 900 BC); grand maxima – modern warm period (1990-2015), medieval warm period (900-1200 AD), Roman warm period (400-10 BC) and others. We verify the extrapolated activity curve by the pre-telescope observations of large sunspots with naked eye, by comparing the observed and simulated butterfly diagrams for Maunder Minimum (MM), by a maximum of the terrestrial temperature and extremely intense terrestrial auroras seen in the past grand cycle occurred in 14-16 centuries.
We confirm the occurrence of upcoming Modern grand minimum in 2020-2053, which will have a shorter duration (3 cycles) and, thus, higher solar activity compared to MM. … One of the examples of fitting incorrectly the oscillating function with a linear regression approach is shown by Akasofu (2010) (see her Fig. 9), when explaining the modern era recovery of the Earth from the little ice period and the incorrect use of a linear part of the temperature variations for the extremely incorrect prediction of the terrestrial temperature growth in the next century.
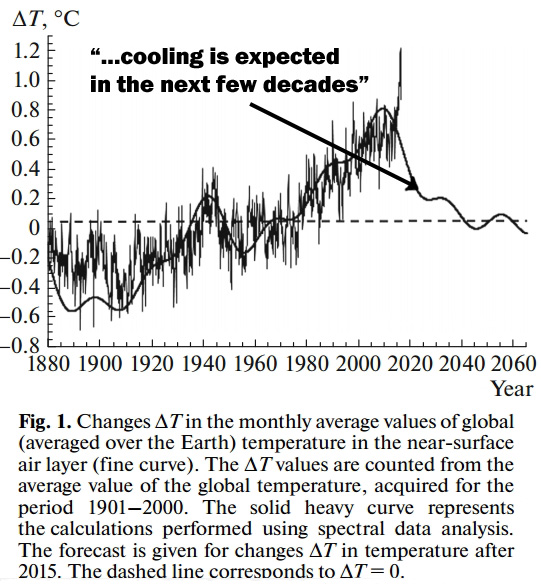
Stozhkov et al., 2017
One of the most important problems facing humanity is finding the physical mechanism responsible for global climate change, particularly global warming on the Earth. … Summation of these periodicities for the future (after 2015) allows us to forecast the next few decades. The solid heavy line in Fig. 1 shows that cooling (a drop in ΔT values) is expected in the next few decades.
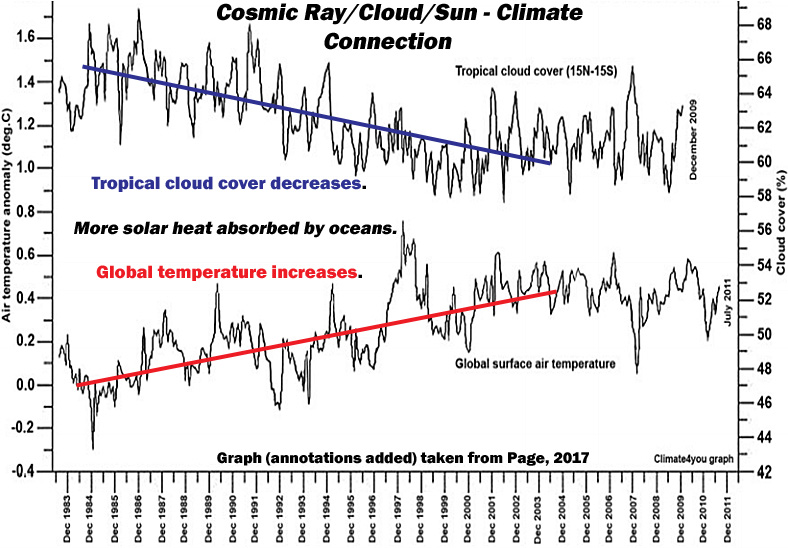
Figure 2 shows the dependence between the annual average changes ΔT in the global temperature in the near-surface air layer and charged particle flux N in the interval of altitudes from 0.3 to 2.2 km. We can see there is a connection between values ΔТ [temperature] and N [charged particle flux]: with an increase in cosmic ray flux N, the values of changes of global temperature decrease. This link is expressed by the relation ΔT = –0.0838N + 4.307 (see the dashed line in Fig. 2), where the ΔT values are given in °C, and the N values (in particle/min units) are related to the charged particle flux measured at an altitude of 1.3 km. The correlation coefficient of the line with the experimental data is r = –0.62 ± 0.08. … Our results could be connected with the mechanism of charged particle fluxes influencing the Earth’s climate; it includes, first of all, the effect charged particles have on the accelerated formation of centers of water vapor condensation, and thus on the increase in global cloud cover. The total cloud cover is directly connected with the global temperature of the near surface air layer.
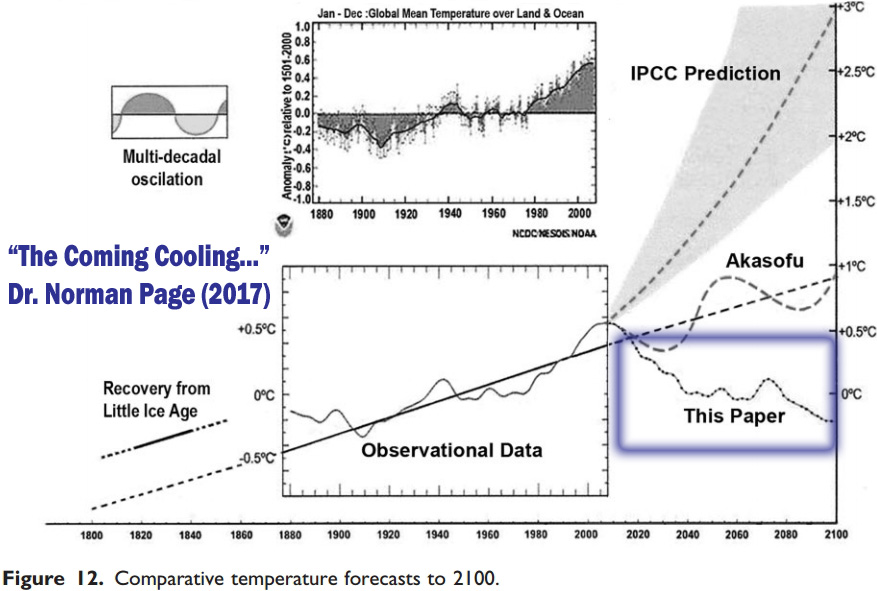
Page, 2017
The coming cooling: Usefully accurate climate forecasting for policy makers
This paper argues that the methods used by the establishment climate science community are not fit for purpose and that a new forecasting paradigm should be adopted. Earth’s climate is the result of resonances and beats between various quasi-cyclic processes of varying wavelengths. It is not possible to forecast the future, unless we have a good understanding of where the earth is in time in relation to the current phases of those different interacting natural quasi periodicities.
Evidence is presented specifying the timing and amplitude of the natural 60 ± year and, more importantly, 1000 year periodicities (observed emergent behaviors) that are so obvious in the temperature record. Data related to the solar climate driver are discussed and the solar cycle 22 low in the neutron count (high solar activity) in 1991 is identified as a solar activity millennial peak and correlated with the millennial peak – inversion point – in the RSS temperature trend in about 2004. The cyclic trends are projected forward and predict a probable general temperature decline in the coming decades and centuries. Estimates of the timing and amplitude of the coming cooling are made.
If the real climate outcomes follow a trend which approaches the near term forecasts of this working hypothesis, the divergence between the IPCC forecasts and those projected by this paper will be so large by 2021 as to make the current, supposedly actionable, level of confidence in the IPCC forecasts untenable.
The global millennial temperature rising trend seen in Figure 11 from 1984 to the peak and trend inversion point in the Hadcrut3 data at 2003/4 is the inverse correlative of the Tropical Cloud Cover fall from 1984 to the Millennial trend change at 2002. The lags in these trends from the solar activity peak at 1991 (Figure 10) are 12 and 11 years, respectively. These correlations suggest possible teleconnections between the GCR flux, clouds, and global temperatures.
Unless the range and causes of natural variation, as seen in the natural temperature quasi-periodicities, are known within reasonably narrow limits, it is simply not possible to even begin to estimate the effect of anthropogenic CO2 on climate. Given the lack of any empirical CO2-climate connection reviewed earlier and the inverse relationship between CO2 and temperature [during the Holocene, when CO2 rose as temperatures declined] seen in Figure 2, and for the years 2003.6–2015.2 in Figure 4, during which CO2 rose 20 ppm, the simplest and most rational working hypothesis is that the solar ‘activity’ increase is the chief driver of the global temperature increase since the LIA.
Torres and Guzmán, 2016
Conclusions Based on our results, we propose the use of the Wolf’s Number Oscillation Index (WNOI) – as a more uniform alternative to the ONI – in the range over 30 and below -30. The analysis of the material presented and the arguments discussed allows us to define a possible relationship between phenomena related to Solar Cycle, the ENSO, climatic conditions, as well as some criteria for the establishment of public policies for preservation and remediation of the environment in the long run. We can conclude that solar activity oscillations impact the earth climatic conditions to such a extent that they become measurable only in the long run. The magnitude of the Solar Cycle – from 7 to 17 and a mean of 11.2 years – seems to support this statement. Based on the similarities of the Solar Cycles 5 and 24 we can expect a longer period of cold weather for the years 2022 y/o 2034, corresponding to the Solar Cycles 24 and 25.
Sanchez-Sesma, 2016
This empirical modeling of solar recurrent patterns has also provided a consequent multi-millennial-scale experimental forecast, suggesting a solar decreasing trend toward grand (super) minimum conditions for the upcoming period, AD 2050–2250 (AD 3750–4450).
Solar activity (SA) has non-linear characteristics that influence multiple scales in solar processes (Vlahos and Georgoulis, 2004). For instance, millennia-scale solar oscillations have been recently detected, like those of about 6000 and 2400 years, by Xapsos and Burke (2009) and Charvátová (2000), respectively, with important and interesting influences in the near, past and future climate. These millennialscale patterns of reconstructed SA variability could justify epochs of low activity, such as the Maunder minimum, as well as epochs of enhanced activity, such as the current Modern Maximum, and the Medieval maximum in the 12th century.
We can conclude that the evidence provided is sufficient to justify a complete updating and reviewing of present climate models to better consider these detected natural recurrences and lags in solar processes.
Evans, 2016
Four manifestations of unconventional climate influences are identified, each with at least as much effect on surface temperature as the direct heating effect of changes in total solar irradiance (TSI): external-driven albedo; countervailing cooling during TSI peaks, implied by the absence of corresponding peaks in the surface temperature record (the “notch”); the long-term sensitivity of surface warming to TSI increases; and the delay of ∼11 years between changes in underlying or smoothed TSI and the corresponding changes in surface temperature.
We hypothesize these are all manifestations of a single force whose exact mechanism is unknown but whose crucial properties can be deduced: “Force X” modulates the Earth’s albedo, and lags TSI by one sunspot cycle or half the ∼22-year cycle of the Sun’s hydromagnetic dynamo. A second, alternative hypothesis is of “force N” for the notch and “force D” for the delayed force causing the other three manifestations. The notch-delay solar model can explain the global warming of the last few decades and centuries in terms of force X/D. Several solar indicators including TSI peaked ∼1986, but surface warming continued until ∼1998, which is explained by the delay.
The notch-delay hypothesis predicts sustained and significant global cooling starting sometime in the period 2017 to 2022, of ∼0.3°C but perhaps milder (TSI estimates vary), as force X/D falls off in response to the marked decline in underlying TSI from around 2004—one of the three biggest and fastest falls in TSI since sunspot records began in 1610.
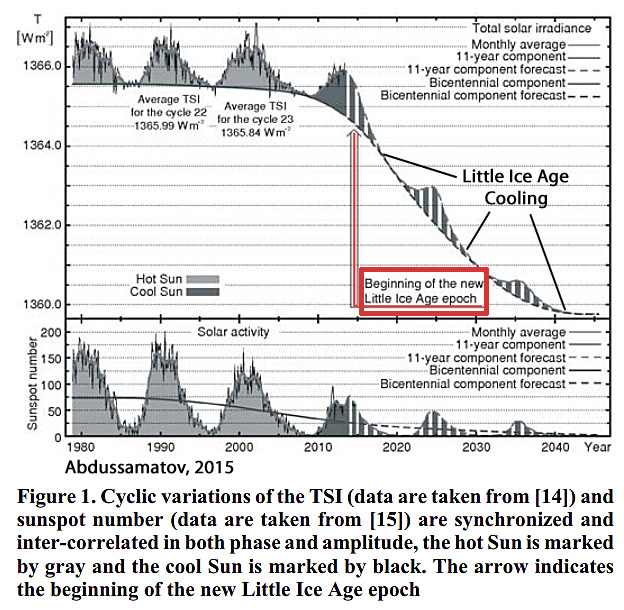
Abdussamatov, 2015
A long-term negative deviation of the Earth’s average annual energy balance from the equilibrium state is dictating corresponding variations in it’s the energy state. As a result, the Earth will have a negative average annual energy balance also in the future. This will lead to the beginning of the decreasing in the Earth’s temperature and of the epoch of the Little Ice Age after the maximum phase of the 24-th solar cycle approximately since the end of 2014.
The influence of the consecutive chain of the secondary feedback effects (the increase in the Bond albedo and the decrease in the concentration of greenhouse gases in the atmosphere due to cooling) will lead to an additional reduction of the absorbed solar energy and reduce the greenhouse effect. The start of the TSI’s Grand Minimum is anticipated in the solar cycle 27±1 in 2043±11 and the beginning of the phase of deep cooling of the 19th Little Ice Age for the past 7,500 years around 2060±11.
Thus, the long term variations of the solar constant (allowing for their direct and secondary impacts, with the latter being due to feedback effects) are the major and essential cause of climate changes because the Earth’s climate variation is a function of longterm imbalance between the solar radiation energy incoming into the upper layers of the Earth’s atmosphere and Earth’s total energy outgoing back to space.


[…] Notrickszone: 7 New (2017) Papers Forecast Global Cooling, Another Little Ice Age Will Begin Soon […]
Zharkova has warned that her model could not be used as proof of a mini ice age – in part because of global warming.Speaking to Sky News, she said, “I hope global warning will be overridden by this effect, giving humankind and the Earth 30 years to sort out our pollution.” spelling and word use from source
I sincerely hope that global warming will override the cooling. Cooling presents far more dangers than warming.
There’s no proof of a mini ice age in any paper. These are all prognostications. On the other hand, she and her colleagues believe that their model explains over 90% of past and modern warming and cooling trends, including the Medieval Warm Period, which was warmer than now even with CO2 levels in the 270s ppm.
https://notrickszone.com/wp-content/uploads/2017/04/Modern-Grand-Maximum-To-Cooling-Zharkova-2015-1.jpg
You still think that climate science considers CO2 as the only thing capable of warming the planet? Secondly, how can you be sure that the MWP was warmer than now? (*) And last but not least, why does a warmer climate in the past any meaning in explaining the warm climate of today? You know, with one key difference being a much much higher CO2 concentration …
*: You’ll probably link to lots of graph showing the MWP to be super warm. Maybe something like this? https://notrickszone.com/wp-content/uploads/2011/04/Global-temperature-11000-years.gif or something like this? https://wattsupwiththat.files.wordpress.com/2017/01/fig-3-estimate-of-nh-temperature-ljungqvist-2010-1.jpg … notice the little change in the temperature anomaly that is the MWP? 0.5°C warmer than the DACP and around 0.9°C warmer than the LIA. But still, the proxy data has the MWP warmer than the modern period. But can we really ignore the instrumental record? Even the less-warming-than-everyone-else UAH6.0 shows a 1°C warming since just the 1980s. Data going further back to ~1900 has even higher warming on record. So the question remains, why are you sure that the MWP was warmer than now?
I have not written what you just made up above. I don’t use the word “only”. Notice that I use words like predominantly and mostly and primarily. And yet when you attempt to marginalize me by describing what I “think”, you disingenuously use words like only and everybody…like you did below…before I corrected you. Respond to what I actually wrote, not what you’ve fabricated by inserting all-or-nothing words.
No, we call those who believe that humans predominantly [not only] control on the temperatures of the oceans, glacier and sea ice melt or advance, sea level rise or fall, the intensification of hurricanes, the imminent (by 2050) extinction of polar bears and over a million other species by emitting more CO2 or less CO2…believers.
A “believer” is someone that believes something, without one iota of proof
You “believe” that CO2 causes warming, but cannot produce one iota of empirical proof
AGW is an EMPTY religion, seb.
“Even the less-warming-than-everyone-else UAH6.0 shows a 1°C warming since just the 1980s”
That is a LIE,
UAH only shows 0.5°C rise. (linear trend 0.0128°c/year over 39 years.)
And as you well know, ALL of that warming has come from ocean cycles and events.
The 1998 El Nino added around 0.3°C of that, and the El Nino has not fully settled down yet and is about 0.2°C above the zero-trend line from 2001 – 2015.
You have been TOTALY UNABLE to show any CO2 warming signature in the UAH satellite data.. Because there isn’t any.
You remain, as always, EMPTY of any facts or science.
Actual temperature measurements have a much higher swing than proxies.
As well as smoothing in the temperature data proxies can also have some temporal inaccuracy in them, so that also tends to smooth things out. Proxies only give a general overall trend, (such as GISP data showing we are very much at a COOL period of the current interglacial.)
Peaks that happen over 5, 10, 20 years will often just be averaged out..
Combining modern measured and mal-adjusted temperatures with proxies, should be avoided as a mathematical nonsense.
http://www.c3headlines.com/2013/02/definitive-study-eu-scientists-confirm-modern-temperatures-cooler-than-medieval-roman-global-warming.html#undefined.uxfs
You’re welcome.
Nice,
thank you Jeremy Poynton.
I’m not buying that we’re staring into another LIA. However the fact is that theoretically right now a person could walk on all frozen ground or water starting in North Texas, going over the N. Pole, and ending in Northern India. I say “theoretically” just because nobody has ever done such a thing before. Heck it’s -50 C at Summit station in Greenland right now.
https://www.esrl.noaa.gov/psd/map/images/fnl/sfctmp_01.fnl.html
Buy your oranges and grapefruits now because next week there is going to be hard freeze in the Florida Citrus belt. Orlando likely to see -3 or 4 C.
So much for my banana plants. lol. check ps4 remote play and chill..
Snow forecast for N. Florida on New Years. If that happens it will be the 2nd time this year. Beginning to feel like were back in the 1970’s.
I live in North Central Indiana. January of 1978 we had our worst blizzard on record.
Both Indiana and Ohio recorded their all time record low pressures during that time. Lowest was in Cleveland, OH at 28.28 inHg That’s a reading like one would see for a major hurricane.
And for much the same reason, RAH
https://s19.postimg.org/tz51q2mpf/jetstream_1977.gif
@RAH
I’m currently visiting relatives in SW Indiana. It’s 23 Deg F., and forecast to get to near 0 three days from now. You are most likely a bit chillier?
Poor Canada. When they most need their “ruinable” energy to work, it doesn’t.
https://realclimatescience.com/2017/12/ontario-in-deep-freeze-wind-and-solar-generating-less-than-10-of-their-power/
Poor Canada here! Manitoba. Was -38C this morning with -48C windchill. Had to zip up my hoodie!
yonason
17 F here as I write this at 08:04 EST.
Tain’t over yet. According to my phone weather app, Indy is due to get to -14 F Monday overnight.
Bundle up and stay warm, RAH!
Yep the real cold is coming and it’s going to hang on here for awhile if the weather models are correct. Cleaned the fireplace and restocked the wood rack today. Bird feeders are full. So we’re as ready as we’re going to be.
I don’t know if your familiar with Joe Bastardi and https://www.weatherbell.com/
I watch his free “Daily Update” and weekend “Saturday Summary” videos every day. I have found him to be excellent for medium to long range forecasts and among the best for hurricane forecasting also. When you are the founder of a successful private weather company you’ve go something going for you. Unlike government forecasters his livelihood depends on his performance. You’ll also get some great education on aspects of climate on occasion. Well worth your time. I watch him on my phone when I’m on the road. Just click the link and scroll down to the free videos.
I’ve enjoyed what I’ve seen by him, and yes, I’ve even learned a few things. Haven’t been watching his freebies on a regular basis. Didn’t realize he had that much stuff available. Now I know, I’ll have to start. Thanks.
What do you make of Willis Eschenbach’s dissatisfaction with the sun activity paradigm?
“… why no sign of the 11-year solar cycles?
I hold that this shows that the temperature of the system is relatively insensitive to changes in forcing. This, of course, is rank heresy to the current scientific climate paradigm, which holds that ceteris paribus, changes in temperature are a linear function of changes in forcing. I disagree. I say that the temperature of the planet is set by a dynamic thermoregulatory system composed of emergent phenomena that only appear when the surface gets hotter than a certain temperature threshold. These emergent phenomena maintain the temperature of the globe within narrow bounds (e.g. ± 0.3°C over the 20th Century), despite changes in volcanoes, despite changes in aerosols, despite changes in GHGs, despite changes in forcing of all kinds. The regulatory system responds to temperature, not to forcing.
And I say that because of the existence of these thermoregulatory systems, the 11-year variations in the sun’s UV and magnetism and brightness, as well as the volcanic variations and other forcing variations … well, they make little difference.
As a result, once again, I open the Quest for the Holy 11-Year Grail to others. I invite those that believe that “It’s the sun, stupid” to show us the terrestrial climate record that has any sign of being correlated with the 11-year sunspot cycles. I’ve looked. Lots of folks have looked … where is that record? I encourage you to employ whatever methods you want to use to expose the connection—cross-correlation, wavelet analysis, spectrum analysis, fourier analysis, the world is your lobster. Report back your findings, I’d like to put this question to bed.”
The source: https://wattsupwiththat.com/2014/05/24/its-the-evidence-stupid/
Here you go. WFT graph.
The spikes of the solar cycle peaks each have a corresponding spike in the HadCRUT 3 graph. Note I’ve used HadCRUT 3 for the obvious reasons.
The spikes don’t always line up. I think that is because of things like the thermohaline cycle in the oceans delaying a response, depending on where it is in its phases.
The second graphic which shows the cycle clearly is a Morelet wavelet analysis of HadCRUT3. You can see the ~10 year solar cycle and the ~21 year double cycle pretty clearly. Note that solar cycles have been a little shorter than average during the grand maximum, which is consistent with Friis-Christensen and others.
[…] Notrickszone: 7 New (2017) Papers Forecast Global Cooling, Another Little Ice Age Will Begin Soon […]
News for all. Anything about tomorrow is always prognostication. Truth is that even after an event occurs nobody can agree about what happened or why. At least here we’re getting a bit more balance in the lies we tell each other about the things nobody can know. 😉
Have you sent this to the president or some other responsible person in the White House? I think you should.
Page 2017 above states re future cooling:
“3. Future Temperature Trends
To summarize, the forecasts which follow rely on four basic working hypotheses. First, the solar millennial activity cycle peaked in 1991+/- as seen in Fig 10 in the Oulu neutron count. Second, the corresponding millennial temperature cycle peaked in the RSS data at about 2003-Fig. 4.Third, the 60 year temperature cycle peaked at about the same time and fourth, Ockham’s razor would suggest that the simplest working hypothesis currently available, based on the weight of all the data, is that the trends from the 990 Millennial peak to the 2003 Millennial cycle peak seen in Figs 3 and 4 will, in general, repeat from 2003 to 3004.
3.1 Long Term.
The depths of the next LIA will likely occur about 2640 +/-. In the real world no pattern repeats exactly because other things are never equal. Look for example at the short-term annual variability about the 50-year moving average in Fig. 3. The actual future pattern will incorporate other solar periodicities in addition to the 60-year and millennial cycles, and will also reflect extraneous events such as volcanism. However, these two most obvious cycles should capture the principal components of the general trends with an accuracy high enough, and probability likely enough, to guide policy. Forward projections made by mathematical curve fitting alone have no necessary connection to reality if turning points picked from empirical data in Figs 4 and 10 are ignored.”
Well said Dr. Page, you have teased out the the variation that are evident in the solar cycles, putting realistic dates to probable climate regime changes.
If only the politicians could appreciate what is all too evident — the sun sets our planet’s climate trajectory — its general long term trend (decades and longer), the ocean’s and atmosphere’s movement, cloud cover, and all the rest are the confounding issues affecting the timing and the strength of regional climate effects.
The oceans RULE the climate, and the sun feeds the oceans with energy.
There is a LOT of system buffering/lag, (oceans are huge storages) which we have yet to fully figure out.
Over the last half of last century, we had a solid series of strong solar cycles, some called a “Grand Solar Maximum”.
That is what is responsible for the strong El Ninos that have caused the warming steps and transients which are the only warming in the satellite data.
That has now passed, and it seems we may be heading into a protracted period of lower solar activity.
Exactly how long until this starts to produce cooling is the real question of interest.
I surmise that the 2015/16 EL Nino was actual a balancing release of energy from the oceans.
If so, then over the next year or so, we will start to see a gradual drop in the global temperature (in UAH, anyway….. its going to take a lot of cooling to get passed the data fudging in other temperature series.)
Time will tell.
The sooner the better from the world perspective, because a strong cooling trend would destroy the Anti-CO2 Agenda, which is the REAL threat to modern civilisation and its future.
Countries will be forced to reinstate reliable, solid, despatchable energy sources, as so called renewables, wind and solar, proved unable to supply as required.
[…] “During 2017, 120 papers linking historical and modern climate change to variations in solar activity and its modulators (clouds, cosmic rays) have been published in scientific journals,” reported Kenneth Richard at NoTricksZone. […]
[…] “During 2017, 120 papers linking historical and modern climate change to variations in solar activity and its modulators (clouds, cosmic rays) have been published in scientific journals,” reported Kenneth Richard at NoTricksZone. […]
Just imagine what would happen in the weather the USA is currently having, if they had to rely on wind and solar.
It is totally sickening that people are being told to “get away from” fossil fuels….
when THAT’S THE ONLY THING KEEPING THEM ALIVE !!!
Wind and solar DO NOT FUNCTION in the current NE USA weather conditions.
The evil, anti-human, anti-CO2 agenda has A LOT to answer for.
PS. Let’s hope that the jet stream doesn’t alter and bring the cold and snow to the UK and Europe.
They have decimated their energy supply systems, and the outcome could be quite catastrophic.
But certain people just wouldn’t care, so long as ‘they’ still had their inner city ghetto basement, and fossil fuel powered heating.
Hope everybody enjoys this tweet from Trump, especially seb 🙂
https://s19.postimg.org/md6wggnur/Trump_tweet_USA_freez.png
[…] recently-published papers, seven new papers, forecasting global cooling are listed HERE: References to Dalton and Maunder […]
[…] ・7 New Papers Forecast Global Cooling, Another Little Ice Age Will Begin Soon […]
[…] Read more at No Tricks Zone […]
[…] “During 2017, 120 papers linking historical and modern climate change to variations in solar activity and its modulators (clouds, cosmic rays) have been published in scientific journals,” reported Kenneth Richard at NoTricksZone. […]
[…] “During 2017, 120 papers linking historical and modern climate change to variations in solar activity and its modulators (clouds, cosmic rays) have been published in scientific journals,” reported Kenneth Richard at NoTricksZone. […]
“Would you bet your paycheck on a weather forecast for tomorrow? If not, then why should this country bet billions on ‘global warming’ predictions that have even less foundation?”
[…] “During 2017, 120 papers linking historical and modern climate change to variations in solar activity and its modulators (clouds, cosmic rays) have been published in scientific journals,” reported Kenneth Richard at NoTricksZone. […]
Dr. Willi Dansgaard of the University of Copenhagen in the 1960′s analysed the Greenland Camp Century ice core. He saw two cycles in the ice, one peaks every 78 years and the other peaks every 181 years which he attributed to the Sun.
Sometime around 1970, Dansgaard offered a long term forecast based on those two cycles:
(from:
CALDER, Nigel, 1972: “The Restless Earth. A report on the new geology.” p 127.
The British Broadcasting Corporation. ISBN 0 563 121238.)
We can clearly see the gradual COOLING of the Greenland ice sheet over 8000 years
https://notrickszone.com/wp-content/uploads/2017/07/Holocene-Cooling-Greenland-Kobashi-2017.jpg
[…] on mahdollista, että ilmasto tulevaisuudessa on nykyistä kylmempi (Linkki). Jos viilenemiseen eivät riitä sykliset vaihtelut maapallon merissä ja auringossa, […]
[…] there’s the small matter of the coming Little Ice Age, which seven new scientific papers published this year have […]
[…] there’s the small matter of the coming Little Ice Age, which seven new scientific papers published this year have […]
[…] there’s the small matter of the coming Little Ice Age, which seven new scientific papers published this year have […]
[…] there’s the small matter of the coming Little Ice Age, which seven new scientific papers published this year have […]
[…] there’s the small matter of the coming Little Ice Age, which seven new scientific papers published this year have […]
[…] there’s the small matter of the coming Little Ice Age, which seven new scientific papers published this year have […]
[…] there’s the small matter of the coming Little Ice Age, which seven new scientific papers published this year have […]
[…] there’s the small matter of the coming Little Ice Age, which seven new scientific papers published this year have […]
[…] there’s the small matter of the coming Little Ice Age, which seven new scientific papers published this year have […]
[…] there’s the small matter of the coming Little Ice Age, which seven new scientific papers published this year have […]
[…] there’s the small matter of the coming Little Ice Age, which seven new scientific papers published this year have […]
[…] there’s the small matter of the coming Little Ice Age, which seven new scientific papers published this year have […]
[…] there’s the small matter of the coming Little Ice Age, which seven new scientific papers published this year have […]
[…] there’s the small matter of the coming Little Ice Age, which seven new scientific papers published this year have […]
[…] there’s the small matter of the coming Little Ice Age, which seven new scientific papers published this year have […]
[…] there’s the small matter of the coming Little Ice Age, which seven new scientific papers published this year have […]
[…] there’s the small matter of the coming Little Ice Age, which seven new scientific papers published this year have […]
[…] From NoTricksZone: 7 New (2017) Papers Forecast Global Cooling, Another Little Ice Age Will Begin Soon […]
[…] there’s the small matter of the coming Little Ice Age, which seven new scientific papers published this year have […]
[…] there’s the small matter of the coming Little Ice Age, which seven new scientific papers published this year have […]
[…] publications warn that the planet may in fact be entering a period of global cooling. There were 7 such papers in 2017 […]
[…] was only a few day earlier that a new report from Kenneth Richard at NoTricksZone revealed a list of studies that are forecasting global […]
[…] was only a few day earlier that a new report from Kenneth Richard at NoTricksZone revealed a list of studies that are forecasting global […]
[…] was only a few day earlier that a new report from Kenneth Richard at NoTricksZone revealed a list of studies that are forecasting global […]
[…] was only a few day earlier that a new report from Kenneth Richard at NoTricksZone revealed a list of studies that are forecasting global […]
[…] che il pianeta potrebbe in effetti entrare in un periodo di raffreddamento globale. Solo nel 2017 sono stati pubblicati 7 documenti del […]
[…] validity being concluded. NASA: We May Be On the Verge of a "Mini-Maunder" Event 7 New (2017) Papers Forecast Global Cooling, Another Little Ice Age Will Begin Soon __________________ Bill N4GIX – Ham / WQWU626 – GMRS VV-898, TK-840(N), 2xTYT-7800, 2xUV5R v2+, […]
[…] global cooling have been published for decades. 13 recent studies and their abstracts are listed here. While the concept of rapid-onset glacial rebound is gaining traction, its potentially devastating […]
[…] global cooling have been published for decades. 13 recent studies and their abstracts are listed here. While the concept of rapid-onset glacial rebound is gaining traction, its potentially devastating […]
[…] publiées depuis des décennies. Treize récentes études et leurs résumés sont répertoriés ici. Alors que le concept de retour rapide à une ère glaciaire gagne du terrain, ses potentielles […]