On January 4 NTZ weekly contributor Kenneth Richard published a list of 485 papers dumping cold water on climate alarmism in 2017.
Looking through the list I find published papers showing that snowfall frequency has in fact increased over the the past 60 years!
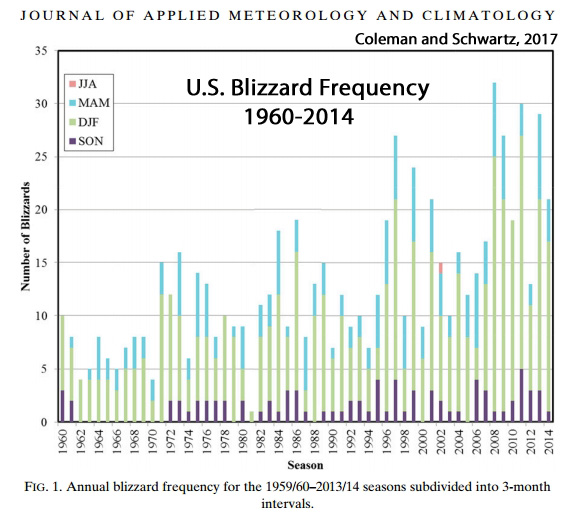
Blizzard activity jumps fourfold
For example a paper by Coleman and Schwartz, 2017 revealed 713 blizzards over the 55 years with 57 federal disaster declarations resulting. Of these 57 declared disasters, more than a half have occurred since the year 2000.
The published scientific study also founds that “seasonal blizzard frequencies displayed a distinct upward trend, with a more substantial rise over the past two decades”.
It adds that the modeled increase in blizzard activity showed a “nearly fourfold upsurge between the start and end of the study period at 5.9 and 21.6 blizzards, respectively”. If the trend continues, then we would need to expect even more such blizzards.
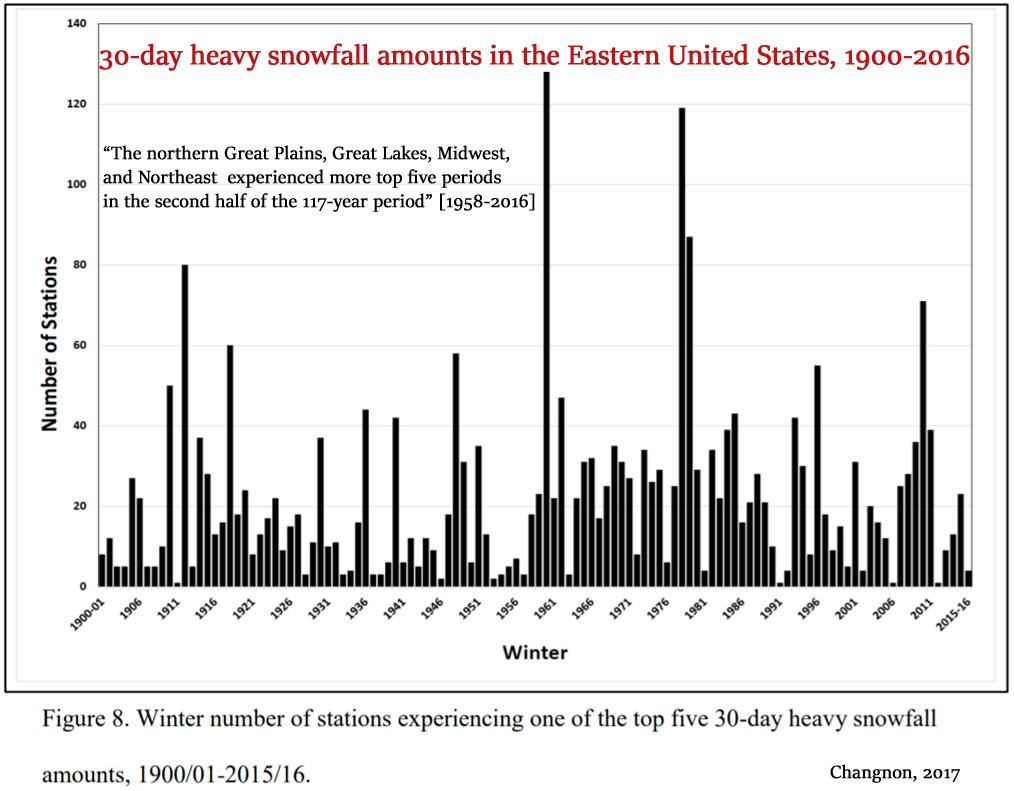
In a another publication, Changnon, 2017 evaluated heavy 30-day snowfall amounts east of the Rockies in the United States during the period 1900-2016. The comprehensive data assessment identified 507 stations in this long-term climate study.
The author examined the top 30-day heavy snowfall amount and the average of the top five 30-day heavy snowfall amounts. The findings also surprised global warming scientists who warned earlier that snowfall would become less frequent as the globe warmed. The publications abstract reads:
The northern Great Plains, Great Lakes, Midwest, and Northeast experienced more top five periods [more snow] in the second half of the 117-year period [1958-2016], where most of the southern states experienced top five periods throughout the study period.”
Finally a study conducted by Hatchett et al., 2017 found a “winter snow level rise in the northern Sierra Nevada from 2008 to 2017”. Sea surface temperatures offshore California were observed to be related to snow cover.


I’d like a reference of who exactly was surprised by this. Is that available?
A cold location would of course receive more snow with increasing humidity despite increasing temperatures. That seems to be pretty straight forward, doesn’t it?
A location that barely reaches temperatures low enough for snow (let’s say, has only a few days of snow per year), would stop experiencing snow with increasing temperatures. That seems pretty straight forward too.
So who was surprised?
♦ IPCC TAR (2001): “Milder winter temperatures will decrease heavy snowstorms”
♦ Kunkel et al., 2002: “Surface conditions favorable for heavy lake-effect snow decreased in frequency by 50% and 90% for the HadCM2 and CGCM1 [models], respectively, by the late 21st Century. This reduction [according to models] was due almost entirely to … an increase in average winter air temperatures.”
♦ IPCC AR4 (2007): “Snow season length and snow depth are very likely to decrease in most of North America”
♦ Kapnick and Delworth, 2013: “In response to idealized radiative forcing changes, both models produce similar global-scale responses in which global-mean temperature and total precipitation increase while snowfall decreases. … By using a simple multivariate model, temperature is shown to drive these trends by decreasing snowfall almost everywhere” (press release) “In North America, the greatest reductions in snowfall will occur along the northeast coast, in the mountainous west, and in the Pacific Northwest. Coastal regions from Virginia to Maine … will get less than half the amount of snow currently received.”
In October, 2016, Phil Mote authored a study predicting less Pacific Northwest snow because of more greenhouse gases. The ink was barely dry on the published study before the U.S. west coast began an amazingly snowy winter!
“10/31/2016
CORVALLIS, Ore. – The western-most region of the continental United States set records for low snowpack levels in 2015 and scientists, through a new study, point the finger at high temperatures, not the low precipitation characteristic of past “snow drought” years.
“The study suggests greenhouse gases were a major contributor to the high temperatures, which doesn’t bode well for the future, according to authors of a new study published today in the journal Geophysical Research Letters.
“In 2015, more than 80 percent of the snow measurement sites in the region – comprised of California, Oregon, Washington, western Nevada and western Idaho – experienced record low snowpack levels that were a result of much warmer-than-average temperatures. Most of the previous records were set in 1977, when there just wasn’t enough moisture to generate snow, according to Philip Mote, director of theOregon Climate Change Research Institute at Oregon State University and lead author on the study.”
http://oregonstate.edu/ua/ncs/archives/2016/oct/study-west-coast-record-low-snowpack-2015-influenced-high-temperatures
Kenneth, let’s not forget or leave out one of the “best” statements-with-certitude by a scientifically-illiterate politician, quoting supposedly “reasonable” (sic) “scientists” (sic):
“Any reasonable scientist will tell you that we’re going to rise anywhere between another two and three degrees in the next 30 years. That means that New Jersey’s climate is moving to Vermont in the next decade. That has tremendous implications in our economy’s ski, maple-sugar making, leaf-peeping and the list goes on and on. So we are — I at least am — looking at this with a major sense of panic.”
http://www.marketplace.org/2007/04/18/sustainability/when-theres-less-white-green-mountain-state
That’s from April 2007. Looking at April 2017, not only did skiing, sugaring, and leaf-peeping flourish and grow during that period, and not only did New Jersey’s climate most definitely NOT move north by the deadline… but Divine Providence even mocked this “prediction” just a few weeks prior to its final due-date:
“We had a storm total snowfall of 30.4 inches at BTV, making
this the greatest March snowstorm on record and the 2nd most
all-time (records date back to 1883). A daily record snowfall
of 17.8 inches was set at Burlington, VT on 3/14. This breaks the
old record of 10.0 inches set in 1980. Also, with 12.6 inches
on 3/15 we`ve broken our daily snowfall record for 3/15,
previous record was 4.1 set in 1940.”
How dare we rubes point out these 180-degrees-wrong “predictions” and how this invalidates the contention being offered!
“180-degrees-wrong “predictions””
No surprise what-so-ever.
Totally expected that AGW predictions/projections will turn out “not being representative of reality”.
Its not a bug, its a featured speciality.. 🙂
Ah, yes, Kenneth. They were wrong. BUT, did their being wrong “surprise” them? It never surprises the believers posting here. Why should it surprise those most invested in the scam?
My guess is they were no more surprised at being wrong than your resident activist is surprised. Perhaps annoyed at someone daring to expose them, and then being forced to come up with Rube Goldberg explanations for why they are always wrong. But “surprised?” No.
Maybe soon we’ll see a “peer reviewed” study showing that elevated CO2 causes scientists to make more errors? Then all they have to do is reference that paper and be done with it.
– IPCC TAR (2001): link doesn’t work
– Kunkel et al., 2002: is only about the change of conditions for snow at Lake Erie. Wasn’t there a record braking snow thing at the end of last year?
– IPCC AR4 (2007): Full quote would be
And has it happened? For the NH AR5 has this to say:
– Kapnick and Delworth, 2013: from their abstract
Doesn’t look like any of those was surprised …
“… at Lake Erie. Wasn’t there a record braking snow thing at the end of last year?”
The record snow fall was at the City of Erie.
The City’s airport is along the ancient shore of a glacial lake. Going south there is a rise. Usually, “lake effect snow” is a bit south of the Lake, on higher ground. Thus, the location was a bit odd.
For the entire Lake Erie shoreline, the big snowfalls vary in location. One year, at the Buffalo, NY Zoo there was so much snow the animals could walk out over the fences.
The National Weather Services at Buffalo developed a set of algorithms to predict lake effect snow. They call that BUFkit.
Wind direction and open water are key variables. Lk. Erie is the shallowest of the G.Ls. and is the first to freeze over. When close to fully ice covered, the lake effect snow ceases.
Almost every year, some location along this “north shore” gets a big dump of snow. It is, therefore, not unusual for a certain place to have a record.
Oh oh. It’s not just Tony Heller who’s calling out the govt fraudsters.
https://notalotofpeopleknowthat.wordpress.com/2018/01/25/new-yorks-temperature-record-massively-altered-by-noaa/
Anticipated response from resident troll – “that’s not true. just ask the government experts. they’ll tell you they aren’t lying.”
It’s true that data gets adjusted.
Well, the original data is obviously still available at least in the form of paper archieves available here:
https://www.ncdc.noaa.gov/IPS/cd/cd.html?_page=0&jsessionid=57FE13FE410E211238FBB4B3DF389ABA&state=NY&_target1=Next+%3E
Raw data and adjusted data is available here:
ftp://ftp.ncdc.noaa.gov/pub/data/ushcn/v2.5/
The software used to make these adjustments is also available on that FTP.
By design and adjustment, ClimDiv matches USCRN almost exactly.
TOO exactly (but your lack of mathematical comprehension would not allow you to see that.)
Up until the recent El Nino, USCRN showed NO WARMING since 2005 in the USA.
The temperature has almost dropped back down to the pre-El Nino level.
The problem, of course that the data is NCDC data, which is already RIFE with adjustments, infilling, estimates, and is generally not fit for any purpose.
NCDC are the “first cab off the rank”, the NOAA, GHCN, GISS et al, all have another go at “fixing” what is required to support the fairy-tale.
But its al a distraction, isn’t it.
Afterall, everyone knows that…
there is no empirical data showing that the slight and highly beneficial warming out of the COLDEST period in 10,000 years is ANYTHING BUT NATURAL.
There is NO EMPIRICAL SCIENCE showing that the rise of biosphere enhancing CO2 has any warming effect on oceans, atmosphere or ANYTHING
SebH applies logic to Greenland as well? He says ice shield must be growing. Glaciers will be growing as well.
All ice shields in subzero. Grow when more snow.
No?
The logic applies to any place. Of course more snow caused by humdity increase has higher temperatures melting snow/ice faster on the other side of the equation. Depends on location what dominates over the other when temperatures change.
SebH not precise. He makes argument sound like it suit both side. But reality only one side correct. If warming more moisture then more snow, then arctic melting more ice than making, means earth cooler not warmer.
SebH need think argument before write.
As others have pointed out, the Global Warming scientists were surprised as they predicted less snowfall. You are correct. More heat means more evaporation and so more moisture in the air that falls as snow or rain, depending. The problem with AGW is its inability to accurately predict. Good science leads to good prediction. AGW has been wrong so many times that it is clear that the theory of Global Warming is not a robust theory. It is an interesting theory but it is a failed theory.
Would it be possible for EVERYONE to resist the temptation to respond/reply to SebastianH.
The only reason he posts on this site is to distract everyone from discussing the actual merits of the post. If we all ignore him I am sure he will just go away.
I agree do not feed the paid troll.
Of course, if Pierre were to restrict his access, that would also help. Just saying.
That would certainly help. Let’s ban that one person that tries to break you out of your bubble, right? 😉
https://i0.wp.com/www.whaleoil.co.nz/wp-content/uploads/2016/09/3-monkeys-3.jpg?resize=300%2C194&ssl=1
So that’s what you think your posts are doing here? Honestly, all you’re doing is driving up the comment frequency because so many people here have seen what’s on the blogs and alarmist sites you link to before (i.e., nothing you write is news to us), and finally have someone who is willing to actually write about the positions those on your side take. As far as I’m concerned, you are aiding us (skeptics). You’re allowing us to expose the vacuousness of your side. Breaking us out of our bubble?! Please.
Well then, embrace that you have to show your best game and can’t rest on feeling superior and confirmation from your bubble friends.
So far, nothing you guys came up with comes even close to “support a skeptic position”. And by skeptic position I mean “there is no global warming, if there is it is not caused by human emissions and if that’s still no good as an argument, then I’ll try to convince you that it’s actually a good thing” … does that sum up the viewpoint of the majority of “skeptics”?
I have the distinct feeling that some of it is. The way you evade anything math related … maybe you’ve read about it before, but you didn’t quite understand it and made up your own version of what it could mean 😉
I am here because duty calls … can’t let people on the internet be wrong. If nobody tries, they’ll keep being wrong.
“can’t let people on the internet be wrong”
ROFLMAO.. you are a low class CLOWN for sure seb.
You are nearly ALWAYS demonstrably WRONG
You constantly needing correcting because your knowledge base is essentially NEGATIVE.
Everything you pretend to know is basically INCORRECT or NAIVE..
Your understanding of basic physics and science is that of a junior high student at best.
You are one evading the very basis of your wonky AGW religion, because YOU KNOW that you cannot support it.
No scientific proof that CO2 causes warming of oceans, atmosphere or anything.
No scientific proof that the highly beneficial warming out of the LIA has been ANYTHING BUT NATURAL.
Only one person living in a FANTASY BUBBLE here.
Its YOU seb.
Your continued ranting of brain-hosed AGW mantra is quite hilarious, and does immeasurable harm to the AGW “cause”.
You just lack the intelligence to realise that FACT.
Lol, I doubt I make any difference at all. Especially to any “AGW cause” (what should that be)?
However, what I learned about the behaviour of “skeptics” is that you’d imagine up anything just to not let reality be real. Sometimes it can’t be ridiculous enough and in those instances the stupidity of this “skeptic” thing shines through. You aren’t skeptic, you are just trying to confirm your conviction …
“Let reality be real”? We skeptics aren’t believers in your version of reality: that humans exert fundamental control over deep ocean heat content, glacier melt, sea level rise, hurricane intensities, species extinctions, drought, floods…just by emitting more CO2 or less CO2.
Probably unworthy of a response.
Oh look another seb FANTASY rant.
People look at your posts and think.. “are AGW sympathisers REALLY this naïve and ignorant”
Then you post again, and PROVE that you actually are.
That’s the whole point, you aren’t believing in any reality. For you reality is all made up and you build your own little imaginary world with imaginary physics and imaginary conspiracies. Repeating chants like “global warming does not exist”, “if it exists isn’t caused by humans and not bad at all”, etc …
Anything that you can interpret as being anti-AGW is automatically good without questioning its merrits, everything AGW is automatically fake. That is not what “being skeptic” means, that’s called “being in denial”.
“you aren’t believing in any reality”
ROFLMAO.
You are living in a MAKE-BELIEVE fantasy world that has infected your tiny little mind.
You live in rampant DENIAL of REALITY.
Face the REALITY that there is NO EMPIRICAL SCIENCE showing enhanced atmospheric CO2 warms oceans, atmosphere or anything.
I DARE you admit this FACT…
Take that first tiny step forward into the light….. can you ?
https://www.weatherbell.com/
Todays daily, worth a watch(20/2/18)
Thx.
Also, here’s another “easily refuted” Tony Heller expose on data tampering for everyone to enjoy.
https://realclimatescience.com/2017/08/100-of-us-warming-is-fake/
It’s fascinating how much effort the activist chatbot troll goes to in order to distract from the fact that govt fraudsters are weighing the final results in favor of warming by using data for areas in which there are no thermometers. If making up data is no longer fraud, then science has changed drastically since I went to college.
“If making up data is … “
Our resident trollette makes up science and fizzics as he goes along.
… why should FABRICATED data be of any concern to him.
Precisely!
And how does one adjust fabricated data, anyway? He’s got Chutzpah, that’s for sure. Not smart enough to not be caught, though.
Note that he did EXACTLY what I said he might, and used them as self-corroborating witnesses.
https://notrickszone.com/2018/02/20/us-blizzards-snowfalls-have-increased-since1950s-surprising-global-warming-climatologists/comment-page-1/#comment-1252883
He’s getting so predictable.
Another Tony Heller video contrasting NOAA’s “theory” with historical facts. Who you gonna believe? I’ll take history for a thousand, Alex.
Talking about predictable, you can’t be bothered with analyzing what is wrong with the actual algorithms instead you believe some blogger with a loud mouth.
Way to go Mr. skeptic.
Is he actually calling the raw dataset the real temperatures? How bad can it get? Sorry yonason, you believe whatever you want, just don’t expect others to not view you as a blind follower of some amateur blogger. I bet you are into some other conspiracy theories too. Was 9/11 an inside job? Are you a fan of Alex Jones? Watching Fox News? Believe in contrails? Moon landing was faked? Vaccines cause autism? Anything rang a bell?
Have fun in your bubble.
“the raw dataset the real temperatures? ”
ROFLMAO..
So the raw data isn’t REAL ?
You really live in a misfit fantasy world , don’t you seb. !!
And seriously seb.. you seem to know ALL the conspiracy theories off by heart.
No-one here mentions them except you.
Sebastian, dishonest as usual since Tony make clear in the charts for RAW data to ADJUSTED data.
Since Seb, has no point to make he is deflecting instead with “conspiracy” claim which Tony himself didn’t make. He is calling them fake and fraud openly.
“Zeke and Nick and all the other apologists for NOAA data tampering claim that adjustments to US temperature are due to Time Of Observation Bias or some other sciencey sounding reason, But the reality is that the data is simply fake.”
and,
“In other words, the fraud is intentional. But I’m not done yet. The fraud is worse than it seems (if that is possible.) Almost 50% of USHCN adjusted data is now fake, but they have only lost 25% of their data. So they are throwing out a large percentage of their measured data.”
Nothing about a conspiracy at all.
It is clear that Sebastian fails to see the obvious tampering since the adjustment curve is soaring rapidly.
The reason SebastianH calls it a dreamed-up conspiracy is that he has nothing to offer as a defense of adjustments that (a) only go in one direction, (b) serve an agenda of warming the present and cooling the past, and (c) are consistent with the conversations in the Climategate e-mails about changing the data (that are “mostly made up”) to “hide the decline” and “remove the 1940 blip”. But instead of offering a substantive defense, all he has to do is name-call (“Conspiracy Theorist!”) in an attempt to marginalize.
By the way Sebastian, did you read any of the comments in the link YOU provided?
Here is one where a reader decided to check on Tony’s claim,
https://realclimatescience.com/2017/08/100-of-us-warming-is-fake/#comment-61508
I dare you to go read it.
This is getting really weird. Sunsettommy:
Oh sorry, did I hurt your feelings? Why are you following this guy?
You obviously don’t know what conspiracy theories are and how to recognize them. If I would say openly that the NASA didn’t land on the Moon in the 1960s, then I would be a conspiracy theorist. If I would say that the temperature data (or rather the adjustments) are fake and fraud, manipulated by “them”, then I would be a conspiracy theorist. What’s open, is the algorithm and methods used to adjust the data. And then there is this little thing called other nation’s climate and weather-related organizations. But of course, they fake their data as well and probably coordinate with NOAA. Right?
How is that not conspiracy theorist vodoo?
Please, would any one of you just go an analyse the methods themselve instead of repeating what some loud clowns are saying? Or is that too complicated? It’s definetely easier to just say it’s fake. It’s probably also fake that we can split the atom … all those nuclear reactors work by magic. Computing with quantum states is also fake, isn’t it? Can’t understand what’s going on, so fake fake fake. This is how you all sound to us outside in the normal world. Accept it and improve upon your strategy.
You really got to be kidding me right now. Nobody is saying that the data isn’t adjusted, sunsettommy. I am now waiting for a hidden camera and a guy telling me this is all a joke …
Kenneth:
a) adjustments for SST go in the other direction, should I now scream that it’s fake because NOAA makes it look like the warming in the past wasn’t as dramatic as I feel it must have been? Or do skeptics exploit this too and claim that NOAA is hiding past warming that was so much more dramatic than current warming?
b) sure, and every other organization providing adjustments is in on that agenda, right? All of them against you, the righteous ones. How is that not conspiracy thinking?
c) that is definetly the conspiracy olymp Kenneth. I’d link to what those e-mails really were about which is consistent, but you’d ignore it anyway as made up, apologistic or something like that. Whatever conspiracy theorists do …
That’s the problem with you guys. You imagine something up and then you expect others to defend or prove that what you said is wrong, otherwise it must be correct. It doesn’t work that way and I guess everyone who had a lengthy exposure to the nonsense on these kind of blogs has given up hope that you’ll ever come back from whereever you got lost.
To say it with sunsettommy’s logic, when you say something openly it’s real. So calling you guys conspiracy theorists is a open as it gets … must be real then 😉
1. Explain what it was these dataset overseers were doing when they were talking about “correcting” the 1940s warming by “deliberately” removing 0.15 C from the SSTs to make it “significant for the global mean” via with “my [Tom Wigley’s] adjustment”. Why should skeptics like us assume that something shady was not going on here…especially since removing warming from the past is EXACTLY what has been done to the instrumental record. An entire -0.5 C has been removed from the 1880 to 1950 warming!
—-
http://di2.nu/foia/1254108338.txt
Here are some speculations on correcting SSTs to partly explain the 1940s warming blip.
If you look at the attached plot you will see that theland also shows the 1940s blip (as I’m sure you know).
So, if we could reduce the ocean blip by, say, 0.15 degC, then this would be significant for the global mean — but we’d still have to explain the land blip.
I’ve chosen 0.15 here deliberately. … My 0.15 adjustment leaves things consistent with this, so you can see where I am coming from.
——-
2. Explain what Phil Jones meant when he admitted that sea surface temperatures in the SH are “mostly made up” in the HadSST data.
——-
3. Explain in your own words (i.e., don’t just post another link to the pro-alarmist RationalWiki blog that extols Michael Mann and maintains a smear list of “climate deniers”) what the scientists were talking about when saying they needed to HIDE the fact that they were changing the data that showed too much cooling after the 1960s. Why was “‘correcting’ for the decline” put in quotes? Why did they write that these “corrections” “may not be defensible!”? Why would their correcting for the decline not be defensible, SebastianH? Why did they admit that their adjustments were “completely artificial”? If they’re completely artificial (i.e., fake), in what way do you nonetheless think they’re real?
—-
“…you really ought to replace the values from 1961 onwards with observed [instrumental] temperatures due to the decline.”
“I’ve just completed Mike’s Nature trick of adding in the real temps to each series for the last 20 years (ie from 1981 onwards) amd from 1961 for Keith’s to hide the decline.”
“Also we have applied a completely artificial adjustment to the data after 1960, so they look closer to observed temperatures than the tree-ring data actually were” … “Also, we set all post-1960 values to missing in the MXD data set (due to decline), and the method will infill these, estimating them from the real temperatures – another way of ‘correcting’ for the decline, though may be not defensible!”
The instrumental records are stricken with artificial warming biases of 0.1 to 0.4 C per decade.
—-
https://link.springer.com/article/10.1007%2FBF00140159?LI=true
“Karl et al. (1988) has shown that at some ‘sun belt’ cities in the West, the rise of temperature that can be attributed to the urban heat island is as much as 0.3 to 0.4°C per decade. In the East, the rise is over 0.1°C per decade. … The artificial warming in the primary station network, relative to the climate division data, is nearly 0.17°C over the past 34 years [since ~1950]. Such trends are at least as large as any of the observed trends over the United States (Karl, 1988) or the globe (Jones and Wigley, 1987).”
—
According to large volumes of proxy evidence from the NH there was little to no warming — even cooling — between the 1980s and 2000s. Hence the need to hide the decline. This is referred to as the “divergence problem”, and it’s why Moberg et al. (2005) inserted instrumental data from 1980 to 2000 rather than continue using the proxy evidence. That way they could make the record show an abrupt warming occurred after 1980 rather than going with the proxy evidence that showed no warming or cooling during this time. In other words, when cooling is shown, “a completely artificial adjustment” is inserted so as to “hide the decline” in temperatures.
4. Do you believe the 1,000 years ago to 1960 tree ring data are accurate? Yes or no? If no, how do you know that modern warming rates are “unprecedented” or hockey-stick shaped? If yes, why did the data suddenly become inaccurate after 1960 such that it had to be removed and then hidden so as to correct for the declining temperatures?
Let’s see if you substantively answer any or all of these sets of questions…or if you will do what you usually do and just respond by calling us names (“Conspiracy Theorists!”) for daring to question the authenticity of the instrumental record. I’m guessing you’ll do the latter.
–
–387 NH proxies (cooling after the 1960s through the late 1990s)
https://notrickszone.com/wp-content/uploads/2017/08/Holocene-Cooling-Northern-Hemisphere-Briffa-2002-Divergence.jpg
–
126 NH proxies (cooling from the 1980s to 2000): https://notrickszone.com/wp-content/uploads/2017/08/Holocene-Cooling-Northern-Hemisphere-Xing-2016-Tree-Rings.jpg
–
66 NH proxies (cooling from the 1980s to 2000): https://notrickszone.com/wp-content/uploads/2017/08/Holocene-Cooling-Northern-Hemisphere-DArrigo-2006.jpg
–
15 NH proxies (no warming from the 1980s to 2000): https://notrickszone.com/wp-content/uploads/2017/08/Holocene-Cooling-Northern-Hemisphere-Schneider-2015-Wilson-2016.jpg
“Also we have applied a completely artificial adjustment to the data after 1960 […] another way of ‘correcting’ for the decline, though may be not defensible!”
If an adjustment is “completely artificial” and used to ‘correct’ [quotes theirs] for the cooling temperatures, does that sound like the “completely artificial” “corrected” temperatures are the real temperatures, SebastianH? At what point does “completely artificial” data get transformed into real data?
ROFLMAO..
NO-ONE is mentioning conspiracy theories EXCEPT YOU, seb
They are YOUR speciality.
You are just using the “words” as another one of your child-minded DISTRACTIONS from the REALITY that you CANNOT support the very basis of your scam AGW religion.
So very PATHETIC. !!
So very seb !!
Seb.. look up the words COLLUSION and FRAUD.
Then you might understand!
But probably not, because both are a totally acceptable part of your very existence and you are mindless about them.
Sebastian, goes full dishonest here since he NEVER points WHY he thinks it is a conspiracy:
“You obviously don’t know what conspiracy theories are and how to recognize them. If I would say openly that the NASA didn’t land on the Moon in the 1960s, then I would be a conspiracy theorist. If I would say that the temperature data (or rather the adjustments) are fake and fraud, manipulated by “them”, then I would be a conspiracy theorist. What’s open, is the algorithm and methods used to adjust the data. And then there is this little thing called other nation’s climate and weather-related organizations. But of course, they fake their data as well and probably coordinate with NOAA. Right?:
Tony went into some detail using ONLY NOAA data to show the obvious distortions. You ignore it completely because you have no counterpoint to it.
You think his data based criticism of made up data and unsubstantiated adjustments is a conspiracy when it is really an expose of what is going on. He lays it out for anyone to make a critical examination, while people like you run off at the mouth with baloney over it.
Your conspiracy claim is stupid because he never said it was a conspiracy, he said it was FAKE and FRAUD.
https://realclimatescience.com/wp-content/uploads/2017/08/MeasuredVsEstimatedMaximumTemperatureSince1990ForEachUSHCNStation_shadow.png
To remind you of what Tony stated,
“Zeke and Nick and all the other apologists for NOAA data tampering claim that adjustments to US temperature are due to Time Of Observation Bias or some other sciencey sounding reason, But the reality is that the data is simply fake.”
and,
“In other words, the fraud is intentional. But I’m not done yet. The fraud is worse than it seems (if that is possible.) Almost 50% of USHCN adjusted data is now fake, but they have only lost 25% of their data. So they are throwing out a large percentage of their measured data.”
The commenter did something you will NEVER do is check Tony’s claim, only to discover that Tony made an honest presentation based on the NOAA data.
I think you have serious brain problems when you try so hard to promote a DEFLECTION to what Tony states in his blog.
Just a short reply, maybe I’ll find time to do your homework later on …
Your perception of this “incident” is entirely due to your conviction that they did something wrong.
Anyway, treering proxy data is unreliable as has been shown by various studies. Amount of light also plays a role in determining the size of rings. It’s known that a global dimming occured and that is what’s likely causing the decline and deviation in the proxy data after 1960. I don’t really get why you insist that this is the “real” temperature and replacing it with the instrumental record is “faking it”.
sunsettommy,
you and Tony Heller should definetly get a room. Also, why do you think that showing the adjustments (the diff between raw and adjusted data) is something that I or anyone is refuting? Yes, those are the adjustments. They exist. They are real. NOAA is performing them (and other organizations obviously too). You are barking at the wrong tree.
That doesn’t make adjustments fake. Finding something in the methods/algorithms that is wrong, that would make those adjustments fake. Nobody on the skeptic side is attempting to do that, because it means work and needs some kind of understanding of the matter. Instead you listen to loud clowns and believe and spread their nonsense.
Shocking! SebastianH has avoided answering every single one of my questions. He claims we’re “conspiracy theorists” for questioning the realness of the “completely artificial” corrected data and “mostly made up” data inserted into the temperature records (as admitted by the dataset overseers themselves), and he refuses to explain why these “completely artificial” corrections to the cooling temperatures and “mostly made up” data needed to be hidden or why they “might not be defensible”, and yet he pleads for us to believe that he just doesn’t understand why we are suspicious of the accuracy of the instrumental record. This has to be one of his more dishonest posts. He just doesn’t understand why we don’t just believe in the integrity of people like Michael Mann and Tom Wigley.
So then you would agree that not only is Michael Mann’s 1998/9 hockey stick graph of the entire Northern Hemisphere (extrapolated from 2 trees from North America) and featured by the IPCC TAR unreliable, so are all the reconstructions that use tree ring data, including Marcott et al., 2013…
—
http://www.comments.sciencemag.org/content/10.1126/science.1228026
What Marcott has produced for us is a climatic history of the Holocene based upon tree-ring proxies.
1. The proxy data in the accompanying Excel file show no dramatic increase in the 20th century. This can easily be checked simply by plotting the supplied data. 2. Figures S5 and S6 show no recent upturn at all. 3. The Phd thesis of the first author uses the same data sets and plots similar graphs, but with no trace of any sharp increase. This earlier contradictory work is not cited in the paper.
—
In other words, you have just destroyed any claim that modern temperatures are “the highest on record” or higher than they were during the LIA or anything close to unprecedented. If the post-1960s tree-ring data are wrong, then the pre-1960s data used by hockey-stick-makers are wrong too. Or would you have the intellectual dishonesty to claim that the pre-1960s data are right, but then suddenly become wrong in 1961? I wouldn’t put it past you.
New paper finds bristlecone pines (used for Mann’s hockey stick) grow at significantly different rates & often not related to temperature
A paper published today in Environmental Research Letters has very important implications for tree-ring paleoclimate research [dendrochronology], including Michael Mann’s debunked hockey sticks. The paper finds that growth of bristlecone pines varies significantly depending on altitude, and also depending on whether the trees are located on the North or South side of a mountain. According to the authors, such differences are often not temperature-related and thus could contaminate tree-ring datasets for which the false assumption is made that tree-rings accurately reconstruct temperature variations.
Michael Mann’s hockey stick is perhaps the most thoroughly debunked “icon” in the history of science, but this paper demonstrates even more reasons why his hockey stick cannot be relied upon.
“Just a short reply, “ Says seb , and then rants DESPERATELY and AILESSLY and INCOHERENTLY with zero scientific content….
A 5 year old’s tantrum in a supermarket would have more substance.
TOTALLY EMPTY …
.. and YET AGAIN avoiding the FACT that he has ABSOLUTELY ZERO EVIDENCE of CO2 warming oceans, atmosphere or anything
Just keep the EMPTY ZERO-SCIENCE rants , seb.
Its HILARIOUS. 🙂
This is getting dumb Kenneth. I specifically said I would maybe do your homework later on.
I don’t understand a lot about you guys. But you are never stopping to amaze me with what nonsense you can come up with to justify your conviction that “they” are faking it.
What are you even talking about?
See, that is what I mean. You see everything the way you want to, not even putting an effort in to try and understand what others are saying.
Here is a 2008 paper about the accuracy of tree ring proxy data that got cited hundreds of times. I thought this is common knowledge, but apparently skeptics blend out what doesn’t fit …
http://citeseerx.ist.psu.edu/viewdoc/download?doi=10.1.1.167.728&rep=rep1&type=pdf
The illusion is strong with you … I wonder what it takes to convince yourself that this is true. Come on, post more quotes that “prove” it 😉 As if that helps.
Yawn,
yet another empty seb, attention-seeking load on brain-hosed NON-science.
Basically all that paper says is to “ignore” any data you don’t like. !!
Seb FAILS yet again. !!
Oops, here’s the video.
https://m.youtube.com/watch?v=T86IIKK9FRg
OT but Jonova has a very interesting graph showing the effect of “renewables” on electricity prices.
http://joannenova.com.au/2018/02/electricity-prices-fell-for-forty-years-in-australia-then-renewables-came/
The first graph had me wondering what definition was used for ‘blizzard’, as here in the UK, anything more than a single fluttering snowflake is routinely described as such.
For those who don’t already know, the answer seems to be:
“To be a blizzard, a snow storm must have sustained winds or frequent gusts that are greater than or equal to 56 km/h (35 mph) with blowing or drifting snow which reduces visibility to 400 m or 0.25 mi or less and must last for a prolonged period of time—typically three hours or more.”
https://infogalactic.com/info/Blizzard
Reading Sebastian’s comments here shows that he has nothing to counter the post at all, just the usual refusal to be honest on the topic.
You never did see these for what it is:
“♦ IPCC TAR (2001): “Milder winter temperatures will decrease heavy snowstorms”
“♦ IPCC AR4 (2007): “Snow season length and snow depth are very likely to decrease in most of North America”
Reality is the very opposite, which is why you ignore what the IPCC said. The post make clear there is INCREASING snow and blizzards since 2001.
https://climate.rutgers.edu/snowcover/chart_seasonal.php?ui_set=nhland&ui_season=1
Carry on……..
Sebastian, show evidence of groupthink:
“A group of people come to share a particular view or belief without a proper appraisal of the evidence.
This leads them to insist that their belief is shared by a ‘consensus’ of all rightminded opinion.
Because their belief is ultimately only subjective, resting on shaky foundations, they then defend it only by displaying an irrational, dismissive hostility towards anyone daring to question it.”
He already ignored the IPCC snow projections FAILURE, by making bizarre claim that it was only for a region as he says here:
“IPCC TAR (2001): link doesn’t work
– Kunkel et al., 2002: is only about the change of conditions for snow at Lake Erie. Wasn’t there a record braking snow thing at the end of last year?
– IPCC AR4 (2007): Full quote would be
Snow season length and snow depth are very likely to decrease in most of North America, except in the northernmost part of Canada where maximum snow depth is likely to increase.”
NORTH AMERICA is a lot larger than a regional area.
A simply check on Google has this,
https://www.google.com/search?source=hp&ei=faONWpa1DIPAtQXu_Z-AAQ&q=North+Canada+record+snowfall+and+cold%3F&oq=North+Canada+record+snowfall+and+cold%3F&gs_l=psy-ab.12..33i160k1l2.1462.17496.0.22750.40.38.2.0.0.0.176.4736.0j36.36.0….0…1.1.64.psy-ab..2.33.4090…0j0i131k1j0i22i30k1j0i22i10i30k1j0i8i13i30k1j33i22i29i30k1.0.71UD2XV3aE4
also at Not by Fire but Ice blog,
Record snowfall in Windsor, Ontario
https://www.iceagenow.info/record-snowfall-windsor-ontario-2/
New snowfall record for Calgary, Alberta
https://www.iceagenow.info/new-snowfall-record-calgary-alberta/#more-24600
Record snowfall in British Columbia
https://www.iceagenow.info/record-snowfall-british-columbia-3/#more-24593
Grande Prairie Alberta nearly doubles snowfall record
https://www.iceagenow.info/grande-prairie-alberta-nearly-doubles-snowfall-record/#more-24481
That was just the last 3 weeks. A year earlier was just as was bad too.
There are many more covering Northern HEMISPHERE widespread record cold and snow reports here,
https://www.iceagenow.info/
You are that silly, you are that far off the mark, Sebastian. You will fight it because you are a lost boy on this, since you prefer belief over evidence.
“It doesn’t matter how beautiful your theory is, it doesn’t matter how smart you are. If it doesn’t agree with experiment, it’s wrong. ”
Richard Feyman
The experiments here are the weather.The theory is the predicted climate.
When I took chemistry, physics, and EE courses in college you did *not* manipulate data. You recorded your data and you analyzed it as it is.
If some of your sensors don’t match then, in a series of measurements, the trends in the measurements will *still* show up. If one meter shows 1 volt at time t0 and then 2 volts at time t1 while another meter shows 1.5 volt at time t0 and 2.5 volt at time t1 then they both show an increase of 1 volt. It would be a violation of scientific principles to “manipulate” the data so they both show identical readings since you can’t be sure which one is correct, especially if they are located remotely and not available for calibration — exactly like most of the thermometers used in the land/sea record.
Temperature *differences* are what we see as an output of the climate models. That difference is supposed to be an increase/decrease in the average global temperature. If you are taking an average in order to determine the difference then there is absolutely *no* reason to manipulate the data in any manner.
Even the claim that temperatures are going up is misleading. Only the average is going up. The average can go up because of higher temperatures, i.e. the earth is going to burn up, or it can go up because of more days of moderate heat, i.e. longer growing seasons.
The global warming alarmists want us to believe the earth is going to turn into a cinder and cite the increasing average temperature as proof – BUT IT ISN’T PROOF. Longer growing seasons around the globe are beneficial, not destructive. And the increasing global harvests of grains like wheat and rice over the past five years refute the claim that the earth is turning into a cinder. It supports the claim that we are seeing the average temperature going up because of longer growing seasons.
I have yet to see a *any* global warming paper try to analyze temperature data to actually give absolute temperatures instead of average temperature differences. Why is that?
How refreshing. Someone else from the old-school, where doctoring data could get you an “F” and a permanent reputation as untrustworthy.