Two days ago Kenneth presented an impressive flurry of scientific, peer-reviewed charts published over the past 15 months (46 alone in 2018). Much to the surprise of alarmist scientists, global warming is weak at best.
Lack of warming a global phenomenon
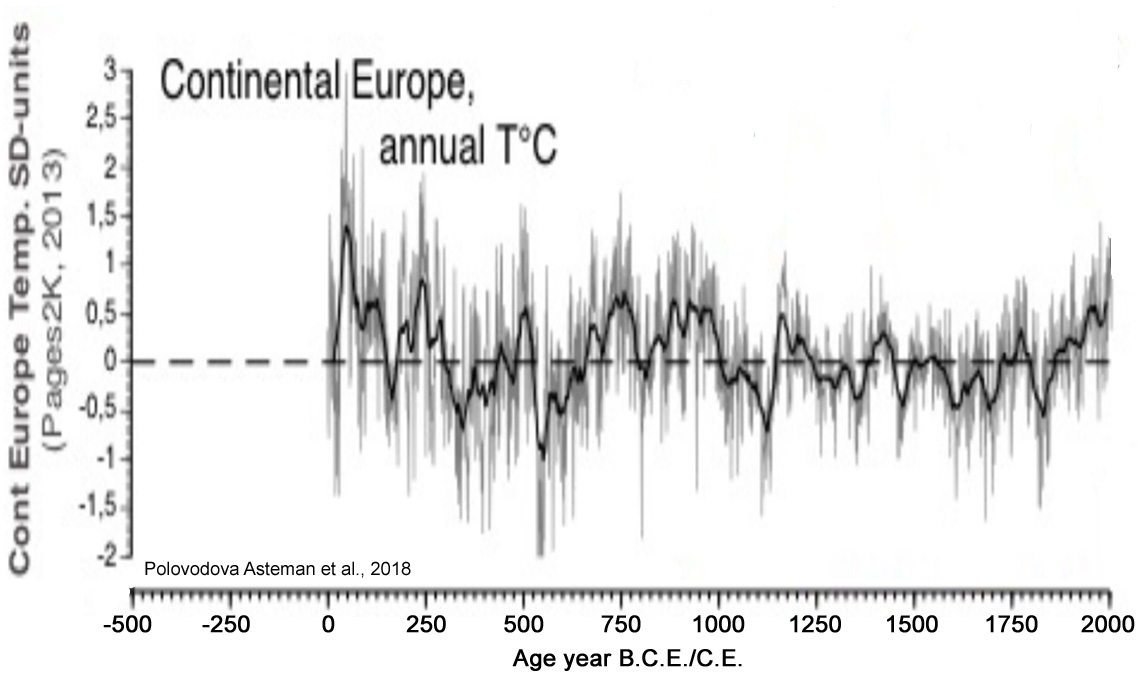
According to Kenneth, these new papers show that “nothing climatically unusual is happening”. For example a publication by Polovodova Asteman et al shows that continental Europe’s temperatures are lower today than they were on other occasions over the past 2000 years:

Source: Polovodova Asteman et al
Today’s warming doesn’t stand out
The authors write that the contemporary warming of the 20th century “does not stand out in the 2500-year perspective” and is “of the same magnitude as the Roman Warm Period and the Medieval Climate Anomaly.”
A number of strident global warming scientists prefer to dismiss the significance of Europe’s temperature record, claiming that it is local in nature and does not tell us what is really happening globally. However, other papers fully contradict this. For example, a paper by Wündsch et al., 2018 shows us that the warming today in South Africa also is nothing unusual.
It’s global, stupid
Temperature reconstructions show the same is true in Southeast Australia, according to McGowan et al., 2018, Northern Alaska (Hanna et al., 2018), the Tibetan Plateau (Li et al., 2018), South Korea (Song et al., 2018), Antarctica (Mikis, 2018), to cite just a few among dozens of others.
“Warming holes” surprise scientists
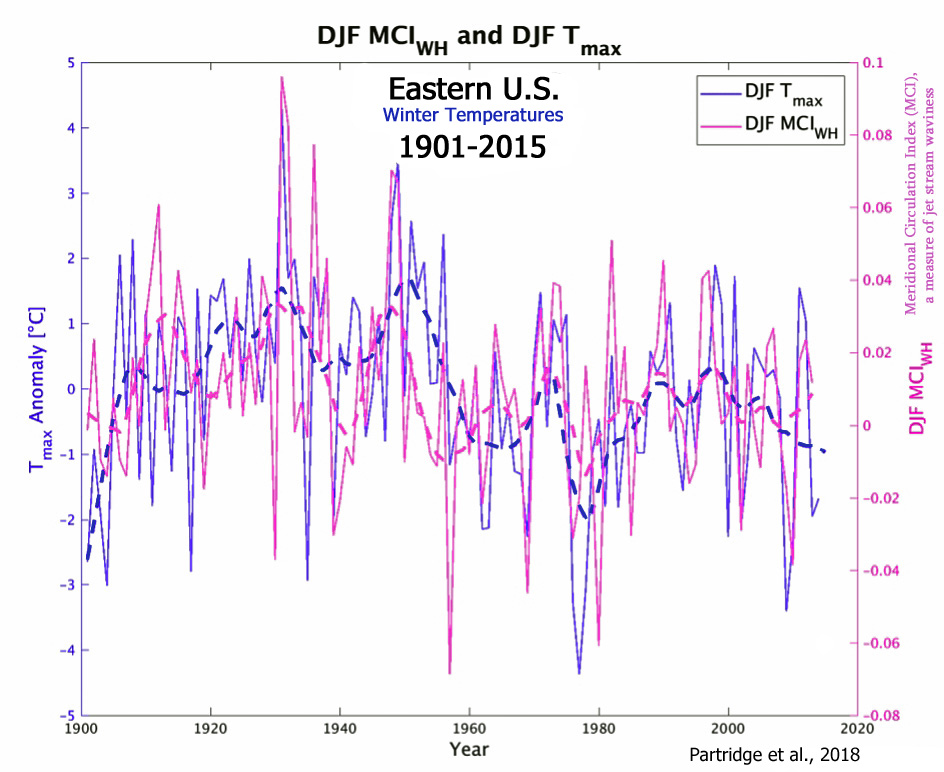
Meanwhile new findings by Partridge et al., 2018 show in fact that other regions have cooled. The eastern US “annual maximum and minimum temperatures decreased by 0.46°C and 0.83°C respectively.”
The surprising winter cooling has led scientists to dub the eastern US a “warming hole”, where scientists blame oceanic cycles for the unexpected cooling.

Greenland within normal, cooler than 1930s
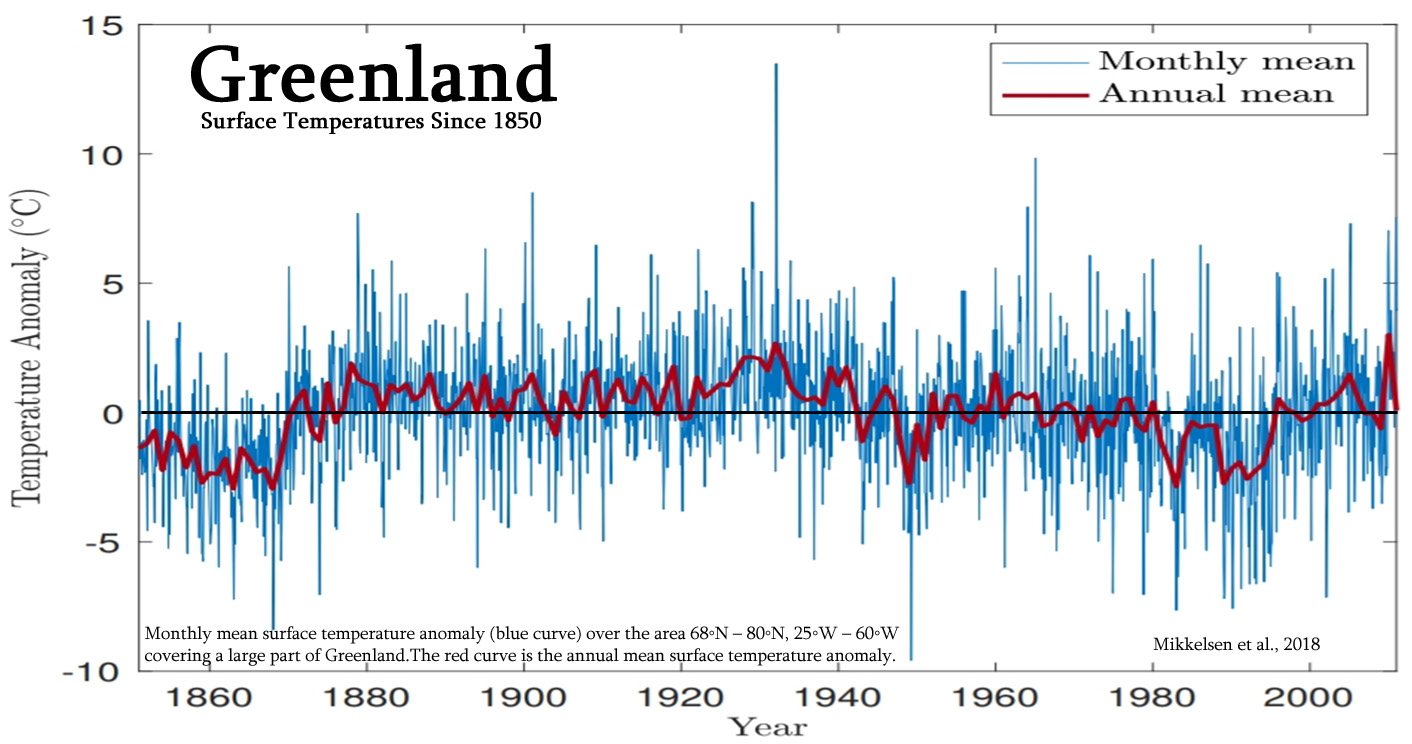
Greenland often gets cited by alarmists as a climate canary in a coal mine due to its massive ice sheets and their potential to cause dramatic sea level rise should they melt. But a brand new study by Mikkelsen et al., 2018 shows that surface temperatures going back over 150 years are lower than they were in the 1930s!

Source: Mikkelsen et al., 2018, Figure 2. Surface temperature anomalies obtained from (KNMI), “Twentieth Century Reanalysis V2c” from the years 1851 to 2011 in a box spanning 68N to 80N and 25W to 60W.
Looking at the above Greenland surface temperature chart, we see that the mercury plummeted some 5°C from 1930s to the 1980s before thankfully rebounding in the 1990s and 2000s. Here as well there exist no signs for warming alarm.
Greenland cooling again since 2000
Furthermore, much to the surprise of global warming scientists, Greenland temperatures have again been falling since 2000. Westergaard-Nielsen et al., 2018 examined the most recent and detailed trends based on MODIS (2001–2015) and concluded that if there is any general trend for Greenland it is “mostly cooling”.
South Pole cooling, getting icier
At the other end of the planet at the South Pole, new findings by Cerrone and Fusco, 2018 confirm the large increase in the southern hemisphere sea ice and suggest it “arises from the impact of climate modes and their long-term trends”.
They write that the results indicate a progressive cooling has affected the year-to-year climate of the sub-Antarctic since the 1990s and that the SIC [sea ice concentration] shows upward annual, spring, and summer trends.


Tales from the hockey schtick crypt.
https://www.rossmckitrick.com/paleoclimatehockey-stick.html
Half truths and distortions, much like Monkton’s assertions above.
For example the poor r-squared (r2) statistic is frequently floated as evidence of something or other. Bishop Hill made much of it in his comedy essay on the topic.
But r2 is an idiotic metric to apply to this type of exercise, low r2 values are associated with year to year variability which is not really what is being looked for, rather you want a statistic that works at capturing the general level. The RE score does that and demonstrates that there is skill. The NAS panel were very clear about this, and still it gets raised as some kind of ‘gotcha’, and Mann accused of hiding the number, when he probably never even calculated it.
” However, r2 measures how well some linear function of the predictions matches the data, not how well the predictions themselves perform. The coefficients in that linear function cannot be calculated without knowing the values being predicted, so it is not in itself a useful indication of merit. ”
NAS Panel report Page 96
https://www.nap.edu/read/11676/chapter/1
[…] Over 40 scientific papers on the global warming hoax have been published in just the first three months of 2018. What their charts show is that “nothing climatically unusual is happening.“ […]
[…] https://notrickszone.com/2018/03/25/alarmism-takes-a-big-hit-flood-of-new-scientific-findings-show-no… […]
[…] presenter was Oxford physicist Myles Allen. He has long been itching to see oil majors sued, telling the BBC in […]
“It’s clear that over 60% of the Holocene was as warm or warmer than it is today”
That’s probably an overestimate, but I’ve never claimed the planet has never been this warm for all time. The Hockey Stick (MBH99), however, only went back to AD1000.
More likely a large UNDER-estimate
Using non-tree-ring proxies and avoiding Mannian-type data corruption, we get a more REALISTIC reconstruction that actually matches historical records
https://s19.postimg.org/lomprmi3n/lanser_holocene_figure11.png
We see that it was only colder than now for some 500 or so years.
We know the previous parts of the Holocene were WARMER still
So basic maths 500 years out of 10,000 years is 5%
So its been warmer than now for some 90-95% of the current interglacial
The LIA really was an ANOMALOUSLY COLD period.. why to AGW sicko-phants think it should be “the norm”????
We are still only just a tiny bump above that COLDEST of periods, and NOWHERE NEAR the Holocene average.
Unfortunately, it looks like the RECOVERY from that bleakest of periods has probably come to an end.
Let’s all hope like crazy for WARMING rather than COOLING !
Its ONLY NATURAL. !
“It’s clear that over 60% of the Holocene was as warm or warmer than it is today”
Here are just 7 graphs of Holocene temperature out of the hundreds available. None of them show anything unusual as far as a recent uptick. Your Marcott Dream is supportable only with fakery.
Pacific Ocean
https://notrickszone.com/wp-content/uploads/2016/12/Holocene-Cooling-Western-Pacific-Warm-Pool-OHC-2.jpg
Equatorial Atlantic
https://notrickszone.com/wp-content/uploads/2017/01/Holocene-Cooling-Equatorial-Atlantic-SST-Rosenthal-17.jpg
North Atlantic
https://notrickszone.com/wp-content/uploads/2016/12/Holocene-Cooling-Irminger-Sea-North-Atlantic-de-Jong-16.jpg
Antarctica
“[N]o continent-scale warming of Antarctic temperature is evident in the last century.”
https://notrickszone.com/wp-content/uploads/2017/03/Holocene-Cooling-Antarctic-Stenni-17-East-West-Whole-Antarctica.jpg
Greenland
https://notrickszone.com/wp-content/uploads/2017/07/Holocene-Cooling-Greenland-Kobashi-2017.jpg
“Greenland temperature reached the Holocene thermal maximum with the warmest decades occurring during the Holocene (2.9 °C warmer than the recent decades) at 7960 ± 30 years B.P.”
Southernmost South America
“During the last 4000 years, particularly low [sea surface temperature] values occur at 3500-3300 cal yr BP and during the most recent decades”
https://notrickszone.com/wp-content/uploads/2017/11/Holocene-Cooling-Patagonia-Southernmost-South-America-Bertrand-2017.jpg
Northern Hemisphere
https://notrickszone.com/wp-content/uploads/2017/06/Holocene-Cooling-Northern-Hemisphere-Ljungqvist-2010-Wilson-2016.jpg
[…] 4) Flood Of New Scientific Papers Show Surprising Results No Tricks Zone, 25 March 2018 […]
[…] What their charts clearly show is that “nothing climatically unusual is happening.” […]
[…] Oltre 40 articoli scientifici contro la bufala del riscaldamento globale sono stati pubblicati solo nei primi tre mesi del 2018. Quello che mostrano i loro grafici è che “non sta accadendo nulla di insolito al clima.“ […]
[…] presenter was Oxford physicist Myles Allen. He has long been itching to see oil majors sued, telling the BBC in […]
We need look no further than Al Gore’s An Inconvenient Truth to know belief in human-caused, dangerous warming is based on lies. The film’s “strongest proof” that CO2 drives temperatures was a graph of the last 650,000 years of CO2 levels and temperatures. Of course the graph they used demonstrated that every time CO2 increased, temperatures increased (and when CO2 dropped temperatures dropped). The problem they didn’t discuss is that the data behind those graphs proves that temperatures always changed first. Unbiased science demonstrates the temperature drives CO2! Many physical laws of nature tell us this is what we should expect.