No matter how hard climate-catastrophe obsessed alarmists attempt to beat out a little doom from the data, their results still fall far way short of their projections. Moreover, the modest warming the planet has seen over the recent decades is tied more to natural cycles.
One alarmist tweeted in response to one of my recent posts with a WoodForTrees chart showing a temperature rise over the past 40 years. His aim was to say: The temperatures are rising fast and are right on course with the models:
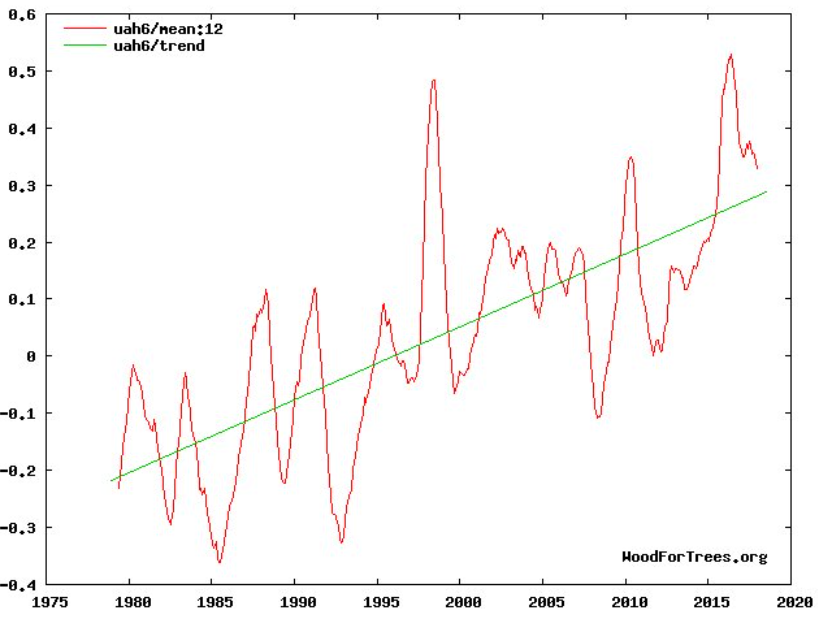
At first glance we see that the satellite data do show a warming trend over the past 40 years, and so the alarmists must be right – some might think.
But look at the chart more closely.
If you do, you’ll see that the global temperature over the past 40 years has risen from an anomaly of -0.2°C to +0.3°C, meaning a whopping 0.5°C over 40 years, which is 1.2°C per century.
When we put this in perspective, this is far lower than the than 4 to 6°C per century that the alarmists often like to have the public believe.
Putting this on a chart (I had to do a little rescaling):
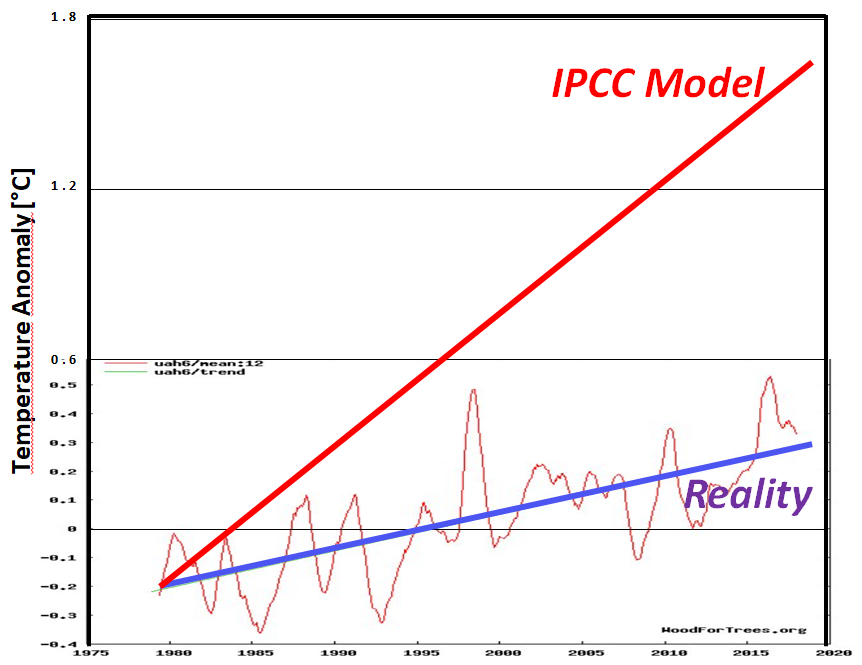
Chart: P Gosselin, using WoodForTrees data.
Of course the recent pause was interrupted by an El Nino event and the latest satellite data show that the global surface temperature is down to a mere anomaly of only 0.12°C:
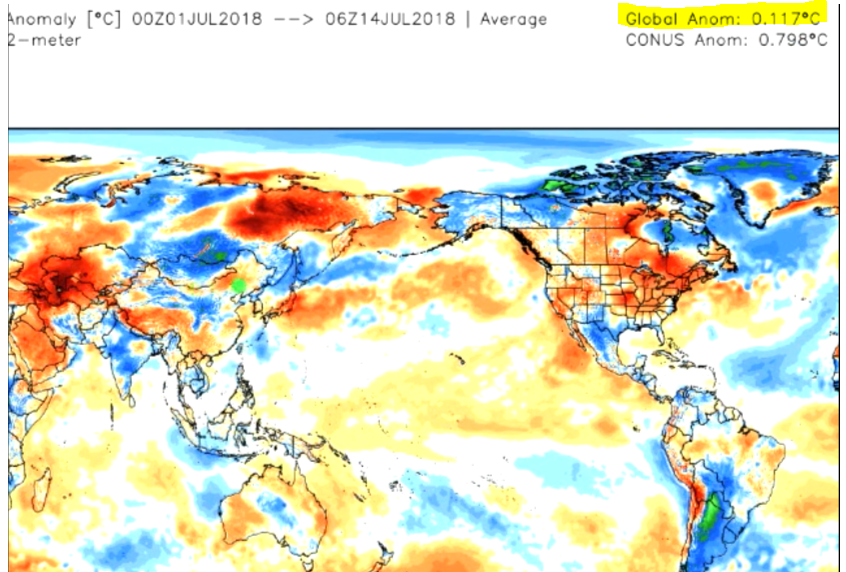
Chart snipped from Weatherbell Saturday Summary, July 14, 2018.
Temperature is not the only magnitude that global warming alarmists have totally exaggerated. Another example mentioned earlier is Arctic sea ice, which has been expanding over the past decade, i.e. doing the opposite of what was forecast:
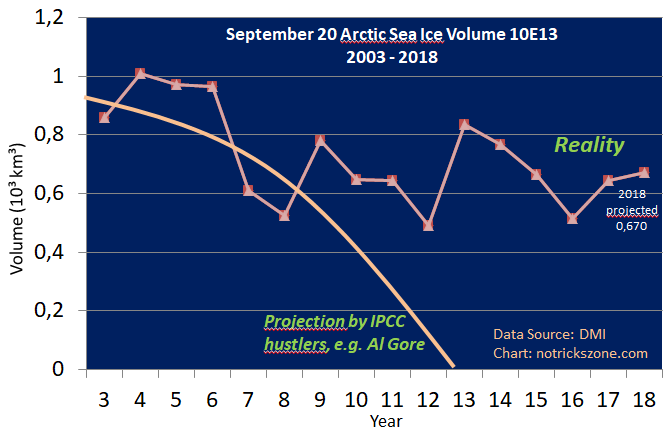
Al Gore’s hysterical projections of ice-free Arctic late summers are exposed as an absolute sham. 2018 uses a conservative projected value.
Today the doomsday scenarios and projections made 10 years ago have yet to show any signs of coming true. In fact, many scientists are projecting a cooling tendency ahead.


UAH6 from 1979 until now is: 1.27°C per century, RSSv4: 1.95°C per century, Hadcrut4 1.72°C per century and Gistemp 1.74°C per century. Source: http://woodfortrees.org/data/uah6/from:1979/trend/plot/rss/from:1979/trend/plot/hadcrut4gl/from:1979/trend/plot/gistemp/from:1979/trend
Who is predicting a 4 to 6 degree change per century? The IPCC reports predict various temperature increases according to different scenarios, none of those current predictions start in the year 1979 as in your graph.
This is better graph that compares the predictions (starting in 2005) to what was observed: http://blogs.reading.ac.uk/climate-lab-book/files/2014/01/fig-nearterm_all_UPDATE_2018.png (source).
There was no pause and the current (daily) anomaly is in the 0.4°C range: https://imgur.com/a/tnCirHj
But of course you know that those anomaly values aren’t directly comparable to UAH6 values, right?
In fact the first half of 2018 was the 3rd warmest first half of any year on record. Warmer than even 2015 an El Nino year.
Dear Pierre, what exactly do you think the IPCC forcast for Arctic sea ice? Certainly not what your graph shows. You should know that, especially since I pointed out to you multiple times now that a 5 meter thick ice sheet with the current sea ice volume would mean the Arctic is ice free according to the definition of that term.
Here is what the IPCC report predicts:
Do you see any resemblence to what you think they predicted?
That was a good one. As one can find a lot of “cooling is imminent” doomsday predictions from the skeptics side that were made 10 years ago. Even you made a pretty hilarious one, do you remember? None of those predictions came true. As for models meating reality, see the image a bit up in this comment.
I find it a bit troubling that you make up all this stuff in a desparate attempt to discredit the IPCC.
Christy et al., 2018
https://www.tandfonline.com/doi/full/10.1080/01431161.2018.1444293
“[A]s new versions of the datasets are produced, trend magnitudes have changed markedly, for example the central estimate of the global trend of the mid-troposphere in Remote Sensing System’s increased 60% from +0.078 to +0.125°C decade−1, between consecutive versions 3.3 and 4.0 (Mears and Wentz 2016).”
“[T]he evidence does support the hypothesis that the processed satellite data of NOAA-12 and −14 are characterized by spurious warming, thus introducing spuriously positive trends in the satellite records. Comparisons with other, independently-constructed datasets (radiosonde and reanalyses) support this hypothesis (Figure 10). Given this result, we estimate the global TMT trend is +0.10 ± 0.03°C decade−1. … The rate of observed warming since 1979 for the tropical atmospheric TMT layer, which we calculate also as +0.10 ± 0.03°C decade−1, is significantly less than the average of that generated by the IPCC AR5 climate model simulations. Because the model trends are on average highly significantly more positive and with a pattern in which their warmest feature appears in the latent-heat release region of the atmosphere, we would hypothesize that a misrepresentation of the basic model physics of the tropical hydrologic cycle (i.e. water vapour, precipitation physics and cloud feedbacks) is a likely candidate.”
Please cite the evidence that shows the temperature changes of the last several decades are unnatural or fall outside the range of natural variability.
Scafetta et al., 2017
http://www.iieta.org/sites/default/files/Journals/IJHT/35.Sp01_03.pdf
“A millennial climatic oscillation would suggest that a significant percentage of the warming observed since 1850 could simply be a recovery from the Little Ice Age of the 14th – 18th centuries and that throughout the 20th century the climate naturally returned to a warm phase as it happened during the Roman and the Medieval warm periods. … We critically analyze the year 2015-2016, which has been famed as the hottest year on record. We show that this anomaly is simply due to a strong El-Niño event that has induced a sudden increase of the global surface temperature by 0.6 °C. This event is unrelated to anthropogenic emissions.”
“Herein, the authors have studied the post 2000 standstill global temperature records. It has been shown that once the ENSO signature is removed from the data, the serious divergence between the observations and the CMIP5 GCM projections becomes evident.”
“Since 2000 there has been a systematic tendency to find lower climate sensitivity values. The most recent studies suggest a transient climate response (TCR) of about 1.0 °C, an ECS less than 2.0 °C and an effective climate sensitivity (EfCS) in the neighborhood of 1.0 °C. …Thus, all evidences suggest that the IPCC GCMs at least increase twofold or even triple the real anthropogenic warming. The GHG theory might even require a deep re-examination.”
—
Lean, 2018
http://onlinelibrary.wiley.com/doi/10.1002/wcc.511/full
“Ongoing scientific investigations continue to seek alternative explanations to account for the divergence of simulated and observed climate change in the early 21st century, which IPCC termed a “global warming hiatus.” … Understanding and communicating the causes of climate change in the next 20 years may be equally challenging. Predictions of the modulation of projected anthropogenic warming by natural processes have limited skill. The rapid warming at the end of 2015, for example, is not a resumption of anthropogenic warming but rather an amplification of ongoing warming by El Niño. Furthermore, emerging feedbacks and tipping points precipitated by, for example, melting summer Arctic sea ice may alter Earth’s global temperature in ways that even the most sophisticated physical climate models do not yet replicate.”
https://www.technologyreview.com/s/609620/global-warmings-worst-case-projections-look-increasingly-likely/
“The paper, published on Wednesday in Nature, found that global temperatures could rise nearly 5 °C by the end of the century under the the UN Intergovernmental Panel on Climate Change’s steepest prediction for greenhouse-gas concentrations. That’s 15 percent hotter than the previous estimate. The odds that temperatures will increase more than 4 degrees by 2100 in this so-called “business as usual” scenario increased from 62 percent to 93 percent, according to the new analysis.”
Zhou and Wang, 2017
https://www.nature.com/articles/srep31789
“Land surface air temperature (Ta) is one of the fundamental variables in weather and climatic observations, modeling, and applications. Despite the ongoing increase in atmospheric greenhouse gases, the global mean surface temperature (GMST) has remained rather steady and has even decreased in the central and eastern Pacific since 1998. This cooling trend is referred to as the global ‘warming hiatus’”
–
Hedemann et al., 2017
http://www.nature.com/nclimate/journal/vaop/ncurrent/full/nclimate3274.html
https://dl.dropboxusercontent.com/u/75831381/Hedemann%202017.pdf
“During the first decade of the twenty-first century, the Earth’s surface warmed more slowly than climate models simulated. … Budgeting with existing observations cannot constrain the origin of the recent hiatus, because the uncertainty in observations dwarfs the small flux deviations that could cause a hiatus. The sensitivity of these flux deviations to the observational dataset and to energy budget choices helps explain why previous studies conflict, and suggests that the origin of the recent hiatus may never be identified. … The observed trend deviated by as much as −0.17 ◦C per decade from the CMIP5 (Coupled Model Intercomparison Project Phase 5) ensemble-mean projection—a gap two to four times the observed trend. The hiatus therefore continues to challenge climate science.”
—
Xian and Fu, 2017
http://onlinelibrary.wiley.com/doi/10.1002/joc.5130/abstract
“Despite continually increasing concentrations of greenhouse gas, there has been a hiatus in rising global temperatures during the 21st century.”
—–
Liu and Zhou, 2017
https://www.nature.com/articles/srep40947
“Here, we divided recent decades into the recent hiatus period [1998-2013] and the preceding warming period (1983–1998) to investigate the atmospheric footprint.”
—
Fyfe et al., 2016
http://www.nature.com/nclimate/journal/v6/n3/full/nclimate2938.html
“It has been claimed that the early-2000s global warming slowdown or hiatus, characterized by a reduced rate of global surface warming, has been overstated, lacks sound scientific basis, or is unsupported by observations. The evidence presented here contradicts these claims.”
http://www.nature.com/news/global-warming-hiatus-debate-flares-up-again-1.19414 (press release)
“There is this mismatch between what the climate models are producing and what the observations are showing,” says lead author John Fyfe, a climate modeller at the Canadian Centre for Climate Modelling and Analysis in Victoria, British Columbia. “We can’t ignore it.” … Susan Solomon, a climatologist at the Massachusetts Institute of Technology in Cambridge, says that Fyfe’s framework helps to put twenty-first-century trends into perspective, and clearly indicates that the rate of warming slowed down at a time when greenhouse-gas emissions were rising dramatically.”
😉 He might have a bit of a conflict of interest talking about other temperature time series, don’t you think?
You’ve without a doubt read the changes that were made to RSSv4, haven’t you?
http://www.remss.com/blog/RSS-TMT-updated/
Not going to play today, Kenneth. The changes are unnatural because they are largely caused by a human-made increased CO2 concentration. If you want to get pedantic and call human actions natural too, well … your choice.
The next prophet of the (pseudo-)skeptics. Why not cite someone like Tony Heller too?
Oh Kenneth you had to search for this one, right? 😉 To clarify (see pretty picture which you seem to have ignored: http://blogs.reading.ac.uk/climate-lab-book/files/2014/01/fig-nearterm_all_UPDATE_2018.png): the likely range predicted by the IPCC isn’t even close to that high. The extremest of models for all RCPs barely approaches 5°C … and you guys think that this is what climate scientists are predicting what will happen?
Shall we take an extreme skeptic prediction example to illustrate what all skeptics seem to believe and predict? From October 2008 … some well-known skeptic predicted that the temperature anomaly would drop to -2.5°C by 2020. 2008 was a cold year and temperatures had just dropped more than half a degree (similar to what happens now). Seems like predicting a 12 year long decrease with a rate of more than 20°C per century was the obvious thing to do for weird skeptics. Right?
Quotes to “There was no pause”:
Despite all our conversations you still don’t get that it is not about temperatures at a specific place (here, the surface) and how it responds to the imbalance. Those are just symptoms of what is really happening, the change in heat content. How that heat content gets distributed is how we will experience AGW. There surely was no pause in the ever-increasing heat content which gets sometimes released in a bigger than normal fashion with us calling the event El Nino.
Please cite the evidence that shows the temperature changes of the last several decades are unnatural or fall outside the range of natural variability.
Why is a request to cite evidence to support your claims “play”, SebastianH?
So if they’re natural, they’re not man-made. If they’re man-made, they’re not natural. Brilliant analysis!
Scafetta et al., 2017
So when they publish something you disagree with, just disparage them. Brilliant!
http://www.euanmearns.com/wp-content/uploads/2014/06/FAR_1990.png
The IPCC has predicted over 4°C of warming by 2100 as their best estimate (and over 6°C with “business as usual” emissions). The original quote from the article was:
“…this is far lower than the than 4 to 6°C per century that the alarmists often like to have the public believe.” Pierre was effectively quoting the IPCC when referring to “the alarmists”.
It looks like that prediction is going to be quite wrong. And the consequences of this wrong prediction by a skeptic is…what?
Huh?
You never read one of Pierre’s post, right?
You are kidding, right? Turn your head to the left and read what that graph is saying on the y-axis. Then look at what you wrote here and tell me that you really think that this graph shows a 4 to 6 °C per century increase. Besides, Pierre started in 1979 not 1990 with his graph. Why are you defending this nonsense? Because it was me who pointed it out?
I see, so you think what you guys are saying has no impact therefore you can say anything you want. Got it.
You are just presenting your opinions on why experiences scientists might be wrong in an amateur forum and expect the world to listen to you since the world is apparently ignoring what you find to be “seminal papers”.
I believe I have read Pierre’s posts. Why?
According to the 1990 report (where that graph comes from), temperatures rose about 0.45°C between 1890 and 1990 (“Global-mean surface air temperature has increased
by 0.3°C to 0.6°C over the last 100 years.”). The projections for 1990-2100 (110 years) as shown on the graph are ~5.8°C above 1990 for the “business as usual” estimate and ~3.8°C above 1990 for the “best estimate”. I rounded up to 4 to 6°C for the BAU and BE.
Do you not actually read what your side is writing about future warming by 2100? It easily meets and exceeds the estimates Pierre cited. It’s common knowledge that your side believes we’ll get catastrophic warming in the coming decades. Why is it “nonsense” to point this out?
https://www.independent.co.uk/environment/climate-change/global-warming-experts-say-temperatures-could-rise-by-6c-by-2100-with-cataclysmic-results-10193506.html
“Scientists say temperatures could rise by 6C by 2100”
https://sos.noaa.gov/datasets/climate-model-temperature-change-rcp-85-2006-2100/
“CO2 levels rise to 936ppm by 2100 making the global temperature rise by about 5-6°C by 2100“
https://www.huffingtonpost.com/eric-zuesse/global-warming-is-rapidly_b_4499119.html
November 2009: The Global Carbon Project, which monitors the global carbon cycle, and the Copenhagen Diagnosis, a climate science report, predict 6C and 7C temperature increases, respectively, by 2100 [+5 or +6 C per century].
December 2010: The U.N. Environment Programme predicts up to a 5C increase by 2050 [+9 C per century]
November 2013: The International Energy Agency predicts a 3.5C increase by 2035 [+10 C per century].
For the most part, the world is ignoring the claims that alarming climate change is lurking and we humans need to do something about it. Emissions continue to rise, governments are failing to make good on their stated intent to reduce emissions, and fossil fuel use continues to rise unabated. Scientists continue to point out that there isn’t anything unusual happening today that falls outside the range of natural variability, and we are highlighting these insights by citing peer-reviewed scientific papers. That’s what’s happening here.
There is this thing called context. I am usually replying to something someone wrote. So when I reply to “So when they publish something you disagree with, just disparage them. Brilliant!” with a reference to Pierre’s posts, then what do you think I could mean with that? How does Pierre write about people or institutions that he disagrees with? And while we are at it, how do your fellow commentator buddies handle this?
??? This graph is not a current prediction. But if it were … I made an annotated version for you:
https://imgur.com/a/3KO9sWI (in essence: you eyeballed that wrong)
No, it doesn’t. Not at all: http://blogs.reading.ac.uk/climate-lab-book/files/2014/01/fig-nearterm_all_UPDATE_2018.png
At this point I question if you actually read what the IPCC predicts. You were equally wrong on their sea level rise predictions before and now this. Hmm …
Apparently this common knowledge seems to be another skeptic thing. You really have that impression of actual climate science/scientists? It is nonsense when someone posts a nonsense graph. He didn’t point out anything that actually is the case … therefore nonsense. How is that too hard to understand?
Sure, you keep believing that …
But they aren’t rising at the extreme rates of the worst case scenarios. You know, those scenarios that you keep bringing up to say that predictions would be too high. That’s the whole point. We aren’t on a RCP8.5 path and yet you think you need to compare reality with what models predicted for that case.
” and how it responds to the imbalance. “
The ONLY imbalance around here is in your mind, seb
A tiny increase in atmospheric CO2 DOES NOT create an imbalance
That is an SCIENTIFICALLY UNSUBSTANTIATED LOAD OF FANTASY..
many scientists are projecting a cooling tendency ahead.
https://notrickszone.com/2017/12/28/7-new-2017-papers-forecast-global-cooling-another-little-ice-age-will-begin-soon/
“Thirteen recently-published papers forecasting global cooling are listed below.”
Need I remind you of 2008-ish skeptic cooling outbursts?
Stick to what real scientists say and don’t misinterpret those papers please. Thank you.
So if they predict cooling in the coming decades in scientific journals, they cease to be “real scientists”. Scintillating logic.
An example: if a “scientist” predicts cooling because he/she did some curve fitting and extrapolated the found periodicals into the future, then yes … they cease to be “real scientists”.
There are plenty of examples available. Thankfully you post lots of papers which aren’t real science but somehow your skepticism doesn’t get triggered by their results. That is really weird, don’t you think?
Who decides which scientists are real and which ones can no longer be called scientists, then? You?
A few days ago you created this graph…
https://imgur.com/a/uk3Pxtp
… using extrapolation and assumptions about what will happen to ocean heat content in the coming decades due to human emissions. Because you’re predicting warming, does that make you more of a “real scientist” than the credentialed professors and Ph.Ds and physicists who are predicting temperatures will follow the reduction in solar activity in the decades to come?
Real-Science = papers I agree with. Aren’t-Real-Science = papers I don’t agree with. I have yet to see evidence that your “analyses” are any more substantive than that.
http://www.woodfortrees.org/plot/uah6/from:2016/to:2018.6/plot/uah6/from:2016/to:2018.6/trend
Can you explain why global temperatures have plummeted by -0.4°C since 2016? What’s the mechanism for this cool-down considering you attribute the warming of 2015-’16 to CO2 concentration increases, and the increases have continued?
For that matter, why did temperatures fail to rise during the 15 years between the last two Super El Nino events (1997-’98, 2015-’16), or while CO2 concentrations rose from 360 ppm to 400 ppm?
http://www.woodfortrees.org/plot/uah6/from:2001/to:2015/plot/uah6/from:2001/to:2015/trend
Kenneth,
You are a patient soul.
What usually follows an El Nino?
Stop making up stuff I never said!
You are really slow to understand. You really do think the CO2 is directly warming the planet’s surface or better, you think we are saying this is what is happening. To this, I can only say “wow”.
Can you explain why global temperatures have plummeted by -0.4°C since 2016?
This is an answer? What is the mechanism that has caused temperatures to plummet -0.4°C since 2016?
you attribute the warming of 2015-’16 to CO2 concentration increases, and the increases have continued?
Really? This is news to me. So you never claimed that the warming during 2015-’16 was caused by rising CO2 concentrations? What do you attribute that warming to, then? What percentage of the 2015-’16 warming anomaly was natural?
As you know, temperatures did not rise between the last 2 Super El Nino events of the last 20 years, or between 2001 and 2015. The only warming that delivered an upward temperature slope for the trend was from Super El Nino events (1997-’98, 2015-’16). And if you agree that those events weren’t anthropogenic in origin, from where does the warming come from for the 20-year trend?
No, that’s not what I really do think. The Sun directly warms the surface.
Umm … so if one would draw a line between 1996 and today, it would be flat? If you agree that this is not the case, then please explain how an event that releases OHC to the atmosphere can cause lasting increased temperatures.
It is all about the distribution of the available heat content, Kenneth. And that heat content happens to rise because of the radiative imbalance.
To answer your question in case you still don’t understand. The El Nino events are natural events. The heat they redistribute comes from somewhere and that reservoir is increasing because of our emissions. And yes, it even increased in that “pause” you are dreaming of.
Why do you keep replying in such a way? Either you are trolling or are super slow or unable to understand what people write at all. Haven’t read the full sentence, have you?
No. Because the Super El Nino events, driven by natural variability, delivered step-like warming.
Belohpetsky et al., 2017
https://cest.gnest.org/sites/default/files/presentation_file_list/cest2017_00726_oral_paper.pdf
“Linear trends for three quasi-stable periods 1950-1987, 1988-1997 and 1998-2014 are near zero with nearly all warming occurring during two step-like shifts in the years 1987/1988 and 1997/1998. A notable consequence of the staircase dynamics of recent warming is that observed temperature anomalies (HadCRUT4.5) from 1950 till 2014 could be almost reproduced as the linear sum of only two factors(!) : ENSO variability and the staircase function.”
—
Jones and Ricketts, 2017
http://www.earth-syst-dynam.net/8/177/2017/esd-8-177-2017.pdf
“[S]ince the mid-20th century, most observed warming has taken place in four events: in 1979/80 and 1997/98 at the global scale, 1988/89 in the Northern Hemisphere and 1968–70 in the Southern Hemisphere. Temperature is more step-like than trend-like on a regional basis. Satellite temperature is more step-like than surface temperature. … [S]tep-like changes are also present in tide gauge observations, rainfall, ocean heat content and related variables. [A]cross a selection of tests, a simple stepladder model better represents the internal structures of warming than a simple trend, providing strong evidence that the climate system is exhibiting complex system behaviour on decadal timescales. This model indicates that in situ warming of the atmosphere does not occur; instead, a store-and-release mechanism from the ocean to the atmosphere is proposed. It is physically plausible and theoretically sound.”
Um, they really aren’t “lasting”. We just happen to be at the end of a peak, just as we were in 1940, before Northern Hemisphere temperatures plummeted by -0.6 C and global temperatures dropped by -0.3 C…before they began rising again with the mid-1970s ENSO event. It’s similar to what has happened in the Arctic and across the world that are not influenced by urban bias and contamination. Non-contaminated instrumental temperatures and matching proxy records look like this:
https://notrickszone.com/wp-content/uploads/2018/05/Instrumental-Temperatures-Northern-Hemisphere-1900-2010-Lansner-and-Pepke-Pedersen-2018.jpg
–
https://notrickszone.com/wp-content/uploads/2018/04/Northern-Hemisphere-126-Proxy-Temperatures-1800-to-2000-Xing-2016.jpg
–
https://notrickszone.com/wp-content/uploads/2017/04/Holocene-Cooling-Northern-Hemisphere-Schneider-2015.jpg
–
How do you know it’s due to the very uncertain radiative imbalance estimations (i.e., the imbalance was alleged to be 0.6 W m-2 +/- 17 W m-2 for 2000-2010 [Stephenson et al., 2012], meaning the uncertainty in radiative forcing is many times larger than the estimate itself) rather than to natural variability…especially since ocean temperatures fluctuate at far greater magnitudes naturally than what has occurred since 1950 (just 0.2 C of warming in the 0-700 m layer)?
Back in 2014, the American Physical Society had a series of questions related to the substance of climate change. Speaking of radiative imbalance and ocean temperature changes, can you answer this salient question?
https://www.aps.org/policy/statements/upload/climate-review-framing.pdf
“Reliable climate hindcasts and projections therefore require that the state of the oceans (current, temperature, salinity …) be known well on long timescales. Yet, as illustrated in WG1 AR5 Figure 3.A.2, good observational coverage has been available for less than a decade. With uncertainty in ocean data being ten times larger than the total magnitude of the warming attributed to anthropogenic sources, and combined with the IPCC’s conclusion than it has less than 10% confidence that it can separate long-term trends from regular variability, why is it reasonable to conclude that increases in GMST are attributable to radiative forcing rather than to ocean variability?”
Correct.
The heat comes from absorbed solar radiation, and more solar radiation heated the oceans during 1979-2011 due to the decreases in cloud cover during that period. That’s what satellite observations of cloud cover changes tell us, anyway.
http://www.sciencemag.org/content/295/5556/841
“It is widely assumed that variations in Earth’s radiative energy budget at large time and space scales are small. We present new evidence from a compilation of over two decades of accurate satellite data that the top-of-atmosphere (TOA) tropical radiative energy budget is much more dynamic and variable than previously thought. Results indicate that the radiation budget changes are caused by changes in tropical mean cloudiness.”
—
http://www.atmos-chem-phys.net/13/8505/2013/acp-13-8505-2013.html
“[T]here has been a global net decrease in 340 nm cloud plus aerosol reflectivity [1979-2011]. … Applying a 3.6% cloud reflectivity perturbation to the shortwave energy balance partitioning given by Trenberth et al. (2009) corresponds to an increase of 2.7 W m−2 of solar energy reaching the Earth’s surface and an increase of 1.4% or 2.3 W m−2 absorbed by the surface.”
Well, that’s your belief, rooted in no empirical observation or real-world physical measurement that shows how much heating occurs in ocean waters due to ___ increases in CO2 ppm. We have no numbers for this. No measurements. No real-world observations. It’s conjecture.
Your insult attempts aren’t persuasive, SebastianH.
and seb IMMEDIATELY and DECEITFULLY uses an El Nino step to create a trend
Thus PROVING Kenneth correct
Well done seb 🙂
Good to have you on the realist side for once.
You do know that there was
NO WARMING from 1980-1997
https://s19.postimg.cc/kr0uu9cz7/RSS_V4_before_El_Nino.png
NO WARMING from 2001-2015,
https://s19.postimg.cc/jcuv319ir/RSS_V4_2001_-_2015.png
don’t you seb ???
Or are you going to continue to DENY the DATA and the FACTS?
Ok, so we just wait a few decades then. What will you do when it turns out that you could not have been more wrong? Would that be enough to make you realize how ridiculous your breed of skepticism is?
Great, let’s find you other paper with much less uncertainty then. Will that change your mind? Of course not. You’ll keep repeating the most extreme figures you can find.
https://agupubs.onlinelibrary.wiley.com/doi/pdf/10.1002/2014GL060962%4010.1002/%28ISSN%291944-8007.GRLCMIP5
More?
How do I know that there is a radiative imbalance? Because the OHC is increasing. That should be a pretty obvious sign. How do we know that it is very likely CO2 and not the Sun? Because the Sun’s output decreased in the last cycle and the OHC kept increasing even in the minima between cycles.
How could ocean variability increase the heat content all by itself?
See what you did there? You point this out as a fact to me. If I’d present you two papers citing that the OHC increase is entirely explained by the increase in CO2 concentration you would be outraged and declare me dishonest again or something like that.
*sigh* … you keep believing that and tell yourself that what is happening is just a belief we normal people have 😉
Not trying to insult you. If you are really slow then I have to try to write in simpler terms so that the language barrier and shortened replies don’t confuse you. If you are just trolling me with these kind of replies then I need to stop replying to you just as I try to handle it with spikeys “replies”.
For spikey:
http://woodfortrees.org/plot/rss
Does this look like what you imagine to be real? I see a pretty straight increase with a few extremes.
About what? Oscillating temperatures? CO2 has risen by about 50 ppm and we’ve had a little over 0.1 C of warming in the last 20 years. Is this consistent with estimates of climate sensitivity that say we’ll get to 5 or 6 or 7 degrees of warming by 2100? No, and yet your side doesn’t admit the climate models predicated on CO2 as a climate driver were wrong.
And just like that, the uncertainty disappears! It’s like the IPCC declaring their opinions (“Very High Confidence”) represent statistical certainty values. If uncertainty is a problem, just find a paper that has less of it. And then you can be certain you are right!
According to new science, OHC increased by a whopping 0.0213°C between 1994 and 2013.
Wunsch, 2018
https://www.tandfonline.com/doi/full/10.1080/16000870.2018.1471911
“The mean slope implies a change over 20 years [1994-2013] of 0.0213 ± 0.0014 °C”.
That’s about 0.01°C per decade. During the Holocene, ocean temperatures in the 0-1000 m layer changed by 10 times that amount, or 2°C in 200 years. No wonder Bova et al. (2016) found that the modern change is “below detection”.
But considering you say that you know the radiative imbalance is increasing because the OHC has, for recent decades, been rising, this begs the question…
Between the Medieval Warm Period and Little Ice Age, ocean heat content (as expressed in temperature values) plummeted by -0.9C. That must mean the radiative imbalance was quite negative during the 600 years between 1000 and 1600 CE. What was the mechanistic cause for that negative radiative imbalance, since CO2 values remained steady throughout that period?
So, in your opinion, changes in “the Sun’s output” is the only “natural” factor that deserves mentioning affecting OHC. Of course.
Who wrote “all by itself”? I didn’t.
So you’re not trying to insult me, but you have to write in simpler terms since I am “really slow” intellectually. Pathetic.
“you keep believing that ”
Then PRODUCE THOSE MEASUREMENTS, seb
But you KNOW they don’t exist, don’t you.
That is why you continually adopt the evasive headless chook routine, never producing one tiny piece of actual scientific evidence.
Poor little attention-seeking troll.
Only purpose is as a serial pest.
FAILING MASSIVELY at anything else you think you are trying to accomplish.
Poor mathematically INEPT seb.
Unable to comprehend basic data.
Between the El Ninos..
NO WARMING from 1980 – 1997
https://s19.postimg.cc/y6om3sbjn/RSS_Before_El_Nino.jpg
NO WARMING from 2001-2015
https://s19.postimg.cc/im6e8dgxf/RSS_pre_2015.png
Only warming from oceans, distributing energy from the SUN
ZERO EVIDENCE of any CO2 warming, anywhere, anytime.
“You really do think the CO2 is directly warming the planet’s surface “
Poor seb, As you have CONTINUALLY SHOWN…..
.. there is ZERO SCIENTIFIC EVIDENCE that CO2 warms the planet directly or indirectly in any way whatsoever.
Thanks so much for finally coming to that REALisation.
Now can you stop with your anti-science idiocy??
Seb,
Yet you do realize that the predicted Global Warming for “Business as Usual” human CO2 emissions was 0.3 deg. C/decade (with lower and upper bounds of 0.2 and 0.5 deg. C/decade, respectively?
Even after the GISTEMP record was tampered with considerably, the best they could squeeze out was 0.17 deg. C/decade, as you have admitted. This despite BAU human emissions being considerably higher than predicted (> 2% rise per year, on average, since 1990, yet the IPCC and Hansen et al. 1988 considered 1.5% rise in human CO2 emissions to be BaU).
So less warming (in the most extreme database used) vs. the lower bound of the predictions, despite BaU human CO2 emissions growth being at least +33% above predicted levels, year on year, on average, for the past 30 y.
That’s a major fail in my book, Seb. Like a penalty shot missing the goal by 5 m left of the post and 5 m above the cross bar. But you’d probably argue that with VAR it should have been a GOAL!
When? Why is it impossible for predictions to improve since when that was the case? Do you think this graph is wrong?
http://blogs.reading.ac.uk/climate-lab-book/files/2014/01/fig-nearterm_all_UPDATE_2018.png
Please stop with this conspiracy/hoax/it’s-all-fake nonsense.
Use more current predictions, please.
You seem to have no idea what the lower bound of the predictions is. Again, do you think this graph is wrong?
http://blogs.reading.ac.uk/climate-lab-book/files/2014/01/fig-nearterm_all_UPDATE_2018.png
Living in the past is a fail. Looking backward instead of forwards is a fail. Stick to current predictions and how they faired. Or at least be so honest and acknowledge the more limited knowledge that was available in predictions made further back. Carbonbrief had a wonderful article about how different predictions did over time, but I am not allowed to link to such websites. Apparently someone could get the idea that skeptics are making stuff up if they would dare to visit the “enemy websites”.
Only person “making stuff up” is you seb
This FALLACY of human CO2 induced warming for instance.
as you know there is ZERO EVIDENCE for this.
It is a FANTASY worth of a Grimm Bros fairy tale.
You could of course easily prove me wrong.
All you have to do is answer two simple questions….
Q1.. In what way has the climate changed in the last 40 years, that can be scientifically attributable to human CO2 ?
Q2. Do you have ANY EMPIRICAL EVIDENCE at all that humans have changed the global climate in ANYWAY WHATSOEVER?
Why is this SO INCREDIBLY DIFFICULT for you, seb ??
As seb well knows, The slight warming has been TOTALLY NATURAL
He has ZERO EVIDENCE of any human cause.
In fact, the warming has come from just two El Nino events
There was actually NO WARMING from 1980-1997 even in RSSv4
https://s19.postimg.cc/kr0uu9cz7/RSS_V4_before_El_Nino.png
And NO WARMING from 2001-2015
https://s19.postimg.cc/jcuv319ir/RSS_V4_2001_-_2015.png
So, the ONLY warming came from the oceans
And as seb well knows, there is ZERO way in which humans have warmed the oceans.. (unless he invents some fantasy “mechanism” unprovable to any science or physics.)
This slight warming has been HIGHLY BENEFICIAL as well, and with the increased atmospheric CO2 has helped produce increasing crop yields around the world.
There is NO measurable CO2 warming effect. seb would be able to answer these two simple questions if there was.
Q1.. In what way has the climate changed in the last 40 years, that can be scientifically attributable to human CO2 ?
Q2. Do you have ANY EMPIRICAL EVIDENCE at all that humans have changed the global climate in ANYWAY WHATSOEVER?
“I pointed out to you multiple times now that a 5 meter thick ice sheet with the current sea ice volume would mean the Arctic is ice free according to the definition of that term.”
ROFLMAO
Yes, it was yet another hilarious indicator of your total DETACTMENT FROM REALITY.
1 Wadham = 1 Million km² is NOT ice free, by any but a manic AGW fantasy
You do know that is nearly 3 times the area of Germany.. is Germany now to be classified “land free”
MASIE currently has Arctic sea ice extent above that of EVERY year back to 2006
Keep squirming , seb.. its hilarious to watch. 🙂
Defend it all you want – bottom line, Man’s tiny input to natural c02 is noise compared to natural cycles – before the bizarre and intentional data tampering, captured so well in climategate emails, and did not stop after that, we see a .5C increase starting from the end of an extremely cold decade of the 70’s, which is far less than the increases from the late 1920s into the early 1940’s (Even NASA confirms arctic warming in the 30’s was almost identical if not a tad warmer than what we have seen in this rebound from a cool cycle. The entire forcing thoery and ridiculous lifecycle projections of c02 in the atmosphere (some models as high as 100 years! when it is around 6 or 7 years) + the idea that it is well mixed gas which is nonsense + the fact that temperature increases first, then c02 levels…all in all what you have is a very modest .5C over 40 years. Did you expect temps to remain the same or go lower starting from the end of the 70s? In your world does c02 remain constant, global temps remain constant, and climate does not naturally cycle. This was common knowledge before your jackass pseudo-scientists changed a cyclic graph into some laughable, almost linear graph, where adjustments to temps match up with c02 values with an R value of about .98!!! Junk science fueled by fear, ignorance, and man’s horrible memory – AND THERE IS NO SUCH THING AS A GLOBAL temperature – the idea that our instruments can first set an arbitrary time frame that we call a year, that mother nature calls nothing, and measure it to an accuracy of POINT 1 (.1) C, and then call one year the hottest ever as it was .2C higher than last year is absolute stupidity. We have put out over 1/3 of all man’s c02 production, and to make this stupidity fly, we have to attribute an entire .5 C (wow!) to man made causes – in other words, you must accept temps should have remained the same or gone lower starting from the end of the 70’s to believe this garbage – and only half a degree C with over 1/3 of all of man’s c02 addition to the atmosphere? Any clown can play with statistics, choose starting and end points, and draw a conclusion – but that conclusion is absolutely meaningless, and .5 degrees C with over 1/3 of all man’s contribution refutes any idea that c02 is a major driver of climate (especially Man’s tiny input compared with mother nature).
The Satellite data was altered to show that warming.
https://www.youtube.com/watch?v=j3MFFT7CKXY
Not a conspiracy “theory,” but a simple fact.
Another simple fact, as I’ve pointed out numerous times in the past, using the temperature “anomalies” is just a con trick. They are essentially meaningless, because they are so tiny compared to the noise in the data.
https://www.youtube.com/watch?v=kwIixU1JyDU
SebH is obviously suffering from Idee Fixe. Therefore there is no point discussing, with him, anything to do with his erroneous opinions.
Yep, he had one idea, ages ago , and is now still avoiding defending it
The amount of trite, juvenile, mindless, meaningless waffle and distraction BS he has come out with in his HATRED of CO2 is a wonder to behold.
But NEVER any science or empirical data.
Funny about that. 😉
There is indeed no point in discussing anything with people who can not even agree on basic facts and need to make up their own fantasies to justify what you „skeptics“ do. It’s kind of interesting though with what you guys keep coming up. Huge respect for the levels of creativity involved in this act.
The problem is, your version of “basic facts” are that humans are (nearly?) 100% responsible for the overall temperature change of the last 6 or 7 decades, or (nearly?) 100% responsible for Arctic sea ice decline, sea level rise, ice sheet depletion, etc. Those aren’t “facts”.
Who’s “you guys”? The scientists publishing the 1,000s of papers that support a skeptical position on climate alarm?
What else isn’t a fact:
– land water storage canceling out thermal expansion / glacier melt
– the “gravito-thermal effect”
– thermal expansion only affecting locations where the water is deep
– Antarctica reducing the sea level rise
– cloud cover being mainly controlled by cosmic rays
– a pause of global warming
– the Arctic ice sheet being stable
– etc …
We can not even agree on climate change happening. That’s how far off reality you guys are.
You skeptics who are likely misinterpreting the larger amount of what you think supports your pseudoskepticism. But since we are playing the numbers game, do you think the scientists who published tens of thousands of papers on global warming this year alone are wrong?
Correct. Those aren’t “basic facts” either. They’re in dispute.
Is there someone here who has claimed that the climate hasn’t, or doesn’t change? I doubt there is. But please cite the quote where you’ve read this from “you guys”.
Please provide evidence that there have been “tens of thousands of papers” published in the last 6 months that affirm the position that anthropogenic CO2 emissions drive climate. Just saying there are that many papers “on global warming” doesn’t mean anything. Skeptics agree that much of the globe is warmer now than during the Little Ice Age. That doesn’t mean we agree that humans are primarily responsible for it.
Each one of these is backed by solid measurements and data
Do you have ANY solid evidence or data to back up your claims of CO2 warming ??
We have waiting a long, long time…
NOPE, you haven’t , because it NOT a FACT.. it is a FANTASY.
1. data shows land water storage has increased as the planet has naturally warmed
2. The gravity/thermal temperature gradient is measurable on every planet/moon with a viable atmosphere.
3 Antarctic mass gain, and it has been, will reduce sea level
4. There has been ZERO atmospheric warming between El Nino events
5. The ARctic sea ice has been stable for the last 12 ears and is now starting to increase in line with the turning of the AMO.
All VARIFIABLE DATA.
CO2 warming… no data, nothing, nada…
We are all STILL WAITING.
Q1.. In what way has the climate changed in the last 40 years, that can be scientifically attributable to human CO2 ?
Q2. Do you have ANY EMPIRICAL EVIDENCE at all that humans have changed the global climate in ANYWAY WHATSOEVER?
“We can not even agree on climate change happening.”
Yes, it has warmed slightly from increased solar activity since the LIA.
This has generally occurred through solar warming of the oceans being distributed to the atmosphere in El Nino and other oceans releases of energy.
Man-made climate change ????
We have yet to see ANY of your evidence for this myth.
And we have been waiting a long , long time. !!
You could start by answering two simple questions, seb
OR you respond by running away yet again..
Q1.. In what way has the climate changed in the last 40 years, that can be scientifically attributable to human CO2 ?
Q2. Do you have ANY EMPIRICAL EVIDENCE at all that humans have changed the global climate in ANYWAY WHATSOEVER?
Your continued EVASIONS highlight the EMPTYNESS of the science behind CO2 warming, for ANYONE to see.
Oh and thermal expansion if you take a km of steel rail and warm it by 1ºC you will get a measurable change in length, about 7mm, actually
If however you take a 0.5m length and warm it 1ºC, you will need a microscope to measure the change.
I KNOW from your past posts that measurement, physics, maths, engineering etc, are something you know basically NOTHING about, at all,
… but really ??????
Do at least TRY not to be SO INCREDIBLY DUMB.
Kenneth:
Ehm, you and your fellow commenters regularly post those things as facts. May I quote you on this? You wrote “But thermal expansion doesn’t deliver enough to sea level rise (about 0.64 mm/yr for 2005-2013) for the currently claimed rate to add up, especially when we consider that terrestrial water storage more than cancels out (-0.71 mm/yr for 2002-2014) the attribution from thermal expansion.”
And now you are saying that you aren’t presenting things like this as facts? It sure reads like you do. Don’t pull a Trump on me please …
You have to look no further than yourself. When you write that there has been no warming besides El Nino events or that the instrumental record would be fake and would not show past warmth? What do you think that is? Other commenters go even further and declare that there is no climate change or that CO2 has not the effect it has. In this thread spikey declared that Antarctica’s mass would be gaining. It doesn’t. What do you do with such a person in a conversation?
We can’t agree on basic facts, so how do you expect a conversation with you guys should be possible? You are just trying to distract others with your nonsense and somehow think you are not wrong. It’s weird to watch.
1000 papers supporting skeptic viewpoints doesn’t mean anything either. You once wrote you read the blogs of “the other side” of the argument, so you should know those postings with new papers and new findings in the field of climate science. Or are you choosing to ignore those too?
Ehm wow, I am proud of you … I hope you skeptics can also agree that it is warmer in the summer than in the winter in one hemisphere. Next you are presenting a paper to us that declares that the sea level would not rise when floating ice melts. Apparently a new revelation in skeptic circles. Oh wait, you already did that (Khan).
Well you can’t be thinking that something cancels out the human influence because that would mean that it would be cooler without the human influence. That leaves humans having no or just a litte bit of influence. I wonder how you came to that conclusion facing all the evidence and observations. You once wrote you “switched sides” when the climate-gate e-mails appeared? Is your believe based on this? That the physics of human influence is all a hoax? Faked to get attention or something? To install a new world order as some here believe?
See, it is very difficult to have a meaningful conversation with people that drifted this far off the norm.
Spikey: just let it be. You don’t need to “counter” me with lies. That’s not how countering works. If you really believe in those things you brought up here, we could bet on it. What do you predict will happen in the next 10 years until 2028? I am all for more ridiculous skeptic predictions that have no impact …
I purposefully do not characterize what I write as fact. I purposefully avoid using that word. That’s why I wrote “Correct. Those aren’t ‘basic facts’ either. They’re in dispute.” I meant what I wrote.
Is there someone here who has claimed that the climate hasn’t, or doesn’t change?
Um, those misquotes are examples of how I deny that the climate changes?!
Again, I challenge you to cite even one instance when “other commenters” have declared that there are no climate changes. That I have noticed, everyone here agrees that the climate changes, especially on long-term time scales (i.e., the MWP to LIA to today).
So you believe East Antarctica — 3/4ths of the continent — has not been cooling and gaining mass for decades? Because that’s what the science says. The science also says the Southern Ocean has been cooling and the sea ice has been gaining for decades. The areas warming/losing mass on the continent are the ones primarily sitting atop active geothermal heat sources.
It is indeed difficult to communicate with you. But I doubt people here would agree that the problem is that we don’t agree with your version of “basic facts”. It has more to do with you personally.
No, I’m not trying to distract. I’m highlighting scientific papers that support the position that the alarmist claims of impending CO2-driven climate baddies (5 to 6 degrees of warming by 2100!) are lacking in substantiation.
I’m curious. Do you actually believe you are accurately representing what was written in the paper?
I wasn’t nearly as invested in 2009, but I had thought that scientists would have the ethics not to manipulate data and keep dissenters from getting published… But Climategate was an eye-opener. Judith Curry also has written that Climategate was the game-changer for her. I also had a lot of problems with Gore’s movie, which actually had the opposite effect on me than his intent. I’ve always been skeptical of forecasts of imminent doom (i.e., the Erlich population scares).
I don’t use the word “hoax”. “Faked to get attention”?!
Because “norm” is believing that humans control the size of glaciers and control sea level rise and control temperatures in West Antarctica and control sea ice in the Arctic and “acidification” in the oceans by burning more or less fossil fuels. I think you’d be surprised just how “norm” these beliefs are.
“Next you are presenting a paper to us that declares that the sea level would not rise when floating ice melts.”
Why is that a problem??
Do you actually think sea level would rise when floating ice melts?
REALLY ???
” that there has been no warming besides El Nino events”
Show us where the lower atmospheric warming (that is where the CO2 is, btw) is between the El Ninos.
Do you dispute the data ??
Even RSSv$ shows no warming from 1980-1997 and no warming from 2001-2015.
Data, seb
That which is TOTALLY LACKING from your evidence.
And please don’t use the surface data which has “adjustments™” that match the CO2 rise. That would be hilarious.
While you are at it, maybe find some actual scientific evidence for CO2 warming ??????
You seem to be totally LACKING in that area as well.
Poor pathetic seb, still the mindless EVIDENCE FREE prattle.
You KNOW that the data is purely in favour of the climate realists.
You know that data supports all 6 points
Why the continued evasion in producing ANY EVIDENCE AT ALL of the most simple meme of the AGW scam.. ie CO@ warming
It is noted BY EVERYONE that you yet again give the EVASIVE zero-evidence headless-chook route that is so, so common in all your posts.
You have yet to prove me wrong on any point.
You have yet to produce any scientific evidence of the “fantasy fizzics” of human caused warming..
.. because YOU KNOW THAT YOU CAN’T.
Mindless bluster is NOT PROOF, seb
But its all that you have, isn’t it.
I bet you can’t even show where I have lied.
Every one of those points is backed by measurements and observations.
Warming from the CO2 GHG has NEVER been observed or measured anywhere on the planet. It is empty mythical idea, up there with your unicorn farts.
“who can not even agree on basic facts “
Everyone agrees with the FACT that you are TOTALLY UNABLE to provide scientific substantiation of CO2 warming anything, anywhere, anytime
You don’t even seem to be able to agree with a FACT that you keep proving time after time after time after time.. ad infinitum !!
You have NO FACTS , seb
anywhere, anytime.
‘Idee Fixe’, yes indeed Steve.
The evidence of this is here https://notrickszone.com/2018/07/17/ipccs-kangaroo-science-to-ignore-over-600-papers-confirming-major-solar-impact-on-climate/#comment-1268507 when he says —
“I get why you guys try to call facts and opinions that you don’t agree with trolling. Doesn’t change those facts though. The article above is misleading … very misleading.
Waiting for your demonstration (and no Kenneth, I won’t accept a list of papers and quotes from them that you’ll undoubtly will reply with).“
There is nothing we can show that will have him change attitude.
He makes it clear it is pointless to try, for his belief (for that is all he has) is strong. ‘Idee Fixe’ is all there is!
There is no amount of scientific documentation (from Kenneth, or no doubt anyone else) that will have him change his fixed stance. This shows he has not scientific proposals to offer but is just here as a religious propagandist attempting to spread his version of virtual reality he believes (for that is all he has) is the truth. He has no scientific curiosity, or skepticism, his has not an inquiring mind. Indeed, the very model of the ‘Idee Fixe’
@tomO
My 2 cts worth, when Pierre approves it.
https://notrickszone.com/2018/07/17/ipccs-kangaroo-science-to-ignore-over-600-papers-confirming-major-solar-impact-on-climate/comment-page-1/#comment-1268644
He’s so committed to his cult, and always wrong. …so very very wrong.
The recent warming period is not exceptional in terms of magnitude of warming, regions where the warming occurred, and rate of warming.
The bulk of the recent warming is at the same latitudes where there was past cyclic warming which was in every case followed by cyclic cooling.
Greenland ice temperature, last 11,000 years determined from ice core analysis, Richard Alley’s paper. William: As this graph indicates the Greenland Ice data shows that have been 9 warming and cooling periods in the last 11,000 years.
http://www.climate4you.com/images/GISP2%20TemperatureSince10700%20BP%20with%20CO2%20from%20EPICA%20DomeC.gif
Curiously the cult of CAGW ignore the fact that the planet has in the past warmed and cooled cyclically with the warming and cooling cycles correlating to solar changes with a periodicity of 1470 years.
http://www.agu.org/pubs/crossref/2003/2003GL017115.shtml
Timing of abrupt climate change: A precise clock by Stefan Rahmstorf
Many paleoclimatic data reveal a approx. 1,500 year cyclicity of unknown origin. A crucial question is how stable and regular this cycle is. An analysis of the GISP2 ice core record from Greenland reveals that abrupt climate events appear to be paced by a 1,470-year cycle with a period that is probably stable to within a few percent; with 95% confidence the period is maintained to better than 12% over at least 23 cycles. This highly precise clock points to an origin outside the Earth system (William: Solar changes cause the warming and cooling); oscillatory modes within the Earth system can be expected to be far more irregular in period.
http://wattsupwiththat.files.wordpress.com/2012/09/davis-and-taylor-wuwt-submission.pdf
Davis and Taylor: “Does the current global warming signal reflect a natural cycle”
…We found 342 natural warming events (NWEs) corresponding to this definition, distributed over the past 250,000 years …. …. The 342 NWEs contained in the Vostok ice core record are divided into low-rate warming events (LRWEs; < 0.74oC/century) and high rate warming events (HRWEs; ≥ 0.74oC /century) (Figure). … …. "Recent Antarctic Peninsula warming relative to Holocene climate and ice – shelf history" and authored by Robert Mulvaney and colleagues of the British Antarctic Survey ( Nature , 2012, doi:10.1038/nature11391),reports two recent natural warming cycles, one around 1500 AD and another around 400 AD, measured from isotope (deuterium) concentrations in ice cores bored adjacent to recent breaks in the ice shelf in northeast Antarctica. ….
[…] Continue Reading […]
I don’t read Sebastian’s posts. But by all accounts he is owned and keeps coming back for more. My guess us some masochistic tendencies.
https://www.youtube.com/watch?v=JjeOc8TQwXU
I have come to the conclusion that the troll’s only paid employment is as a lobbyist for “The Green Blob”.
Its downtime is spent trolling.
In short the troll is an enemy of the environment and humanity.
The physics used by climatologists is wrong, violating or disregarding no less than three long-established laws of physics as I have explained in my papers that are based on extensive research and correct application of physics. Therein you will find the only correct explanation for all planetary core and surface temperatures throughout the Solar System. You all need to study it someday by clicking my name above.
[…] [10] NoTricksZone 18. July 2018: Global Temperature Rise Some 75% Lower Than Models Projected! […]
[…] P. Gosselin, July 18, 2018 in […]
[…] was reminded of this upon reading Pierre Gosselin’s recent post at NoTricksZone, “Global Temperature Rise Some 75% Lower Than Models Projected!” (July 18). His piece prompted vigorous debate where one commenter in particular presented a […]