A new study by Williams et al appearing in the Journal of Atmospheric and Solar Terrestrial Physics shows that the global warming hiatus of the early 20th century was in fact real.
Image cropped here.
Hat-tip Mary Brown
A number of scientists from the alarmist camp like to insist that there had never been such a hiatus. The latest paper contradicts that claim.
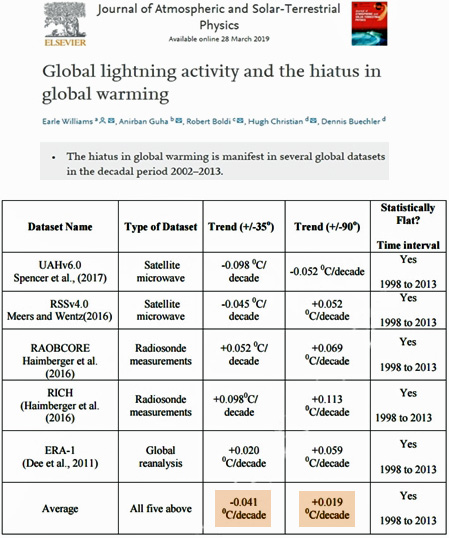
The new study states that many published analyses show that lightning activity is responsive to temperature on time scales ranging from the diurnal to the decadal and that the hiatus in global warming earlier this century can be seen in several global datasets.
Scientists found that the statistically flat behavior of the global lightning record from the NASA Lightning Imaging Sensor over the same decadal period is consistent with this hiatus in global warming.
What follows is the paper’s abstract:
Multiple records of global temperature contain periods of decadal length with flat or declining temperature trend, often termed a ‘hiatus’. Towards assessing the physical reality of two such periods (1940–1972 and 1998–2014), lightning data are examined. Lightning activity is of particular interest because on many different time scales it has been shown to be non-linearly dependent on temperature. During the earlier hiatus, declining trends in regional thunder days have been documented. During the more recent hiatus, lightning observations from the Lightning Imaging Sensor in space show no trend in flash rate. Surface-based, radiosonde-based and satellite-based estimates of global temperature have all been examined to support the veracity of the hiatus in global warming over the time interval of the satellite-based lightning record. Future measurements are needed to capture the total global lightning activity on a continuous basis.”
So much for settled science.


Yes, the surface temperature warming slowed down a bit in the 21st century. Especially if you begin you timeline right after the late 90s El Nino. The Ocean heat content increase didn’t slow down during that time though.
And speaking of Hiatus’ … nothing “wiped out” the CO2 GHE. But thanks for suppressing replies where I tried to make Kenneth aware of his misunderstanding of the paper he posted a few days ago 😉
The RF for the CO2/WV (GHG) GHE was -0.04 W m-2/yr during 1992-2014 despite the +42 ppm CO2 increase during that period. If CO2 is the main factor in determining the the GHE influence on temperature changes, and this GHE influence was flat to slightly negative during the 1992-2014 period – the +42 ppm CO2 increase amounted to -0.04 W m-2/yr – then it’s accurate to say the CO2 influence was wiped out.
First of all, the figure you are presenting here is what the author calls “oceanic G_aa” and is a rate of change. Thus this claim means the “oceanic G_aa” didn’t change in a statistically significant way during that time. That is not what I would understand from the term “wiped out”.
Secondly, G_aa isn’t just the CO2 GHE, it includes clouds, water vapor, etc … it is derived by the author from OLR satellite measurements and the Hadcrut4 surface air temperature dataset.
No, that is not accurate. You could say the cloud cover change compensated for the increase of the CO GHE in that time, letting the total GHE not increase further in intensity. But then again, this paper only looked at surface air datasets and completely ignored the ocean heat content that increased during the period that is called “a warming hiatus”. Thus the calculated greenhouse effect of course somewhat matches the temperature record with that short period of a pseudo hiatus (see woodfortrees graph in my other comment, or figure 1 of the paper that Pierre presents in the article).
Correct. But for people like you who believe 100% of the warming and heat increases are derived from the CO2 increase, CO2 therefore becomes the variable within the GHE that determines the RF trend for the overall GHE, which was, in this case (1992-2014), -0.04 W m-2. In other words, the GHE influence on the 1992-2014 warming (with nearly all the warming occurring between 1992-1998) was reduced to a non-trend. The +42 ppm CO2 increase was wiped out (a trendless GHE RF).
The authors’ emphasis was not on the temperature/heat content change. The authors were focused on the hiatus (-0.04 W m-2/yr) in the GREENHOUSE EFFECT and its radiative forcing (RF) trend or influence on surface air temperatures. That’s why they entitled the paper “A Hiatus of the Greenhouse Effect”.
Apparently you keep getting sidetracked by this word (hiatus). Or, as I suspect, you keep on trying to make this paper about a hiatus in temperature so you can distract from the conclusion that the GHE’s influence on temperatures was trendless during a period when temperatures and OHC rose.
Because of the dominance of cloud radiative forcing, a small change in cloud cover can render a +42 ppm CO2 increase (RF) trendless/ineffectual. The CO2 rise was wiped out by the +SW cloud cover RF changes (i.e., the +6.8 W m-2 increase in SW cloud forcing during 1984-2000).
Again, it wasn’t “wiped out”. The influence is still there. You wouldn’t (probably) claim that not eating potato chips for a while would “wipe out” the influence milk shakes have on you either, would you?
Or in other words, without the CO2 influence the total GHE (calculated from the author in that paper) would have decreased.
The GHE in the paper is calculated from surface air temperatures and outgoing LW radiation. Of course it is connected to the first variable then … again, the great buffer (=oceans) has some influence on surface air temperatures, don’t you agree? Ignoring this results in a calculated GHE that well … misses a vital part of the equation. Meaning, if the GHE in this paper is the difference between OLR and surface radiation according to Boltzmann calculated from the surface air temperature, then a buffer – like the oceans surely are – is influencing this construct.
If I were a skeptic, I would ask myself how this happened, given the method the GHE (G_aa) is derived from 😉
Not really … the influence from the increase is still there. Without this influence what the author calculated as GHE wouldn’t be trendless.
Again, it wasn’t wiped out and a SW increase certainly can’t do that. I also find it strange that a skeptic regards results of a paper like this one as hard facts like you do in this comment. Anyway, can a trendless waterflow still further fill the bucket? What do you think?
Between 1992-2014, the GHE’s radiative forcing influence was -0.04 W m-2/yr. In other words, there was no positive forcing from the GHE during that period. Instead, the warming influence came from the positive SW forcing via the reduction in cloud cover (i.e., +6.8 W m-2 during 1984-2000).
No, I wouldn’t, SebastianH. Milk shakes have an influence on me when I eat them.
And with the CO2 influence, the total GHE was trendless to slightly negative. How is this a testament to the domination of CO2 (per your beliefs)? Cloud cover changes can render +42 ppm CO2 of alleged RF trendless.
Um, what is a “trendless waterflow”?
The paper isn’t about forcing, it is a GHE anomaly that is being looked at. Like trendless waterflows filling a bucket a trendless GHE that is larger than it should be still causes warming. I wouldn’t call CO2 dominating the GHE, but it’s the only variable that is increasing. Other variables are … well … variable. Up and down they go.
I really have no idea how anyone can look at the data (or that paper) and conclude that CO2 had no influence, especially considering how the GHE is calculated in that paper.
Well, except for the highly positive surface solar radiation forcing, which dwarfed the alleged effects of CO2 with a +6.8 W m-2 forcing during 1984-2000. This is what dominates – and explains – recent warming.
And another 2018 paper is —
Reinforcement of Climate Hiatus by Decadal Modulation of Daily Cloud Cycle
Jun Yin, Amilcare Porporato (Princeton University)
Available for free download at https://arxiv.org/abs/1803.01752
These computer modeling people seem pretty convinced that there is a hiatus, and have tried to explain it.
And another paper ‘Satellite-based regional warming hiatus in China and its implication’
by Long Li Yong Zha
https://www.sciencedirect.com/science/article/pii/S0048969718331978
So back in 2013 they had a conference about the hiatus!
But it may make you wonder where all this rapid warming that the cAGW types go on about has really happened. Some warming for sure, we are coming out of the LIA, rapid and dangerous warming — UTTER NONSENSE!
And there’s my comment from before at https://notrickszone.com/2019/03/28/scientists-the-co2-greenhouse-effect-was-cancelled-out-by-clouds-during-1992-2014/comment-page-1/#comment-1299877
Of course the model can’t see a hiatus because they’re tune to force too much warming with rising CO2. This is known as this shows —
https://agupubs.onlinelibrary.wiley.com/doi/full/10.1029/2018EA000401
[my bold]
The paper is about the 2003-2014 “hiatus” in atmospheric temperatures btw …
http://woodfortrees.org/plot/hadcrut4gl/from:1960/plot/hadcrut4gl/from:2003/to:2014/plot/hadcrut4gl/from:2003/to:2014/trend/plot/hadcrut4gl/from:1960/trend
Just in case anyone is in doubt of what is generally seen as “the hiatus” 😉
Paper in full: http://sci-hub.tw/https://doi.org/10.1016/j.jastp.2019.03.011 (see also figure 1 for what they say was/is a hiatus.
Not a day yet this early spring season has there been a temp of over 58 degrees Fahrenheit. Not since last September has there been any temp near that mark.
Usually, the temps are well over 60 F by now.
Isn’t the CO2 forcing supposed to cause global warming?
There isn’t supposed to be a warming hiatus, the temps are supposed to increase until the Arctic is ice-free.
Going to have to keep kicking the catastrophic anthropogenic global warming can down the road.
Some are not buying the cAGW sthik.
Thank you for the reference
The Cherry Trees in the Tidal Basin have bloomed 7 weeks early.
April Fools! – – – a day late.
The US Park folks claim the reached ‘peak bloom’ yesterday – April 1; more less on the average (~ April 4th)
A few years ago the EPA was so sure this event would be a good indicator of “climate change” that they posted a chart:
https://www.epa.gov/climate-indicators/cherry-blossoms
Nice photos and info here:
https://cherryblossomwatch.com/
Ocean indicators as comprehensively set out at Climate4You show clear signs of overturning of the ocean temperature wavetrain and reversal of warming to incipient cooling. This coincides with and is casually linked with the normal cyclical downturn in the AMO, which in the last few months is dropping quite sharply.
http://www.climate4you.com
[…] Read more at No Tricks Zone […]
[…] Read more at No Tricks Zone […]
[…] https://notrickszone.com/2019/04/02/another-new-study-supports-early-21st-century-warming-hiatus-was… […]
[…] https://notrickszone.com/2019/04/02/another-new-study-supports-early-21st-century-warming-hiatus-was… […]