By Kirye
and P. Gosselin
Once predicted to be ice-free by climate “experts”, the Arctic ice has not lost any volume over the current decade.
Using the modelled ice volume data from the Danish Meteorological Institute (DMI), we see June 15 volume trend has been flat since 2010:
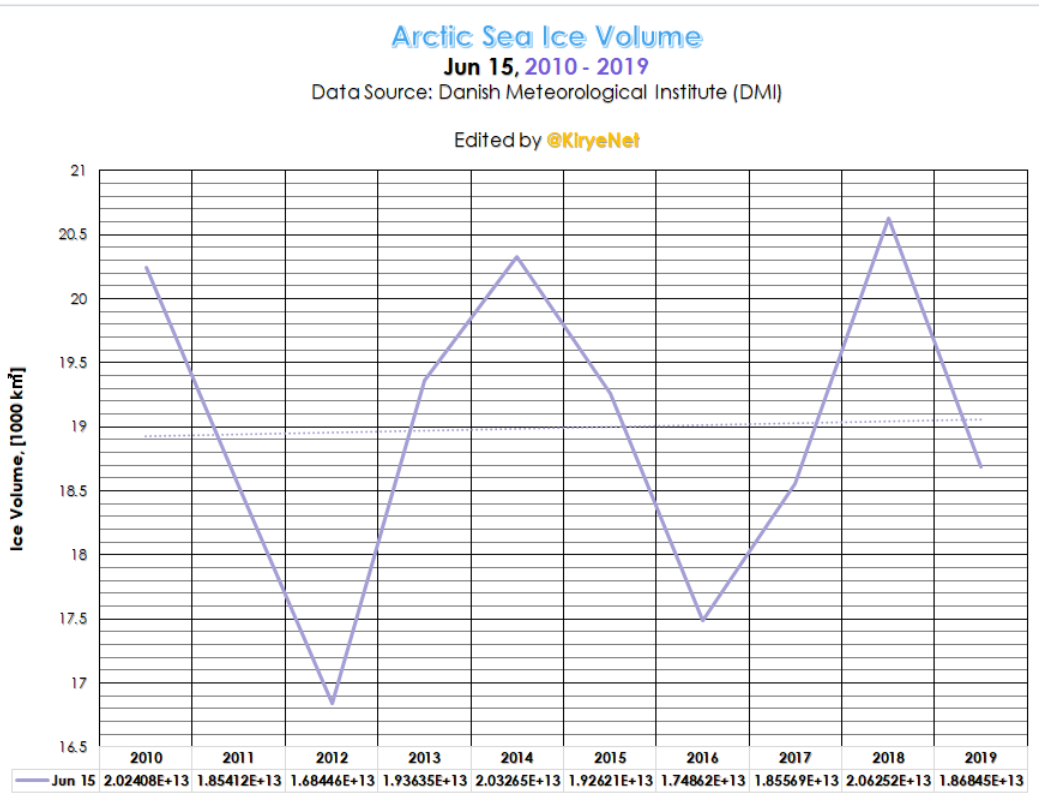
Data source: DMI
Next we examine the fluctuating ice volume, going back to March 2006:

Data source: DMI
The above plot shows how Arctic ice volume has not gone down in 13 years, i.e. since climate experts began warning in earnest that the Arctic had entered a “death spiral”.
Strongly correlated with natural Atlantic ocean cycles
That the Arctic has plateaued at a low level does not surprise a number of climate and weather experts, who say it is natural and in large part connected to the North Atlantic sea surface temperature oscillations:
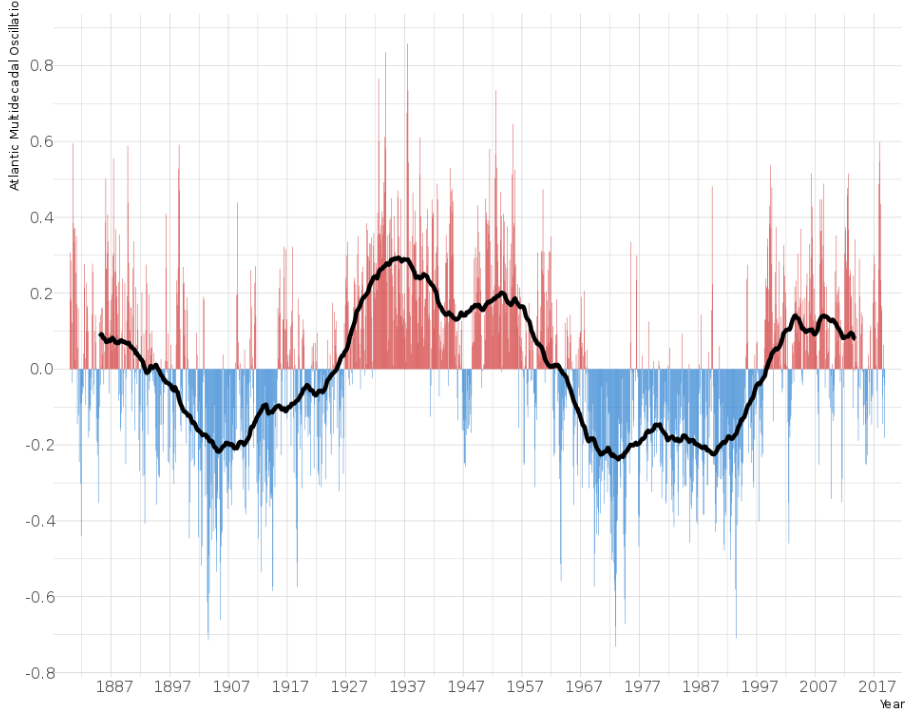
Atlantic Multidecadal Oscillation Index according to the methodology proposed by van Oldenborgh et al. 1880-2018.
Arctic ice strongly connected to natural ocean cycles
Note how September minimum ice shown below corresponds to the AMO index, which indicates changes in North Atlantic sea surface temperatures.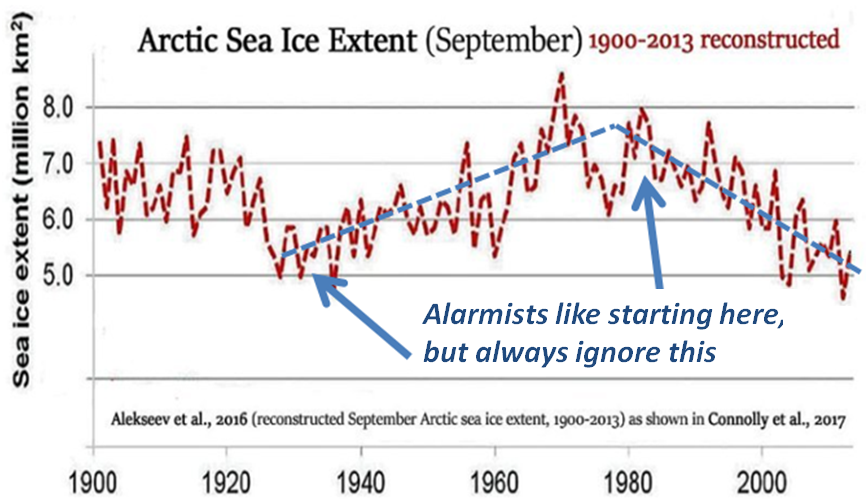
Little wonder alarmists always like starting their charts in the late 1970s.
Antarctic Dome A Sets New Record Low!
Ending on an anecdote, Swiss veteran meteorologist Jörg Kachelmann tweeted Antarctic Dome A station set a new record low at -82.7°C for this station yesterday.
Gestern gab es an der Antarktis-Höhenstation Dome A mit -82:7 Grad einen Kälterekord für die Station seit Beginn der Messungen dort.https://t.co/Ez5co6nh6w
— Jörg @kachelmann anderswo: @realkachelmann (@Kachelmann) June 16, 2019


Watching how the “political” rhetoric aligns with measured climatic trends, one would believe that many “scientists” who support OWG through theUN are fully aware that many natural cycles are repeating over time. Hence, we have a major push now because if (when) the Atlantic cycle turns down, everything else, including sea ice and sea level are likely to follow. The “ice age cometh” scare attempt of the 70s is fresh in the minds of folks who are in their 60s and 70s, and we constitute a significant political cohort in many Western nations. The UN/Green Blob advocates likely know that it is now or never for their scam to succeed. Recruiting children is a desperation measure, but the bigger that movement becomes, the more difficult it will be to defeat. We are playing a dangerous game.
Thanks for the information.
A minor issue, however.
The first chart with the thin blue line (emphasis on ‘line’)
is not a “best choice” for discrete data points.
Here is a view: False line
Having taught this sort of stuff, please excuse my teacher instinct:
In the blue-line ice chart, there is a high point at the center of the 2018 column. There is a low point in the 2019 column. Those ‘centered” points are measured discrete data. Nothing else on the straight line between those 2 points is meaningful. While one can read Ice Volume on the left margin, the x-axis has only 10 data points (each is June 15 of a year).
The vertical line separating 2018 from 2019 intersects the blue line at 19.65. This number is not associated with any date. It is not meaningful.
A simple vertical line chart is a better choice.
Why use the ice volume at a date where ice is traditionally melting pretty fast?
It is worth looking at longer trends than that though. Artic sea ice minimum volume used to be above 1000 km³ and your graphs shows it is now regularly reaching below 5000 km³.
Great, then you believe it should swing back to higher volumes soon, right? That theory is testable. What happens if you guys are wrong?
There are many reconstructions available, it’s little wonder why skeptics chose this one.
The cherry picking continues …
P.S.: Greenland – which is kind of part of the Arctic – lately saw record melt days.
*used to be above 10000 km³
@SebH
”It is worth looking at longer trends…”
Just 2 weeks ago I showed you what was wrong with your accusation of “cherry picking.” Have you forgotten already?
See here for that, and the other point I made.
https://notrickszone.com/2019/06/04/climate-scientists-astounded-no-arctic-ice-loss-in-13-years-early-june-arctic-ice-growing/#comment-1300867
With a Tony Heller video, yes … how could I forget that. You are hilarious in the way that you think this “shows me” something, Yonason.
Oh, I don’t think it “shows” you anything, troll. You are immune to reality, as your mockery of Heller shows. Funny how you continue to demean his work, despite never having been able to show him to be wrong about anything.
No, the Heller video was for those who can think and are actually able to process information, not you – a point I’ve made before but you keep missing.
Indeed Yonason,
”It is worth looking at longer trends …”
I’ll just cherry-pick some records then …
Looking back to the mid 1930s and mid 1940s high ice retreat rates occurred (400-800m/yr), moderate ice retreat rates between 1965-1985 (~200 m/yr, except for Upernavik) and high ice retreat rates again after 2000 (>200 m/yr).
So nothing unusual going on currently, it’s been seen before.
However, since the meridional overturning circulation strength and associated heat transport is currently declining, (Frajka-Williams et al., 2017), this may lead to cooling bottom waters during the next decade around fjords in West-Greenland.
As this planet moves out of the LIA era hopefully Greenland can be returned to the green and pleasant land it once was.
Yes, and forests should grow back after the ice that buried them melts. How their return could be a bad thing or un-natural, only a warmist could conceive.
A German writing to Nir Shaviv about fanatical warmists called their wild ideologal posturing “Affentheater.” I do believe he nailed it.
Your excellent work Kirye, tallies well with Bonan et al., 2019 (https://www.cambridge.org/core/services/aop-cambridge-core/content/view/E65F046030777965553F903C67A4439F/S0022143019000352a.pdf/influence_of_north_atlantic_climate_variability_on_glacier_mass_balance_in_norway_sweden_and_svalbard.pdf )
As originally reported by Kenneth Richard on this blogsite …
This work identified that glaciers throughout Norway, Sweden and Svalbard are influenced by the NAO, which is associated with the routing and intensity of winter storms – consistent with several previous studies (e.g., Pohjola and Rogers, 1997; Nesje and others, 2000; Rasmussen, 2007; Nesje and others, 2008; Marzeion and Nesje, 2012; Trachsel and Nesje, 2015).
However, dynamical adjustment also revealed that the glaciers residing farther north show progressively more influence of AMO-like anomalies, which suggests that while the NAO is the primary driver of glacier mass-balance variability in the region, both modes of climate variability act to drive anomalies in accumulation … AMO variability contributes to anomalously warmer or cooler summers over North America and western Europe (Sutton and Hodson, 2005), changes in northern hemispheric mean surface temperature (Knight and others, 2006) and Arctic sea-ice variability (Miles and others, 2014; Li and others, 2018) through the basin-wide redistribution of heat and mass. In the wintertime, a positive AMO phase and above-normal surface temperatures may elevate the rain-snow line, thereby altering the amount of snow accumulation on glaciers.
…
[T]he leading SLP predictor patterns show a center of negative correlation over the Scandinavian region. This is consistent with the persistent anti-cyclonic pressure system that tends to form over Scandinavia in the summer (Luterbacher and others, 2004). Such high-pressure systems are associated with clear skies, which result in the availability of more radiation for glacial melt.
RE – Greenland record melt.
Nope. Nothing to get hysterical about.
http://nsidc.org/greenland-today/
Yonason, not talking about May 6th …
We are in June now, remember?
https://nsidc.org/greenland-today/greenland-surface-melt-extent-interactive-chart/
Take it up with NSIDC. I just quoted their “…GREELAND TODAY… article.
Also, if you have a point to make, rather than just a pointless smarmy wiseass non sequitur, feel free to make it.
I won’t hold my breath waiting,
[…] 18.6.2019: Am 15.6.2019 gab es an der Antarktis-Höhenstation Dome A mit -82,7 Grad Celsius einen Kälterekord für die Station seit Beginn der Messungen […]
Arctic ice – the “Ising” on the cake?
A 100 year old model proves its worth:
https://www.sciencedaily.com/releases/2019/06/190617084844.htm
Ising pattern formation:
https://youtu.be/y0KCpJ7WCEE
Also this paper shines a light on what’s going on in Greenland (also reported at this site by Kenneth Richard.)
Hahn et al., 2019 (https://www.sciencedirect.com/science/article/pii/S0048969718331978 )
[…] der Arktis im Trend: Meldungen über schwindendes Meereis in der Arktis sind Fake-News. Siehe auch: Keine Eisschmelze in der Arktis in dieser Dekade. Quelle: DMI-Plots Ice Cover Zum Vergrößern anklicken. Der DMI-Plot für die Entwicklung der […]
[…] der Arktis im Trend: Meldungen über schwindendes Meereis in der Arktis sind Fake-News. Siehe auch: Keine Eisschmelze in der Arktis in dieser Dekade. Quelle: DMI-Plots Ice Cover Zum Vergrößern anklicken. Der DMI-Plot für die Entwicklung der […]