By Kirye
and Pierre Gosselin
Whenever NASA GISS announces how recent global temperatures are much hotter than, for example, 100 years ago, just how statistically reliable are such statements?
Most will agree, based mainly on sundry observations, that today is indeed warmer than it was when surface temperatures began to be recorded back in 1880. But we will never really know by how much.
Surface station datasets full of gigantic voids
When we look at NASA GISS’s site here, we can see how many surface stations have data going back to earlier years. Today we see that 2089 stations are at work in Version 3 unadjusted data.
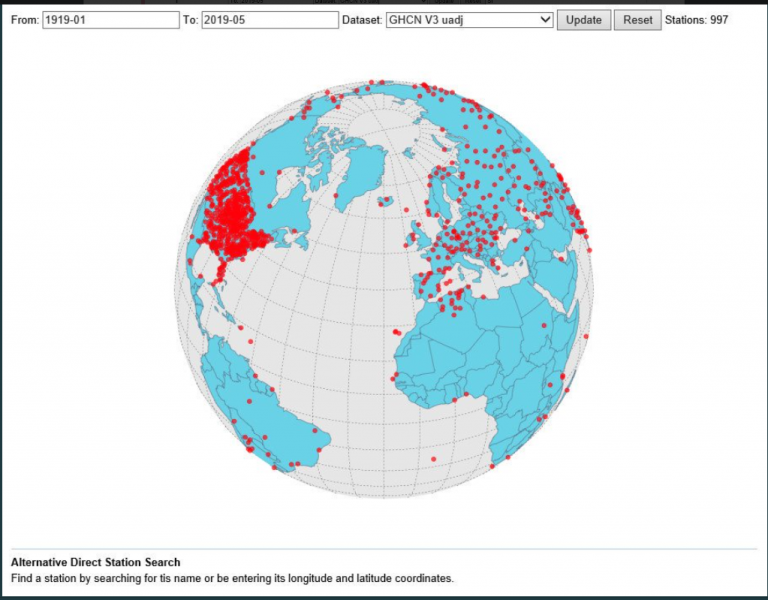
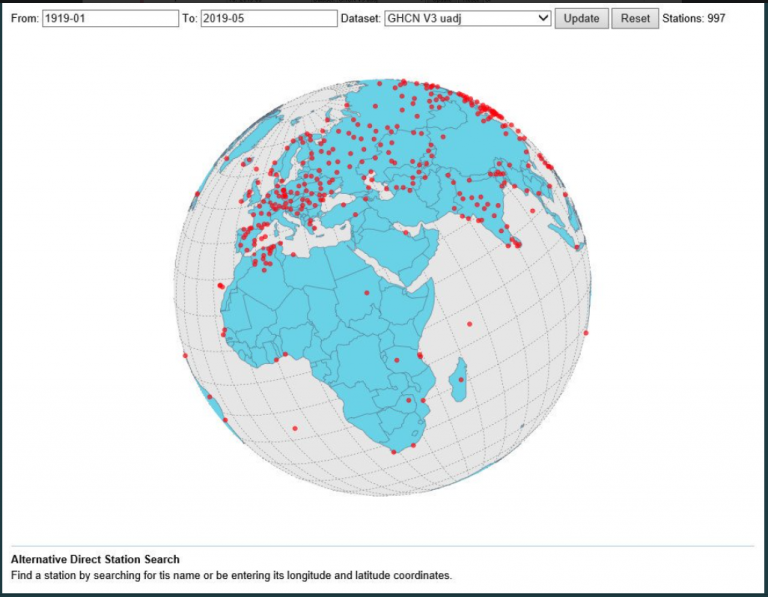
Yet, when we go back 100 years (to 1919), we see only 997 of these surface stations have Version 3 unadjusted data that is complete:
Source: NASA GISS
Note how the Version 3 unadjusted datasets going back to 1919 are poorly distributed and sorrowfully lacking over Africa, Canada, the Arctic and all across the Southern Hemisphere. Never mind the oceans.
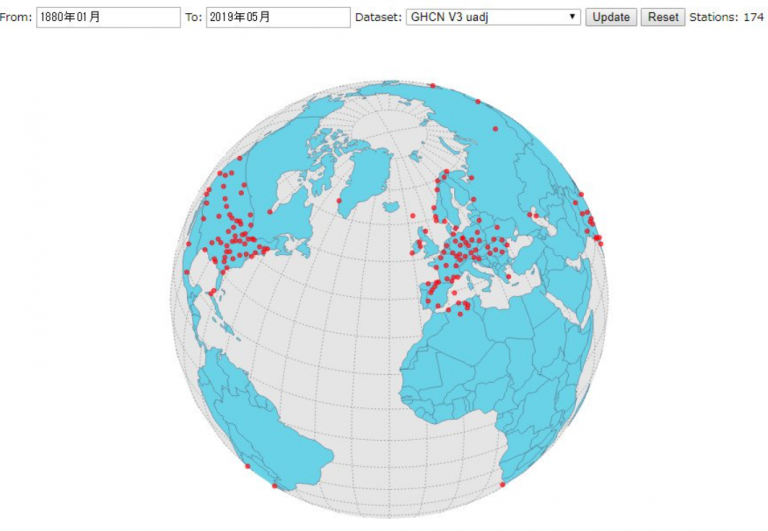
Only a measly 174 surface stations go back to 1880!
And when we look at the number of stations in Version 3 unadjusted data going back to 1880, ONLY 174 stations actually provide us with a complete thermometer dataset:
 giss.nasa.gov/gistemp/station_data_v3/ …
As is shown, Version 3 unadjusted data going back to 1880 covers only some parts of the US and Europe. All of Canada and Russia are void of data, and so it is impossible to know what the temperatures there really was.
The same is true for the entire southern hemisphere, let alone the entire globe. The bottom line: There is no way of knowing what the global temperature really was back in the late 19th century and early 20th century.
Japanese expert: data of “no scientific value”
This tells us that global temperature trends since the start of the Industrial Revolutions presented by NASA are fraught with huge uncertainty.
“This is nothing new,” says Japanese climate expert Dr. Mototaka Nakamura in an email to NTZ. “We simply did not have many observing stations in the 1800s and early 1900s. They can produce ‘new data sets’ and claim that they have ‘better data sets’ all day long, but they just can’t make any meaningful difference for periods up to 1980.”
“Not real data”
“These datasets are products of simulation models and data assimilation software, not real data,” Dr. Nakamura added. “This problem has been present in data products produced by all institutions from the beginning – NASA, NOAA, NCEP, ECMWF, UMet, etc.”
“Spatial bias before 1980 cannot be dealt with”
But the data shortcomings get even worse. Dr. Nakamura wrote: “A far more serious issue with calculating ‘the global mean surface temperature trend’ is the acute spatial bias in the observation stations. There is nothing they can do about this either. No matter what they do with the simulation models and data assimilation programs, this spatial bias before 1980 cannot be dealt with in any meaningful way. Just look at the locations of the observation stations used in GISS products for various years on their page.”
Dr. Nakamura commented earlier here at NTZ: “The global surface mean temperature change data no longer have any scientific value and are nothing except a propaganda tool to the public.”
So how can we be sure about the globe’s temperatures, and thus it’s trends before 1980? You can’t. The real data just aren’t there.


The only valid data set is the satellite data set. It only goes back to 1980, but that is unimportant; we have plenty of time. I hope and pray that the keepers of this data set are and remain honest brokers.
It’s pretty bad today- Africa, one fifth of the world’s land mass- estimated temps.
WMO- “Because the data with respect to in-situ surface air temperature across Africa is sparse, a one year regional assessment for Africa could not be based on any of the three standard global surface air temperature data sets from NOAANCDC, NASA-GISS or HadCRUT4. Instead, the combination of the Global Historical Climatology Network and the Climate Anomaly Monitoring System (CAMS GHCN) by NOAA’s Earth System Research Laboratory was used to estimate surface air temperature patterns.”
[…] Fonte: No Tricks Zone […]
Thinking of the 1880’s. LA Times was busy playing up a little heat wave out here. LA topped out at 86 yesterday.
Interesting to note that record high for yesterday, July 15th, in downtown Los Angeles is 98, set back in 1886. Also, the record high for the entire month of July is 109 set on July 25, 1891. And, that is without any potential Urban Heat Island Effect (would not be any back then), of which the EPA says:
“The term heat island describes built up areas that are hotter than nearby rural areas. The annual mean air temperature of a city with 1 million people or more can be 1.8–5.4°F (1–3°C) warmer than its surroundings. In the evening, the difference can be as high as 22°F (12°C).
One can assume that in order to actually tie the 109 temp today – assuming that it’s a rather calm and sunny day downtown would actually need to hit somewhere between 111 and 115 degrees F, in order to adjust for the UHIE.
@garyh845
Yes. There is no basis for altering raw data using the adjustments they make. There are times when obviously** “bad” data can be slightly adjusted for the purpose of statistical analysis. But if you treat all data as “bad,” then adjustments are of no use.
And while estimations of temperatures in areas where they have little to no raw data may be an acceptable research project, treating them as, and including them with, legitimate raw data is even worse than the outlandish adjustments they make.
**(paraphrased from a prob/stats text I have): If some of your data stands out as “bad,” and small adjustments make this data then behave statistically acceptably within the context of the “good” data, then adjustments may be valid. If not, there is nothing that can legitimately be done about it. They didn’t mention a case of adjusting all the data, presumably because it’s not valid in any case.
Pierre:
I assume you have seen the series of reports on the GISS databases in Chiefio.
He checked the adjustments between 2 sets of data, along with geographical distribution.
I was particularly struck by the figures for Djibouti, where a single thermometer was used, elimination equipment or location changes, yet the past readings were adjusted downward to make warming seem real.
And, as one commentator, pointed out that there were 4 naval forces stationed there who could have supplied extra data.
@Graeme No.3
Thanks for that Chiefio ref. I posted a response there.
https://chiefio.wordpress.com/2019/05/18/dijibouti-why-what-changed/#comment-114687
Added to the paucity of pre-satellite data, UHIE etc, there is the problem that the original collectors and curators of the surface data were looking for evidence of human influence.
For instance when it was realized that their pre-1945 temperature rise could not have been caused by human CO2 emissions it was adjusted to suit.
http://www.realclimate.org/images//GISS-adjustments.jpg
Thank you, Dr. Nakamura, for your clear and honest articulation the problem, and Kirye for communicating that to us.
[…] Read more at No Tricks Zone […]
The UN controlled ‘Climate Scientist™’ and the bureaucrats of the IPCC have always lied about global surface temperatures, that was evident when the Climategate papers were released.
40 years of drivel about Global Warming (aka Climate Change), about CO2 warming and still there is only natural variation evident. No doubt some cAGW ignoramus will try and say otherwise but they have no proof of increases in atmospheric CO2 raising air temperatures anywhere on this planet’s surface.
Tom Mason, I like your succinct bottom line. Please contact me,
Michael Mandeville at mwman@q.com
The NOAA, NASA, Berkeley Earth, Hadley Center, and Cowtan & Way organizations published earth temperature change data that closely agreed with one another that between about 1945 & 1980 the temperature average remained relatively constant. Their own data therefore reveals that human increasing activity did NOT cause temperature increase! This was published in the March 2019 ‘Professional Pilot’ magazine , page 62 , “Climate Change And Aviation’ by Karsten Sheine, ExploreEiS director and and former NOAA climatologist.
[…] https://notrickszone.com/2019/07/16/nasa-giss-surface-station-temperature-trends-based-on-sheer-gues… […]
[…] science has many fundamental problems. One of them is the sparsity and mayor gaps in valid global temperature data prior to about 1980 and particularly prior …. This lack of data prior to he advent of satellite temperature data is a result of little data […]
[…] ons afkomen. Een Japanse klimaatwetenschapper van het MIT- Boston Nakamura, die zegt dat al die data natte vinger werk is en dat er gewoon niets aan klopt en het pure propaganda is en verzonnen data. Of […]
[…] Climate Expert: NASA GISS Surface Station Temperature Trends Based On Sheer Guess Work, Made-Up Data […]